Chart pattern mistakes happen when a familiar shape is labeled before the structure has earned that label. The common error is not simply being wrong after the fact. It is treating resemblance, one candle, a temporary boundary breach, or weak context as if they confirmed the pattern.
A pattern-like shape can be useful as a first observation, but it is not enough by itself. The label becomes more meaningful only when boundary behavior, timeframe, prior reactions, and follow-through support the classification.
Key Points
- A chart pattern mistake begins when visual resemblance is treated as structure too early.
- Context, timeframe, and prior reactions affect whether a pattern label is meaningful.
- A temporary boundary breach is not the same as sustained acceptance beyond that boundary.
- Volume can support interpretation, but it does not approve a pattern by itself.
- Pattern analysis is safest as a diagnostic process, not as a prediction tool.
What Makes a Chart Pattern Mistake Different From Normal Uncertainty
Not every failed pattern reading is a mistake. Markets can remain uncertain even when the original classification process was reasonable. A mistake appears when the label was weak from the start because the evidence did not support the structure being named.
The useful distinction is process quality. If the pattern was labeled only because the chart looked familiar, the problem sits in recognition. If the structure had clear boundaries, repeated reactions, and context support but later failed, the issue may be normal uncertainty rather than a bad classification process.
Diagnostic rule: judge the evidence used to label the pattern before judging the outcome. A clean process can still produce an uncertain result. A weak process may look correct for a while and still be a mistake.
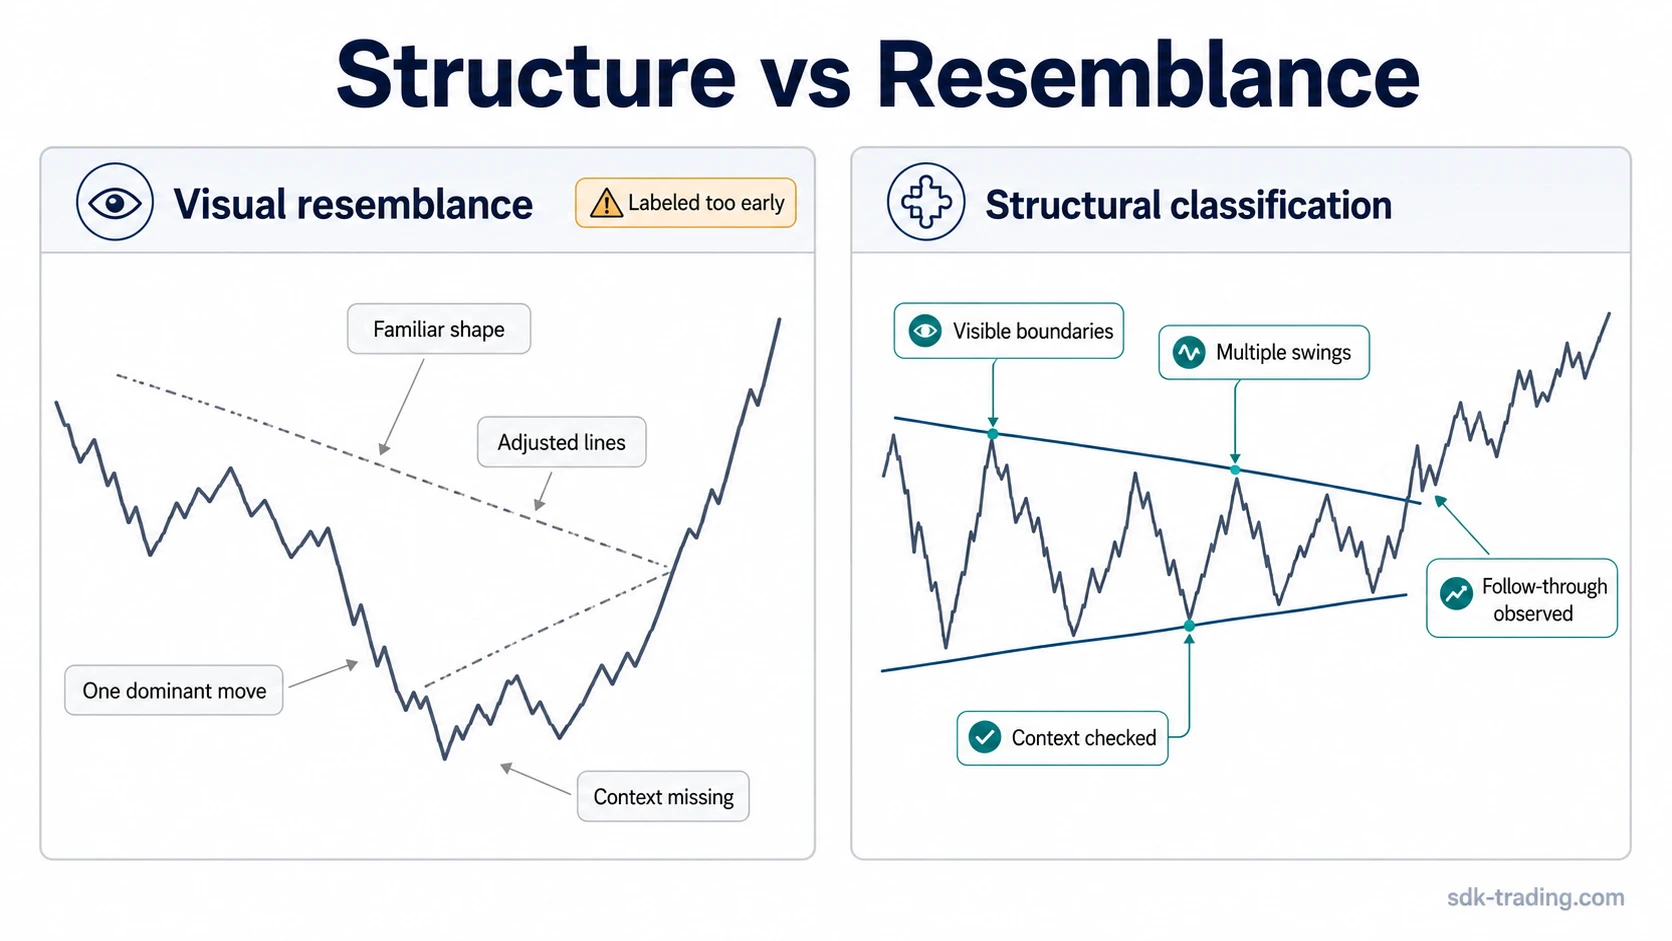
Pattern Resemblance vs Structural Classification
Visual resemblance is the early impression. Structural classification is the stronger test. A chart may resemble a known pattern after lines are adjusted, swings are ignored, or one dramatic candle receives too much weight. That creates false confidence because the label depends on fitting the chart to the pattern instead of reading the structure that was already visible.
A stronger classification does not require a perfect textbook outline. It requires boundaries that were visible before the label, swings that define the structure, and context that does not contradict the interpretation.
| Visual resemblance | Structural classification |
|---|---|
| The shape looks familiar after the fact. | The boundaries were visible before the label became useful. |
| The label depends on adjusted or forced lines. | The label survives without forcing the chart into a cleaner outline. |
| One candle dominates the interpretation. | Multiple swings define the structure. |
| Context is ignored because the shape appears obvious. | Trend, range, timeframe, and prior reactions are checked before the label is used as the main interpretation. |
Common Chart Pattern Mistakes
Many chart pattern mistakes come from the same failure path: a visible feature is promoted into a complete pattern before enough supporting evidence exists. The specific feature can be a neckline, a breakout, a sharp reversal, a volume spike, or a clean-looking shape.
| Mistake condition | Common misread | Safer interpretation |
|---|---|---|
| Shape resemblance appears before clear boundaries. | The pattern is treated as confirmed because it looks similar to a known formation. | Treat the shape as a candidate until boundaries and reactions support the label. |
| A temporary boundary breach appears. | The first move beyond the boundary is read as acceptance. | Separate a brief breach from sustained behavior beyond the boundary. |
| One strong candle forms near the pattern edge. | The candle is treated as the whole pattern decision. | Use the candle as context only; chart patterns need multi-swing structure. |
| Lines are adjusted until the pattern looks clean. | The chart is forced into a familiar pattern name. | Check whether the label still works without redrawing the structure repeatedly. |
| Timeframes give conflicting signals. | A small pattern is treated as more important than the larger structure around it. | Read the lower timeframe inside the higher-timeframe condition, not in isolation. |
| Volume expands during a visible move. | Higher activity is treated as automatic confirmation. | Use volume as supporting context, then check price result and follow-through. |
| Volatility increases inside the pattern. | Noisy movement is mistaken for decisive participation. | Distinguish unstable movement from controlled boundary behavior. |
| The expected pattern label is chosen too early. | Later candles are interpreted only as evidence for the preferred label. | Keep competing explanations open until the structure removes them. |
Context Errors: Trend, Timeframe, and Prior Reactions
A chart pattern does not carry the same meaning in every location. Trend condition, range behavior, prior reactions, and timeframe relationship can change the interpretation. A formation that looks convincing in isolation may become weaker when the larger structure shows repeated failed attempts, compression without follow-through, or a pattern forming in the wrong part of the move.
Timeframe distortion is one of the most common recognition problems. A small reversal shape can look decisive on a lower timeframe while the higher timeframe still shows only noise inside a wider range. The mistake is not using a lower timeframe. The mistake is allowing the lower timeframe to override the structure that contains it.
Context check: a pattern label is weaker when it depends on ignoring the trend behind it, the range around it, or the reactions that formed before it.
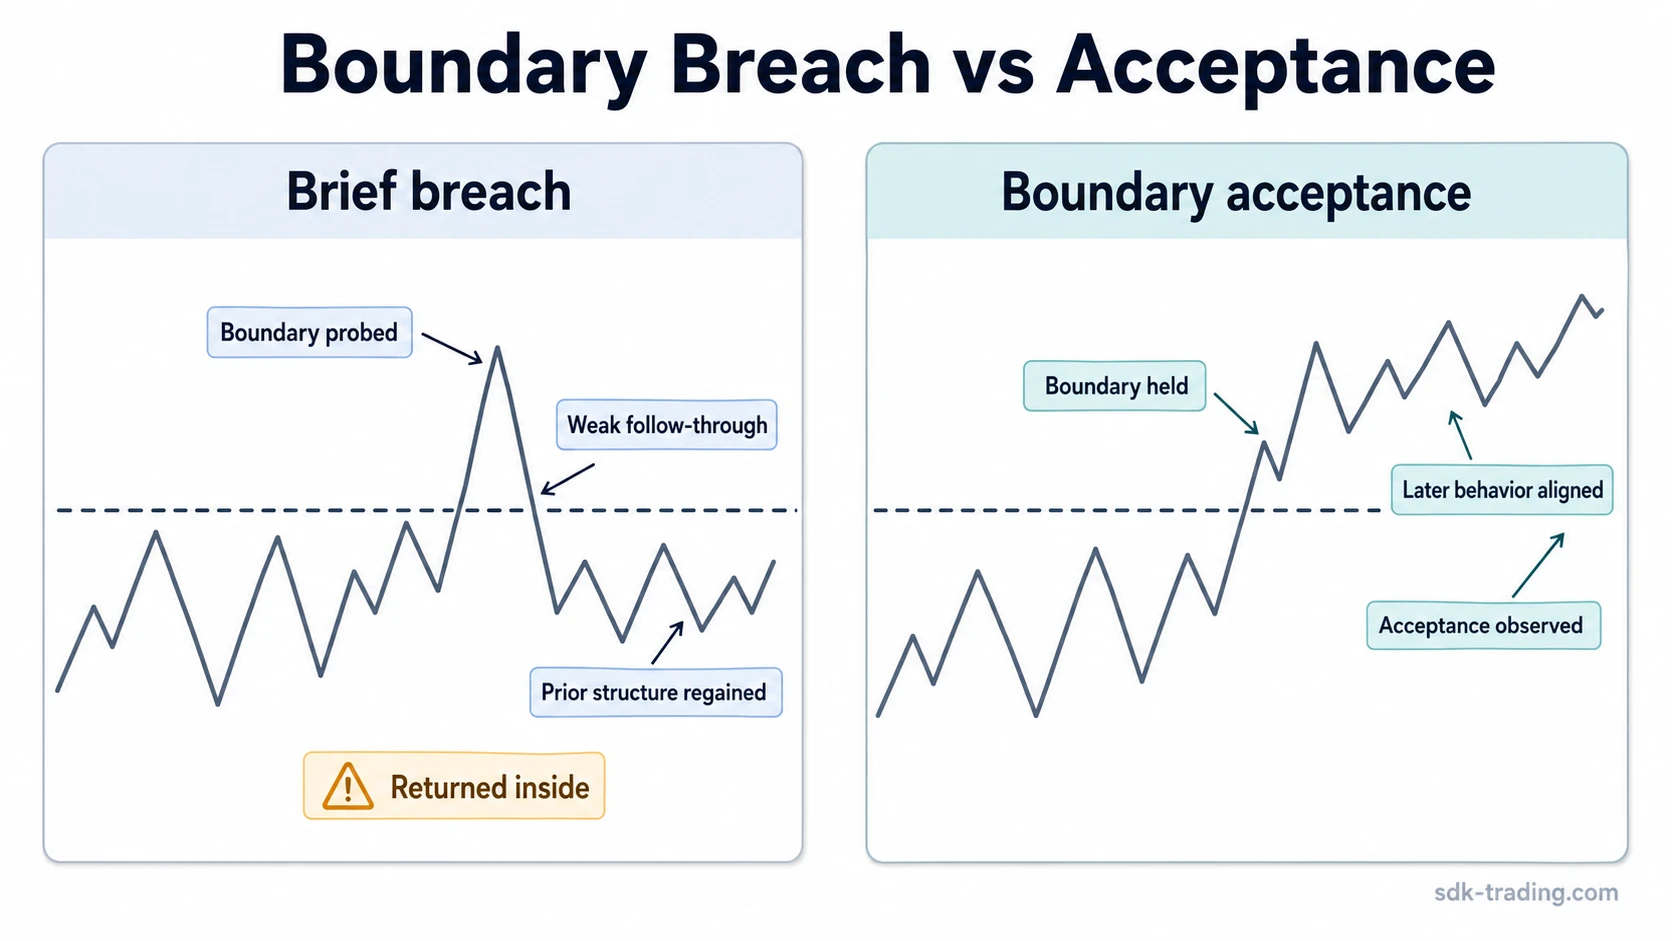
Boundary and Confirmation Mistakes
Boundary behavior is often where chart pattern mistakes become visible. A line, neckline, range edge, or pattern boundary may be crossed briefly without proving that price has accepted the new area. Treating the first breach as confirmation creates a premature reading.
A boundary test becomes more meaningful when behavior after the breach supports the interpretation. Weak follow-through, immediate return inside the prior structure, or repeated failed attempts can all show that the boundary was probed rather than accepted.
| Boundary event | Weak reading | Stronger diagnostic question |
|---|---|---|
| Price briefly moves beyond the pattern boundary. | The breach is treated as confirmation. | Did price remain accepted beyond the boundary, or did it return inside the structure? |
| The move beyond the boundary has high activity. | Volume is treated as proof. | Did the price result match the activity, or did effort produce a weak result? |
| The pattern has a clean visual outline. | The visual outline replaces follow-through evidence. | Does later behavior support the label, or only the appearance? |
Single-Candle Overread vs Multi-Swing Structure
Candles can help describe pressure at a specific point, but they do not replace the structure of a chart pattern. A large candle, long wick, or reversal candle may appear near a boundary, yet the pattern still depends on how several swings created that boundary and how price behaves after the test.
The overread happens when a candle becomes the whole explanation. A candle can support a pattern reading when it appears in the right structural location, but the structure still has to exist independently of the candle.
Why Perfect-Looking Patterns Can Still Be Weak
A clean outline can be misleading when the internal behavior does not support it. Perfect symmetry, clean diagonal lines, or a familiar reversal silhouette can hide poor context, thin participation, or weak reaction quality. Pattern quality is not the same as drawing quality.
Sharp reversal shapes can be prone to this problem because fast visual turns can look decisive before the surrounding structure is clear. A V-bottom reversal pattern can be misread when a fast rebound is labeled before the market has shown that the lower area was rejected with enough structural support.
A V-top reversal pattern can be misread in the opposite direction when a sharp drop is treated as a complete reversal before context and later behavior support that classification.
Volume and Participation Misreads
Volume is useful context, but it does not confirm a chart pattern on its own. High volume can appear during failed moves, emotional reactions, forced movement, or noisy repositioning. Low volume can also appear during pauses that later become meaningful. The interpretation depends on the relationship between activity, price result, and location inside the structure.
The common mistake is reading volume as approval. Activity can support a pattern reading only when the price result and later behavior also support the same structure. It does not turn a weak shape into a confirmed structure without boundary quality and follow-through.
Safe Interpretation Checklist
Chart pattern analysis becomes more disciplined when the label is tested before it is used as the main interpretation. This checklist is diagnostic only. It is not an entry process, exit process, or trade-management rule.
- Was the pattern visible before the final move, or only after redrawing the chart?
- Are the boundaries clear enough without forcing trendlines or ignoring awkward swings?
- Does the higher timeframe support the same reading, or does it reduce the pattern to noise?
- Did price accept the boundary area, or only breach it temporarily?
- Does volume support the price result, or does activity expand without structural progress?
- Is the interpretation based on several swings, not only one candle?
- Could another label explain the same structure just as well?
- Has the label been chosen because evidence supports it, or because the expected pattern is preferred?
Chart Pattern Failure vs Chart Pattern Mistake
A failure and a mistake are not the same thing. A chart pattern can be reasonably identified and still fail later because market behavior changes. A mistake happens earlier, when the structure was not strong enough to justify the label in the first place.
The distinction matters because it changes what gets reviewed. A failure review asks what changed after the structure formed. A mistake review asks whether the structure was ever strong enough to be named.
FAQ
Are chart pattern mistakes the same as failed chart patterns?
No. A failed chart pattern may have been identified through a reasonable process and then lost acceptance later. A chart pattern mistake usually appears earlier, when resemblance, weak context, or a temporary breach was treated as confirmation before the structure supported the label.
Can a clean-looking pattern still be a bad reading?
Yes. A clean outline can still be weak if the boundaries were forced, the timeframe context contradicts the label, or the move beyond the pattern boundary does not hold. Drawing clarity is not the same as structural quality.
Does high volume confirm a chart pattern?
High volume can support a pattern reading, but it does not confirm the structure by itself. The price result, location, boundary behavior, and later follow-through still matter.
Why does timeframe change chart pattern interpretation?
Timeframe changes interpretation because a pattern that looks clear on a lower timeframe may still be noise inside a wider higher-timeframe structure. The mistake is allowing the smaller pattern to override the larger condition that contains it.