Wyckoff phases and schematics organize trading ranges by separating range development from visual range structure. Phases describe how a range changes over time. Schematics show common ways that accumulation or distribution can be arranged inside that range.
The main distinction is between the range type and the map used to describe it. A range may be studied as possible accumulation, possible distribution, or an unresolved structure. A schematic organizes the sequence, but price behavior, testing, acceptance, and rejection still decide whether the map is justified.
Key Points
- Wyckoff phases describe how a trading range develops over time, while schematics show common visual ways that range behavior can be organized.
- Accumulation and distribution are different range interpretations, not just opposite labels.
- A schematic is a classification tool, not confirmation by itself.
- The cleanest reading separates range type, phase position, and schematic fit before drawing a stronger conclusion.
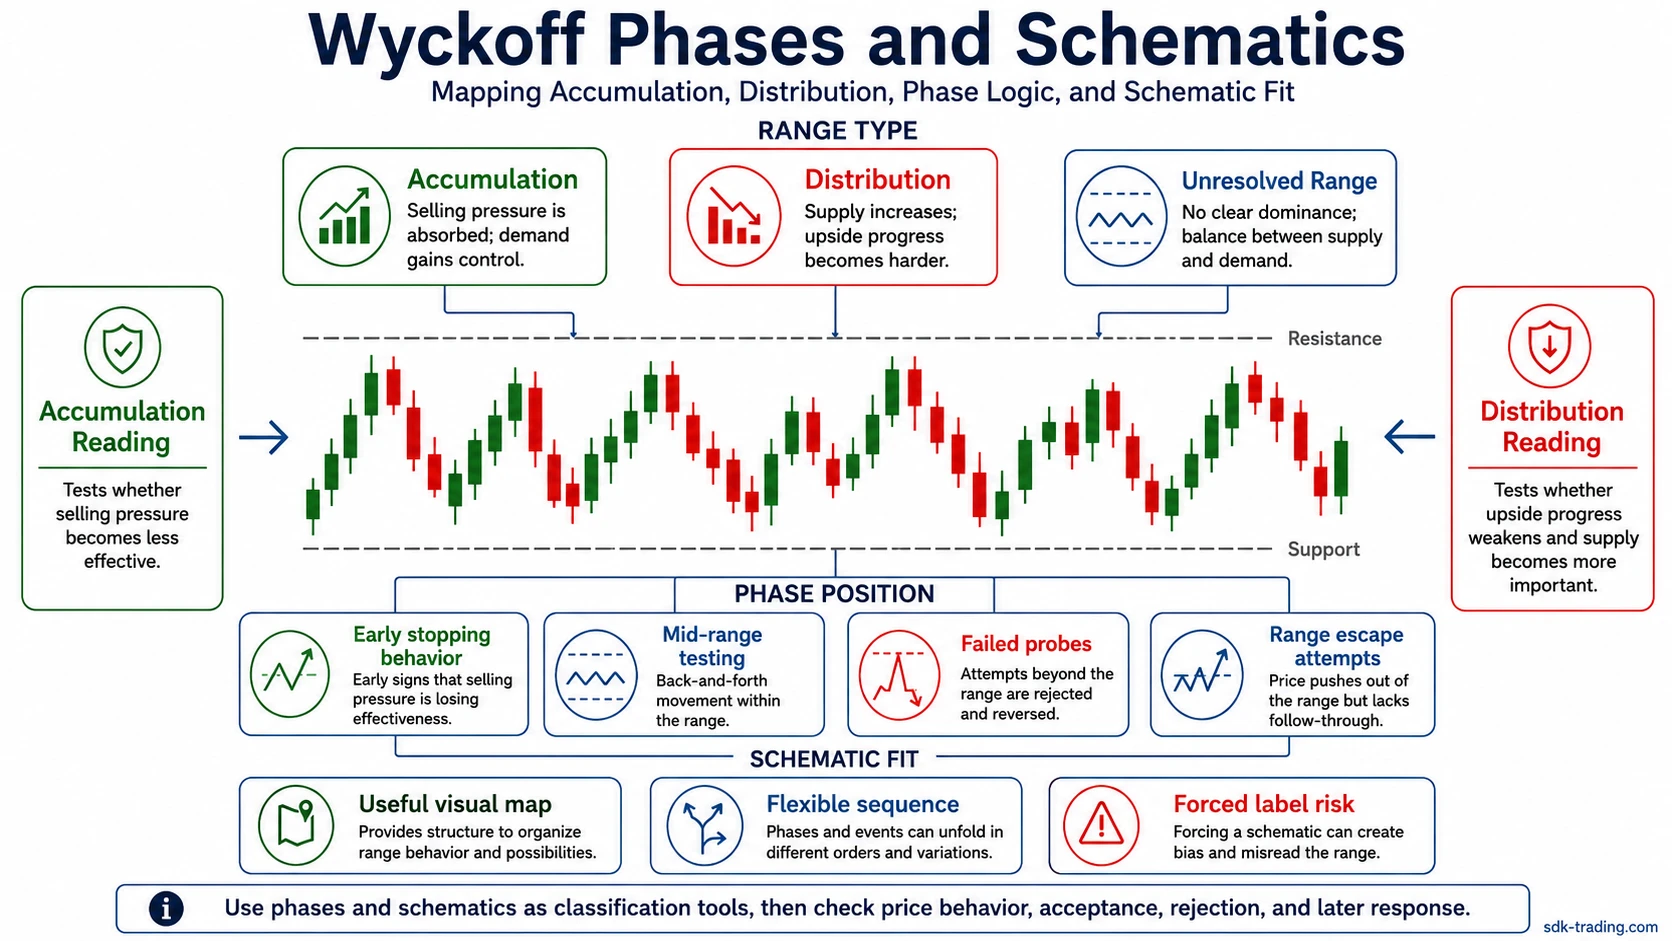
Core Concepts in Wyckoff Phases and Schematics
The first split is between accumulation and distribution. These are not just opposite labels. They describe different range contexts, different forms of supply and demand behavior, and different ways a sideways structure can resolve.
| Concept | Role in the range | What it clarifies |
|---|---|---|
| Wyckoff accumulation | Possible absorption structure | How selling pressure may become less effective before demand supports a later advance. |
| Wyckoff distribution | Possible transfer or weakening structure | How upside progress can weaken before supply becomes more important than demand. |
| Wyckoff schematic | Visual phase map | How phases, tests, and range behavior can be arranged inside a Wyckoff reading. |
How Phases and Schematics Work Together
Phases divide a trading range into broad developmental areas. A range may begin with a stopping or change-of-behavior area, move into rotation and testing, then later attempt to leave the range. The phase label helps organize that sequence, but it does not prove whether the structure is accumulation, distribution, or only sideways activity.
A schematic gives the phase structure a visual form. It can make the range easier to classify, especially when price behavior follows a recognizable accumulation or distribution path. The weakness appears when the schematic is treated as a fixed script rather than a flexible map.
A real range can be compressed, extended, noisy, or incomplete compared with a textbook schematic. The useful question is whether the schematic improves the reading of range behavior without forcing a conclusion that price has not supported.
Accumulation, Distribution, and Schematic Fit
An accumulation reading is not simply a range near lows. It depends on whether selling pressure becomes less effective, whether tests fail to produce meaningful downside progress, and whether demand begins to support higher-quality movement inside or out of the range.
A distribution reading is not simply a range near highs. It depends on whether upside attempts become less efficient, whether higher-price tests fail to hold, and whether later behavior shows that supply is becoming more important than demand.
The schematic sits between these two interpretations. It can describe the shape of the range, but the accumulation or distribution reading still comes from the behavior inside the structure.
Three Boundaries That Keep the Reading Clean
| Boundary | What it separates | Why it matters |
|---|---|---|
| Range type | Possible accumulation, possible distribution, and unresolved sideways behavior. | It prevents the reading from starting with a schematic label before the underlying range behavior is clear. |
| Phase position | Early stopping behavior, mid-range testing, failed probes, and later range escape attempts. | These parts of the range do not carry the same meaning, even when they appear inside the same schematic. |
| Schematic fit | A useful visual map versus a forced pattern label. | A clean schematic can improve classification. A forced schematic can blur the difference between a useful map and unsupported interpretation. |
Common Misread
The common misread is treating a Wyckoff schematic as confirmation by itself. A schematic can organize the range, but it cannot replace the evidence inside the range. The reading becomes weaker when the labels look clean but price behavior does not support the implied accumulation or distribution structure.
For that reason, phases and schematics work best as classification tools. They help separate range stages, compare possible structures, and keep accumulation and distribution readings from being mixed into one vague range explanation.