Wyckoff distribution schematic is a market-structure model that shows how a prior advance can transition into a trading range, repeated upper-area tests, weakening demand, signs of weakness, last points of supply, and possible markdown.
A distribution schematic is not a trade signal or a guaranteed reversal pattern. It is a context map. The reading becomes more useful only when price, volume, spread, close location, rejection, and later tests support the idea that supply is becoming more effective than demand.The core question is acceptance versus rejection near the upper area. Distribution becomes more credible when higher prices fail to hold, later rallies produce weaker result, and downside reactions begin to show more effective supply.
Key Points
- Wyckoff distribution is a range-based market-structure reading after a prior advance.
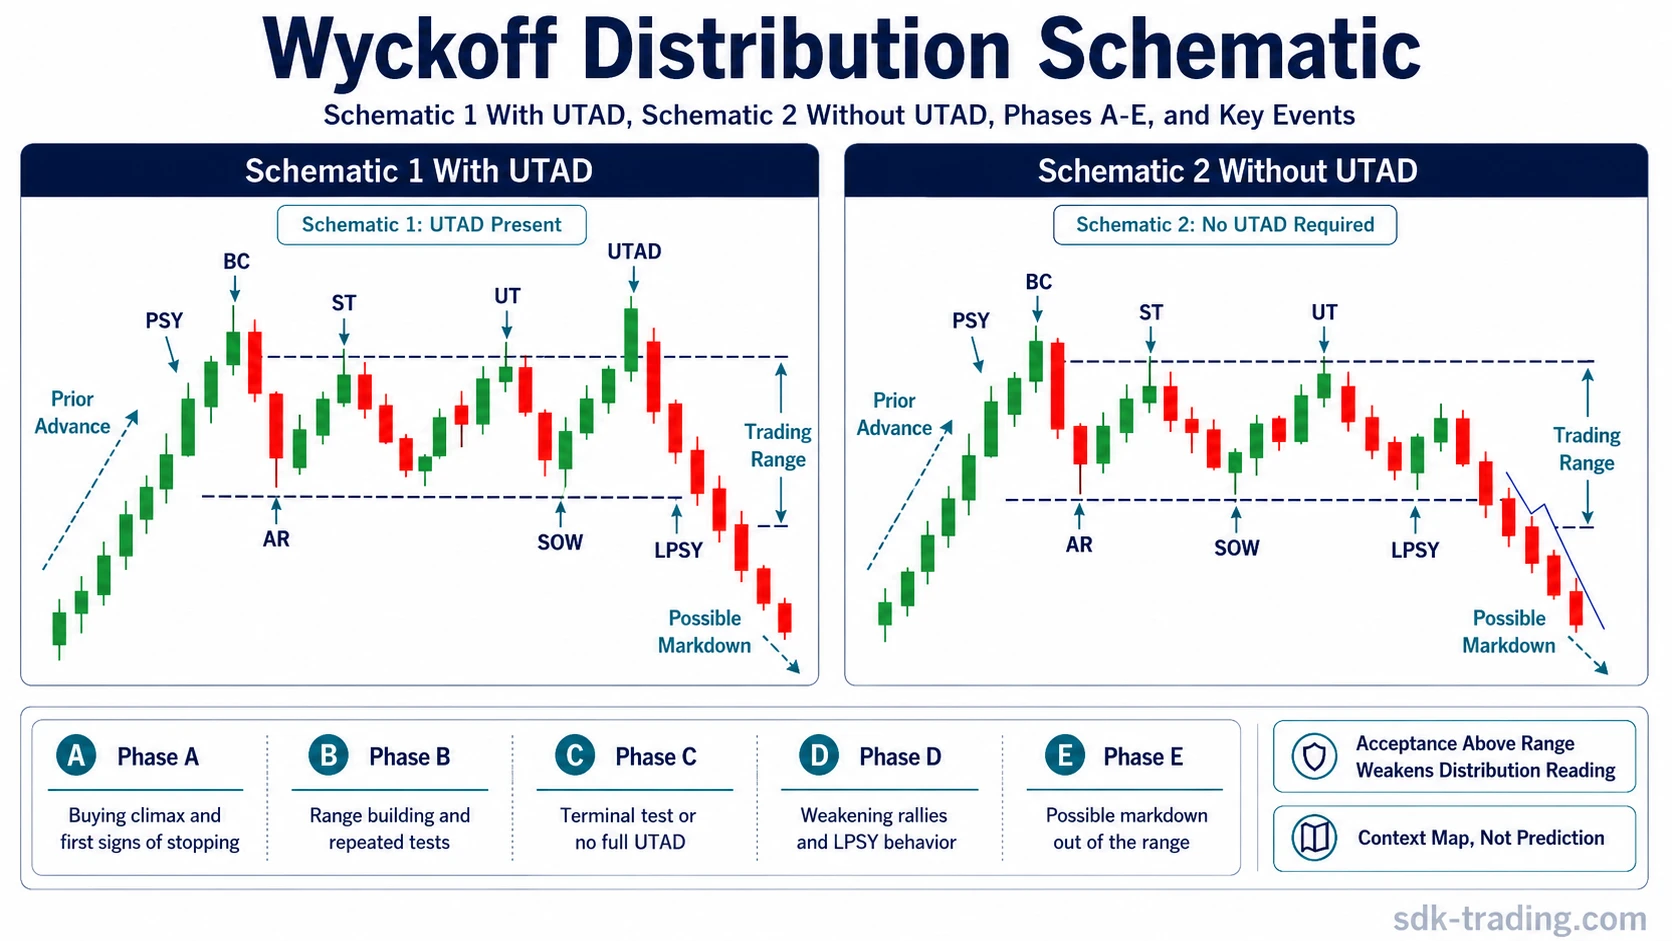
- The schematic organizes possible events such as PSY, BC, AR, ST, UT, UTAD, SOW, and LPSY.
- Schematic 1 usually includes a clearer UTAD above the range, while Schematic 2 can develop without a full UTAD.
- Phases A-E describe the transition from slowing upside progress to possible markdown or failed distribution.
- Acceptance above the range weakens the distribution reading because demand is still proving effective.
What Wyckoff Distribution Means
Wyckoff distribution describes a market environment where a prior advance stops making clean upside progress and price begins rotating near an upper area. Demand may still appear active, but the important question is whether effort is still producing meaningful continuation.The practical interpretation is supply transfer. Stronger holders may use demand inside the range to reduce exposure, while later buyers accept increasingly poor continuation quality. That transfer is not directly visible as a certainty. It is inferred from behavior such as failed rallies, weak upside result after effort, repeated rejection near higher prices, and later downside response.Distribution remains a reading, not a label that can be assigned from one candle, one probe, or one high-volume session. The range must be judged through sequence: what happened before the range, how rallies behave inside it, how price reacts above it, and whether later tests confirm or weaken the idea.
Wyckoff Distribution Schematic at a Glance
A Wyckoff distribution schematic is a visual model for reading a range after an advance. It does not prove that markdown must follow. It helps organize the evidence: where the prior advance slowed, where supply first appeared, how the range developed, whether the upper area was accepted or rejected, and whether later rallies failed after weakness appeared.
| Area | What it shows | Why it matters |
|---|---|---|
| Prior advance | Demand was previously effective and price moved higher. | Distribution normally needs an advance first because the model describes supply emerging after upside progress. |
| Trading range | Price stops trending cleanly and begins rotating. | The range gives the market a place to test demand, supply, acceptance, and rejection. |
| Upper-area tests | UT or UTAD may appear near or above resistance. | Higher prices become suspect if they fail to hold and return back into the range. |
| Signs of weakness | Downside reactions begin to show more result. | Supply becomes more important when downside movement expands after failed upside attempts. |
| Weak rallies | LPSY behavior can appear after weakness. | Failed rallies after weakness show that demand may no longer regain control efficiently. |
| Resolution or failure | Markdown, renewed balance, or upside acceptance can follow. | The reading remains conditional until later behavior confirms, weakens, or invalidates it. |
Wyckoff Distribution Events: PSY, BC, AR, ST, UT, UTAD, SOW and LPSY
Wyckoff event labels help organize the range, but they should not replace observation. The label is useful only when the surrounding behavior supports it.
| Event | Full name | Role in distribution |
|---|---|---|
| PSY | Preliminary Supply | Early supply appears after a prior advance, warning that upside progress may be meeting resistance. |
| BC | Buying Climax | Demand surges, but the move may mark a point where upside continuation becomes vulnerable. |
| AR | Automatic Reaction | A reaction after the buying climax helps define the lower area of the range. |
| ST | Secondary Test | Price retests the buying climax area to check whether demand can still produce continuation. |
| UT | Upthrust | A move above resistance fails to hold and returns into the range. |
| UTAD | Upthrust After Distribution | A later upper-range test above resistance, often associated with Schematic 1, but not required in every distribution model. |
| SOW | Sign of Weakness | Downside result shows that supply is becoming more effective. |
| LPSY | Last Point of Supply | A weak rally after signs of weakness, often showing poor demand recovery. |
Wyckoff Distribution Schematic 1 vs Schematic 2
The difference between Wyckoff Distribution Schematic 1 and Schematic 2 is usually the presence or absence of a clear UTAD. Schematic 1 often shows a more visible failed move above the range. Schematic 2 can show distribution without a dramatic final breakout trap.
| Feature | Schematic 1 | Schematic 2 |
|---|---|---|
| UTAD | Usually present. | Usually absent. |
| Upper-range test | A clearer failed breakout above resistance can appear. | Weaker demand may appear without a full move above the range. |
| Main reading risk | Overfocusing on the dramatic false breakout and ignoring later confirmation. | Missing distribution because no obvious UTAD appears. |
| What to watch | Rejection after the upper-range failure and the quality of later rallies. | Weak rallies, lower highs, SOW behavior, and poor demand recovery. |
| Interpretation | A clearer trap-style distribution model. | A quieter distribution model where demand can fail without a final dramatic upthrust. |
Wyckoff Distribution Phases A to E
Phases A to E describe the sequence of distribution behavior. They are useful as an organizing model, but the phase label should follow the evidence rather than lead it.
| Phase | Typical role | What to check |
|---|---|---|
| Phase A | The prior uptrend slows and first supply evidence appears. | Look for loss of clean upside progress after an advance. |
| Phase B | The range develops while demand and supply are repeatedly tested. | Watch whether rallies continue efficiently or begin producing weaker result. |
| Phase C | UT or UTAD may test whether buyers still accept higher prices. | Check whether price holds above the range or quickly rejects back inside it. |
| Phase D | SOW and LPSY behavior can show that supply is gaining control. | Watch for expanding downside result and failed rallies after weakness. |
| Phase E | Markdown can develop if downside result expands and rallies continue to fail. | Do not assume completion unless later behavior supports the distribution reading. |
Distribution Reading: Stronger Case vs Weaker Case
| Diagnostic area | Stronger distribution reading | Weaker or failed reading |
|---|---|---|
| Prior context | A prior advance loses momentum and enters a range near higher prices. | The range forms without a meaningful prior advance or without visible loss of upside quality. |
| Upside effort | Rallies require effort but produce weaker continuation or faster rejection. | Upside effort continues to produce clean progress and durable acceptance. |
| Upper-area tests | Tests above or near the upper boundary fail to hold and return into the range. | Price holds above the prior upper area and builds acceptance instead of rejection. |
| Supply response | Supply appears more effective on rallies and downside reactions begin to expand. | Downside reactions remain shallow and buyers continue absorbing supply efficiently. |
| Later behavior | Lower highs, failed retests, SOW, LPSY, or downside breaks with expanding result make the distribution case stronger. | Continued rotation leaves the reading unresolved, or renewed upside progress cancels the bearish interpretation. |
What Wyckoff Distribution Is Not
Distribution is not the same as any sideways market or one upper-boundary failure. A range becomes distribution-like only when upside continuation loses efficiency and repeated attempts to accept higher prices fail.Distribution is also not the same as a single UTAD. UTAD can appear inside Schematic 1, but a full distribution reading still depends on the entire range sequence, not one event label.Phase labels can organize that sequence, but they should not replace the observed evidence. Price result, volume behavior, spread, close location, and later tests carry more weight than the label alone.
Wyckoff Distribution vs Accumulation
Distribution and
describe opposite pressure tests inside range behavior. Distribution asks whether higher prices are being rejected after an advance. Accumulation asks whether lower prices are being rejected after a decline.The distinction matters because both can look like sideways movement at first. In distribution, failed upside progress and poor acceptance above the range make the bearish reading stronger. In accumulation, failed downside progress and poor acceptance below the range make the constructive reading stronger.A range does not need to be classified immediately. Early balance can remain unresolved until the market shows whether the important rejection is occurring near the upper area, near the lower area, or not clearly enough to support either reading.
Distribution, Schematics, and Upper-Range Events
Wyckoff distribution is the market-structure context. A
is a visual model that organizes possible phases and tests inside that context.Terms such as UT, UTAD, SOW, and LPSY describe narrower moments within the distribution environment. They can matter, but they do not replace the full reading. A full distribution case still depends on prior context, rally quality, supply response, and later confirmation or failure.The cleaner distinction is scope. Distribution describes the whole upper-range environment. The schematic describes a model for reading that environment. Individual events describe specific tests within or near the range.
What Can Happen After Wyckoff Distribution
After a stronger distribution reading, a markdown phase can develop if price breaks the range and downside result expands. That outcome is possible, not guaranteed. The quality of the break and the behavior of later rallies still matter.If price accepts above the range, the distribution reading weakens. Acceptance means more than a brief wick or probe. It requires the market to hold the higher area and continue showing effective demand rather than immediate rejection back into the range.If price remains inside the range, the reading can stay unresolved. A trader may see warning signs, but warning signs are not the same as completion. The market still has to show whether supply can produce meaningful downside result or whether demand can reassert control.
Example of a Basic Wyckoff Distribution Reading
Imagine a market that has advanced for several swings and then begins rotating sideways near its highs. The first reaction is not enough to call distribution because strong trends can pause before continuing. The initial observation is only that upside progress has slowed.The distribution case becomes more plausible when later rallies push into the upper part of the range but fail to hold. Volume may expand on attempts to move higher, yet the result is limited and price quickly returns into the range. That behavior can suggest that effort is meeting supply rather than producing clean continuation.The read is still incomplete if the market has not shown what happens after the failed upper-area tests. A stronger case develops when a later rally cannot reclaim the upper area, downside reactions begin to travel farther, and the market spends less time near the highs. A weaker case develops if price reclaims the upper area, holds it, and continues higher with constructive follow-through.The useful comparison is not whether the range looks like a textbook diagram. It is whether each new test strengthens or weakens the distribution reading: rally quality, acceptance above the range, downside result, and later failed retests.
Common Mistakes in Reading Wyckoff Distribution
The first mistake is calling every sideways range distribution. A range only becomes distribution-like when upside progress weakens and supply becomes more effective. Without that behavior, the label is premature.The second mistake is treating Schematic 1 as the only valid distribution model. Schematic 2 can still describe distribution when demand fails without a clear UTAD. The absence of UTAD does not automatically cancel the distribution reading.The third mistake is treating an upper probe or phase label as proof. A brief move above a range high can be meaningful, but rejection, failed retest, weaker upside response, and stronger supply response carry more weight than the label or probe alone.The final mistake is turning the reading into certainty. Distribution can lead to markdown, but it can also fail, extend, or resolve upward. Conditional interpretation is safer than assuming that a range must produce the expected outcome.
FAQ
What is a Wyckoff distribution schematic?
A Wyckoff distribution schematic is a visual model for reading a range after an advance. It organizes possible events such as PSY, BC, AR, ST, UT, UTAD, SOW, and LPSY, but it does not guarantee that markdown will follow.
What is the difference between Wyckoff Distribution Schematic 1 and Schematic 2?
Schematic 1 usually includes a clearer UTAD above the range. Schematic 2 usually does not require a full UTAD and instead relies more on weak rallies, signs of weakness, and poor demand recovery after the range develops.
Does every Wyckoff distribution need a UTAD?
No. UTAD is common in Schematic 1, but it is not required in every distribution model. A distribution reading can still develop without a dramatic final upthrust if later behavior shows weak demand and more effective supply.
What comes after Wyckoff distribution?
A markdown phase can follow if price breaks the range and downside result expands. The outcome is not automatic. Acceptance above the range weakens the distribution reading, while continued rotation can leave the market unresolved.
How is Wyckoff distribution different from accumulation?
Distribution focuses on failed acceptance of higher prices after an advance. Accumulation focuses on failed acceptance of lower prices after a decline. Distribution tests whether supply is becoming more effective, while accumulation tests whether selling pressure is being absorbed.