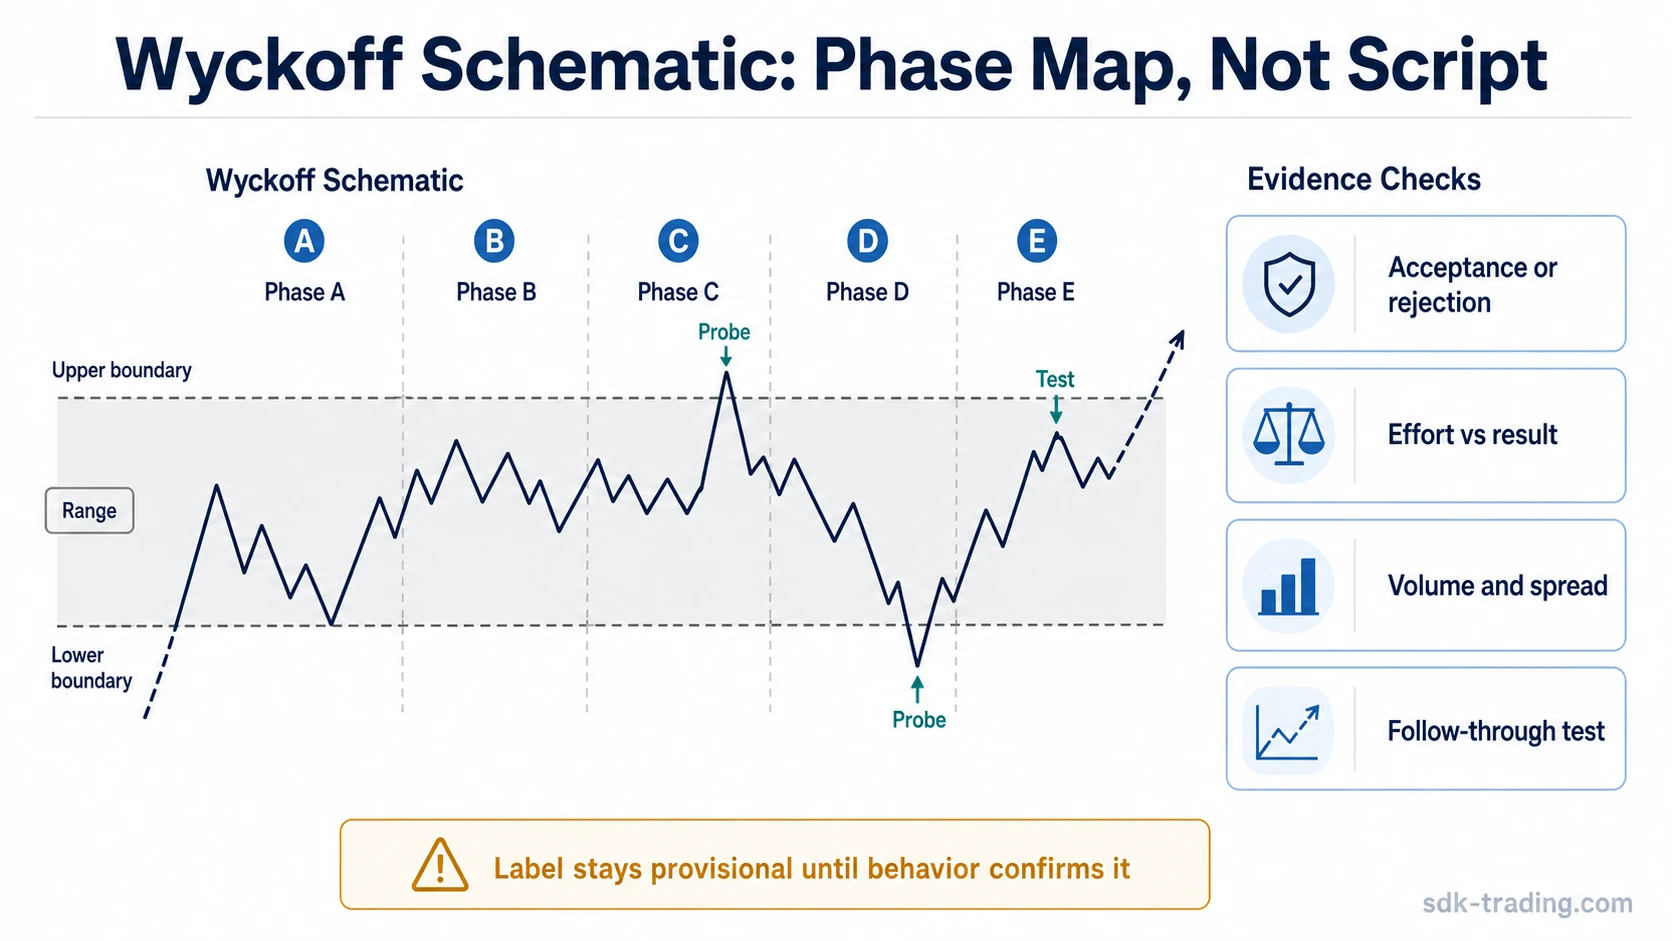
A Wyckoff schematic in trading is a flexible market-structure map that outlines possible phase behavior inside an accumulation or distribution range. It is a reference for interpretation, not a fixed script for what price must do next.
The common mistake is reading the labels before the market has supplied enough evidence. A chart can resemble a schematic visually while the actual behavior still fails to support the label. Price result, volume, spread, location, acceptance, rejection, and follow-through decide whether the reading is becoming stronger or weaker.
Key Points
- A Wyckoff schematic maps possible phase behavior; it does not predict the next move by itself.
- Phase labels are provisional until live market behavior supports them.
- Accumulation and distribution schematics describe different range contexts, but both require later confirmation through behavior.
- Volume, spread, close location, and background conditions help test whether the schematic reading is useful.
Why a Wyckoff Schematic Is Not a Fixed Script
A schematic simplifies market behavior so the sequence can be studied. Real markets rarely follow that outline cleanly. Tests overlap, phases compress, a range can extend, and an apparent event can fail to produce the result expected from the textbook label.The label becomes useful only when it describes behavior already visible in the range. If price marks a lower-area probe but continues accepting lower prices, the accumulation label remains weak. If price probes above the range and then returns with poor upside result, the distribution interpretation may become more credible, but still needs follow-through to support it.The practical boundary is simple: the schematic gives a language for reading the range, while the market decides whether that language fits. The reading improves when the sequence, location, effort, result, and follow-through all point in the same direction.
Phase Outline vs Real Market Behavior
A phase outline gives the possible map. Real market behavior decides whether that map fits the range or needs to be abandoned.
| Schematic element | What it provides | What must be checked in live behavior |
|---|---|---|
| Phase label | A possible position inside the range sequence | Whether price behavior actually matches that phase idea |
| Range boundary | A reference area for tests and reactions | Whether price accepts beyond the boundary or rejects back into the range |
| Spring, shakeout, upthrust, or test | A possible event label | Whether later action confirms rejection, absorption, or continuation |
| Volume change | A clue about effort and participation | Whether effort creates meaningful result or fails to move price efficiently |
| Retest area | A reference point for checking the earlier interpretation | Whether the market rejects the same area again or begins accepting it |
The strongest schematic readings do not rely on shape alone. They connect the outline to actual evidence: where the test happens, how far price travels, whether volume expands or contracts, where the close forms, and whether the next attempt confirms or contradicts the first impression.
Accumulation and Distribution Schematics
An
becomes more defensible when downside progress weakens, lower-area tests fail to continue efficiently, and price begins to spend more time away from the lows. The label remains premature if lower prices continue to be accepted or if rallies cannot improve result.A
becomes more defensible when upside progress weakens, higher-price tests fail to hold, and later rallies produce less result. The label weakens if price accepts above the range and demand remains effective.Both readings start as hypotheses. The difference is not the drawing style but the behavior being tested: one asks whether supply is losing control near the lower area, while the other asks whether demand is losing control near the upper area.
Evidence Inputs That Strengthen or Weaken the Reading
Schematic interpretation depends on how effort converts into result.
helps refine the reading by comparing activity, spread, close location, and background context instead of treating the schematic outline as proof.
| Evidence input | Stronger reading | Weaker reading |
|---|---|---|
| Price result | Effort produces less continuation in the suspected exhaustion direction | Price continues efficiently beyond the tested boundary |
| Volume | Activity appears with poor follow-through or later reduced response | Activity supports clean continuation and acceptance |
| Spread | Wide effort fails to expand result, or later tests narrow meaningfully | Wide spread continues in the same direction without rejection |
| Close location | Closes show rejection of the tested area or reduced effectiveness | Closes confirm acceptance beyond the range boundary |
| Follow-through | The second attempt shows weaker supply or weaker demand response | The second attempt confirms continuation instead of rejection |
A cleaner reading usually appears after the first event, not at the first event. The retest often matters more than the dramatic move because it reveals whether the prior effort changed control or only created temporary volatility.
Common Misreads
| Misread | Why it creates risk | Cleaner schematic reading |
|---|---|---|
| Calling the phase too early | A label such as Phase B or Phase C can organize the chart, but the sequence remains provisional until price behavior begins to match the label. | Use the phase label as a working hypothesis until the range supplies enough matching behavior. |
| Treating one event as the whole schematic | A spring, shakeout, upthrust, or test may contribute to the reading, but one event cannot confirm the entire schematic. | Check whether later behavior accepts or rejects the tested area before treating the event as meaningful. |
| Ignoring failed acceptance | A move beyond a range boundary is not automatically bullish or bearish. The key difference is whether price holds beyond the boundary or returns into the prior structure. | Separate acceptance from rejection before assigning meaning to the boundary break. |
| Forcing every range into accumulation or distribution | Some ranges remain unresolved. A sideways market can rotate without giving enough evidence for either reading. | Leave the label open until the range supplies better evidence. |
Example: When a Schematic Label Remains Provisional
A market declines into a range and then briefly moves below the lower boundary. The visual shape may resemble an accumulation schematic, especially if price returns into the range. The first return only opens the test; it does not complete the reading.The stronger case appears if the later lower-area test holds with less downside result, weaker supply response, and better ability to move away from the lows. The weaker case appears if price accepts below the range or if rallies remain unable to produce meaningful upside result.The useful comparison is not whether the drawing resembles a known schematic. The useful comparison is whether each retest makes the original label more or less defensible.
FAQ
What is a Wyckoff schematic in trading?
A Wyckoff schematic is a market-structure map that outlines possible phase behavior inside an accumulation or distribution range. It helps organize interpretation, but price, volume, spread, and later tests decide whether the reading is valid.
Does a Wyckoff schematic predict price movement?
No. A schematic does not predict the next move by itself. It gives a reference structure for testing whether supply or demand is becoming more or less effective inside a range.
When is a schematic label premature?
A schematic label is premature when it comes from shape alone. The label remains weak if later behavior does not support it through acceptance, rejection, effort versus result, and follow-through.
How do accumulation and distribution schematics differ?
Accumulation schematics test whether supply is losing effectiveness near the lower area of a range. Distribution schematics test whether demand is losing effectiveness near the upper area of a range.
What matters more than the schematic drawing?
The next test matters more than the drawing. A label becomes more useful when the market supports rejection or absorption, and less useful when price accepts the area that the schematic reading expected to reject.