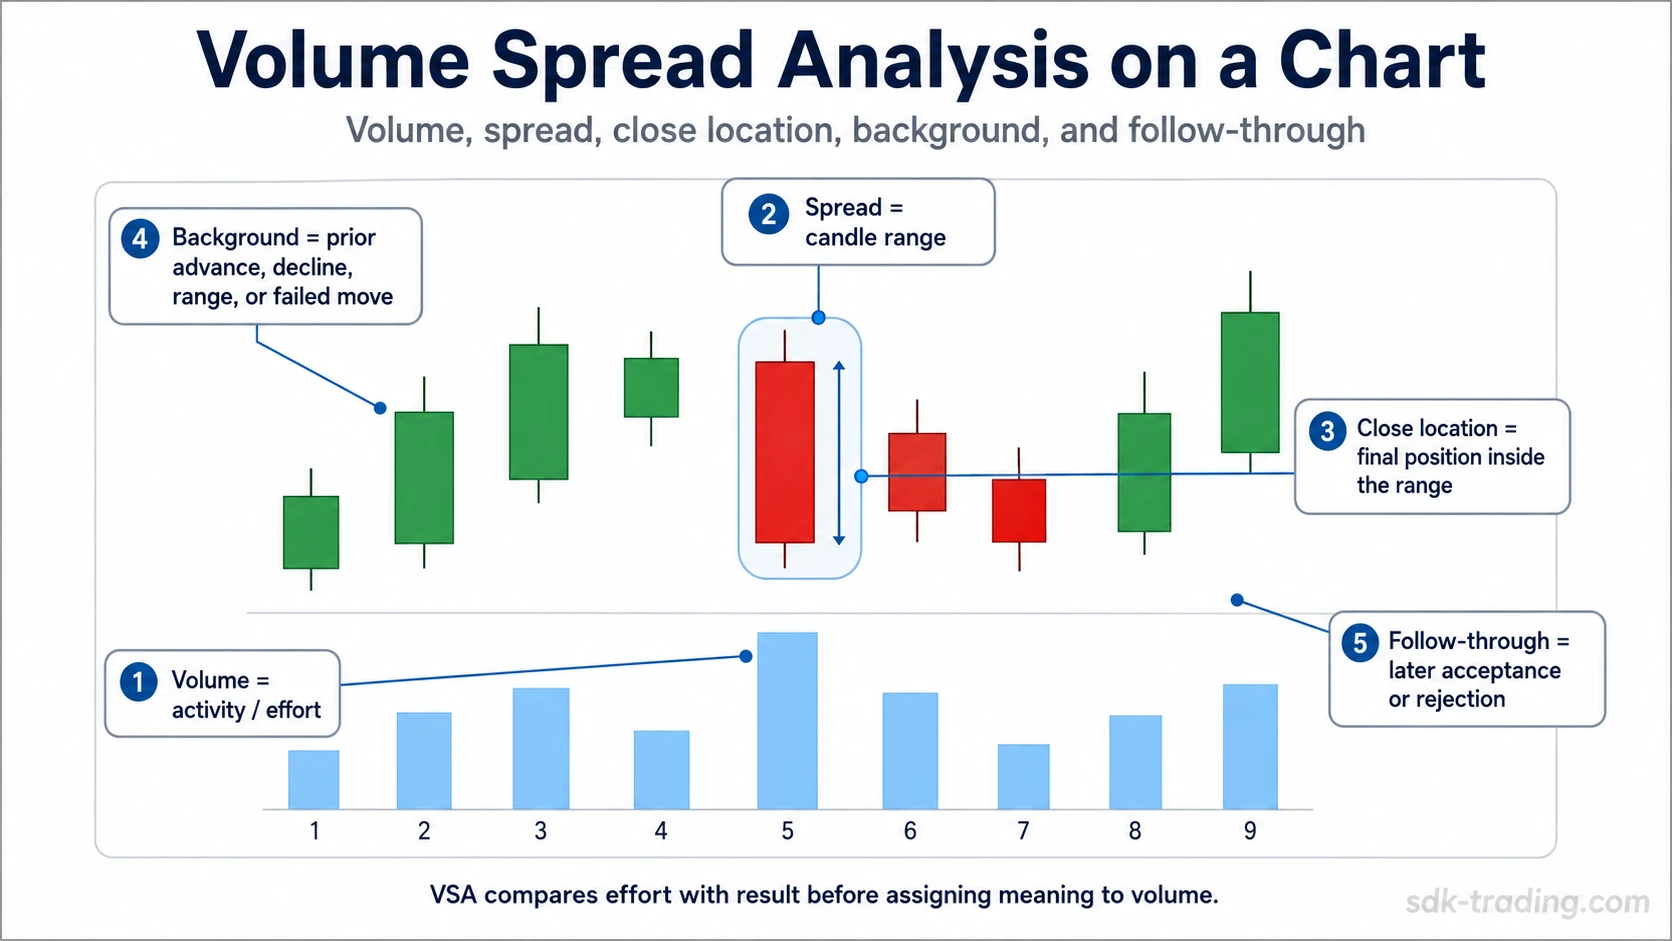
Volume Spread Analysis, often shortened to VSA, is a price-volume reading framework that compares volume, spread or range, close location, background context, and follow-through to interpret possible supply and demand pressure.
The first mistake in VSA is treating a volume spike as the answer. Volume shows activity, not meaning. The reading becomes useful only when that activity is compared with price result, close location, background structure, and later response.
Definition: Volume Spread Analysis, or VSA, is a technical analysis framework that compares visible effort with price result by reading volume, bar range, close location, background context, and later follow-through together.
Key Points
- VSA reads volume together with spread, close location, background context, and follow-through.
- A volume spike does not prove buying, selling, accumulation, distribution, reversal, or continuation by itself.
- The strongest VSA readings compare visible effort with price result and then check whether later bars support or weaken the interpretation.
What Is Volume Spread Analysis?
Volume Spread Analysis reads the relationship between activity and price result. It asks whether the amount of volume produced meaningful movement, failed to produce movement, or created a result that conflicts with the apparent effort.
In VSA context, “spread” usually means the price range of a bar or candle, not the bid-ask spread. A wide spread shows that price travelled a larger distance during the period. A narrow spread shows that price travelled less.
The interpretation comes from the relationship between effort, result, location, and later behavior. A high-volume bar does not explain who is in control by itself, and a wide candle does not confirm strength or weakness without context.
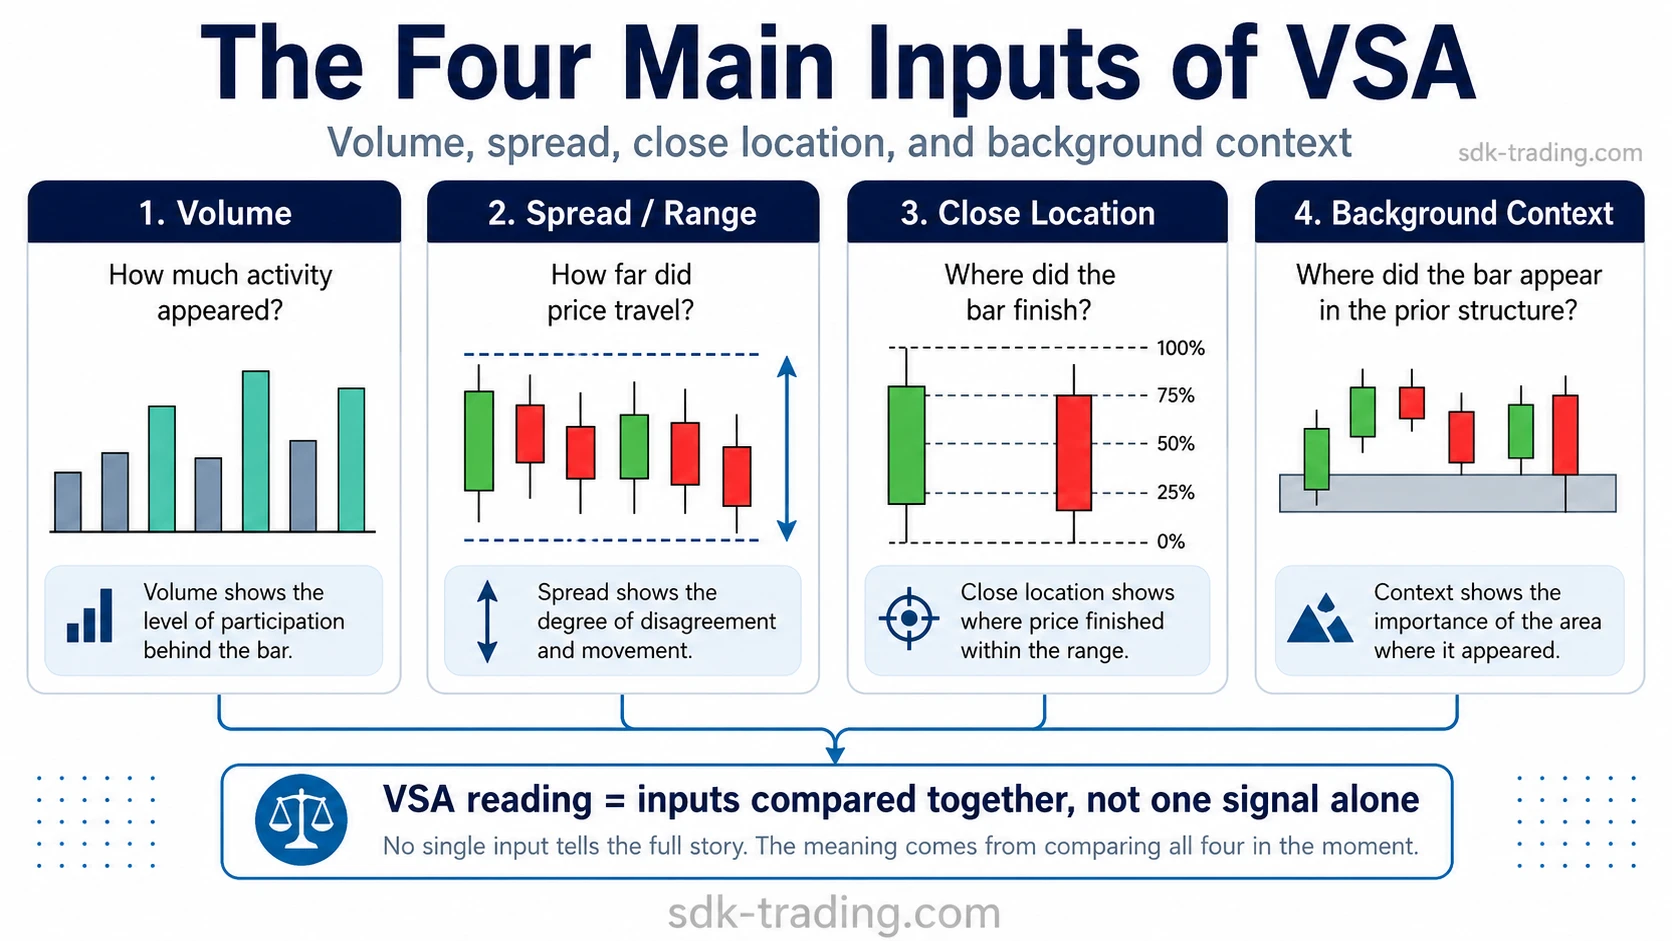
The Four Inputs of Volume Spread Analysis
VSA starts with observable chart information before interpretation. The four main inputs are volume, spread or range, close location, and background context. None of them is usually enough by itself; the reading comes from comparing them together.
| Observed input | What the trader checks | Why it matters |
|---|---|---|
| Volume | Whether activity is higher, lower, or unusual compared with recent bars | Volume shows effort, but not the full meaning of that effort |
| Spread or range | Whether price travelled widely or narrowly during the bar | The range shows the visible result of the activity |
| Close location | Whether the bar closed near the high, low, or middle of its range | The close can suggest whether pressure persisted or faded into the end of the bar |
| Background context | Whether the bar appears after an advance, decline, range, breakout, or failed move | The same bar can mean different things in different structures |
This sequence helps prevent a common mistake: treating one dramatic candle as a complete signal. VSA is strongest when each bar is read as part of a wider sequence rather than as a standalone event.
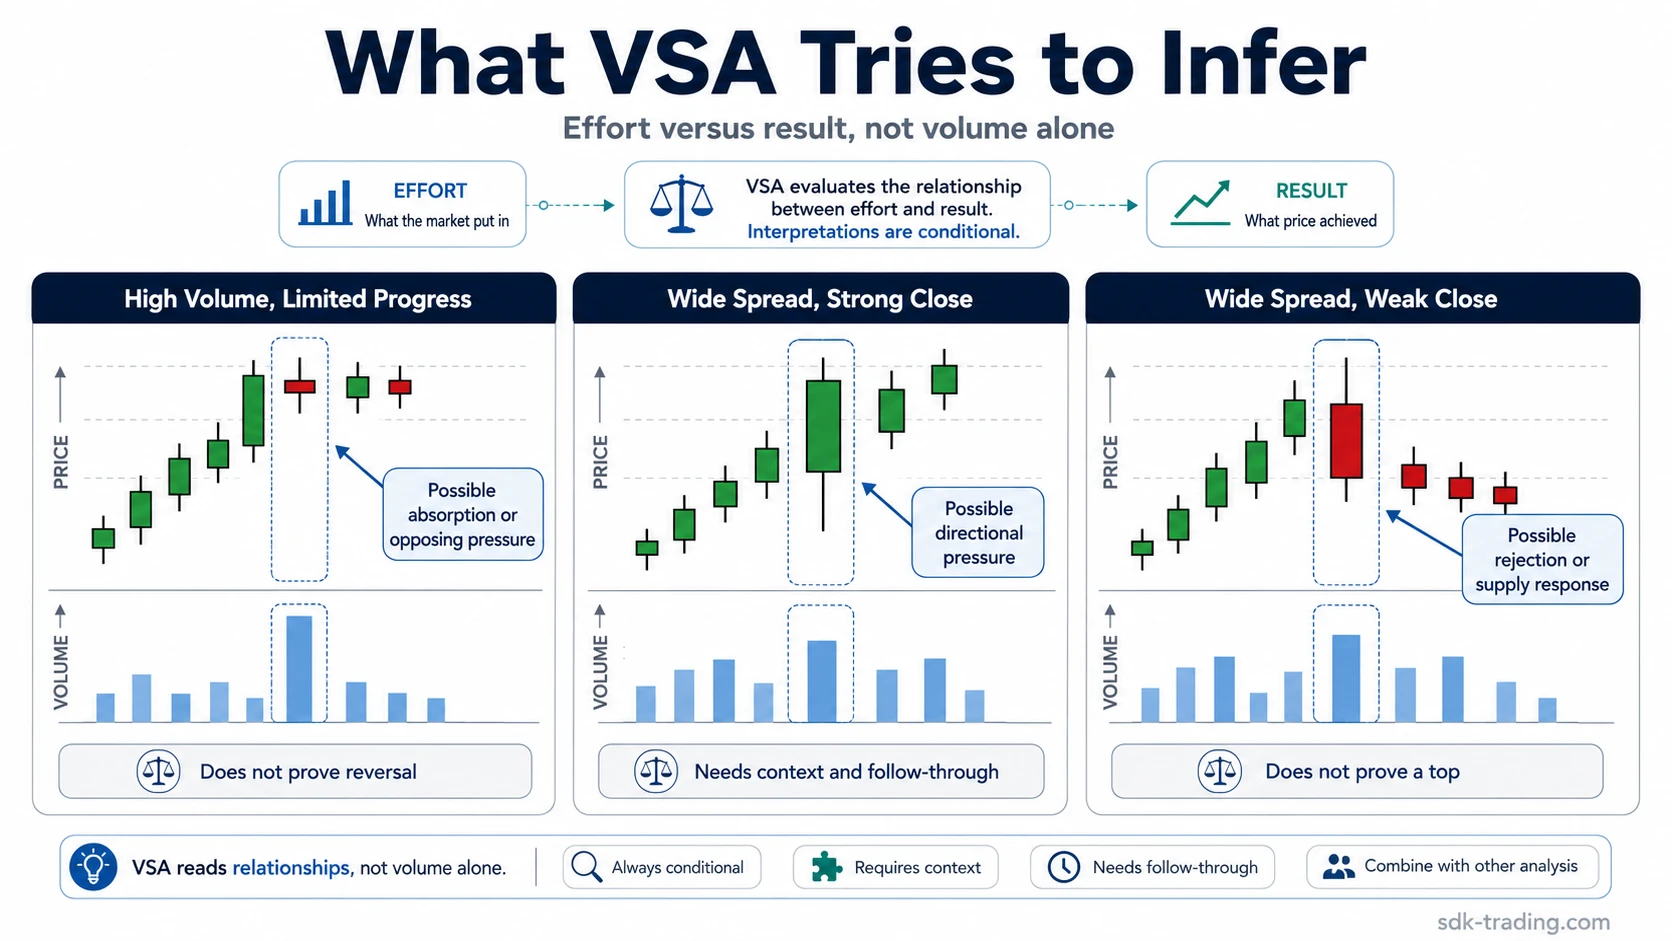
What Volume Spread Analysis Tries to Infer
VSA tries to infer the balance between effort and result. Heavy volume with limited price progress may point to absorption, resistance, or opposing pressure. Light participation during a weak advance into resistance may suggest that the move lacks support from enough buyers.
The language should stay conditional. VSA can suggest pressure, weakness, absorption, or possible imbalance. It should not be treated as confirmation that large operators are accumulating or distributing a market at a specific point.
| Observed condition | What it may suggest | What it does not prove |
|---|---|---|
| High volume with limited progress | Possible absorption, resistance, or opposing pressure | It does not prove distribution or reversal |
| Wide spread with a strong close | Possible directional pressure if context supports it | It does not prove continuation |
| Wide spread with a weak close | Possible rejection or supply entering after movement | It does not prove a top |
| Low volume during a move | Possible lack of participation or reduced interest | It does not always mean no demand or no supply |
| Volume expansion near an important area | Possible change in participation or a battle between sides | It does not identify the participants with certainty |
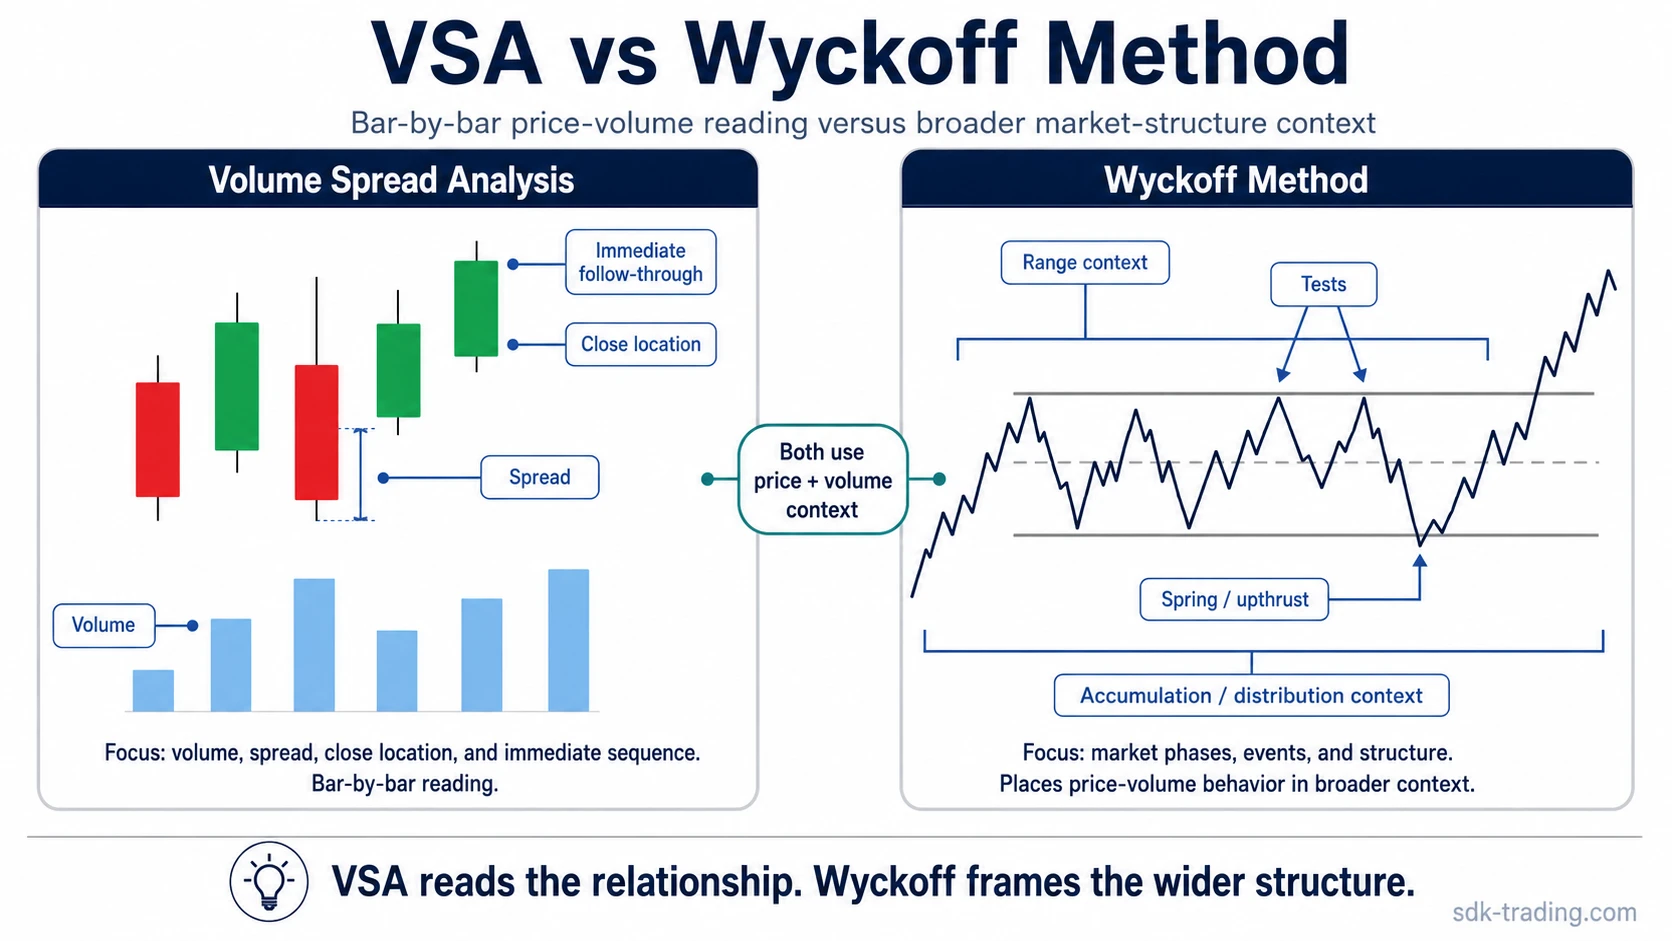
Volume Spread Analysis vs Wyckoff Method
Volume Spread Analysis is closely related to the Wyckoff Method, but the two should not be treated as identical. VSA is mainly a price-volume reading lens. Wyckoff analysis places that reading inside a broader market-structure framework.
A simple way to separate them is this: VSA studies the relationship between volume and bar behavior, while Wyckoff analysis asks where that behavior sits inside a larger process. A VSA reading may help interpret one bar or sequence. A Wyckoff framework considers the wider structure around that sequence.
That distinction keeps VSA focused on price-volume reading, while broader phase analysis, tests, springs, upthrusts, and campaign logic belong to the wider Wyckoff framework.
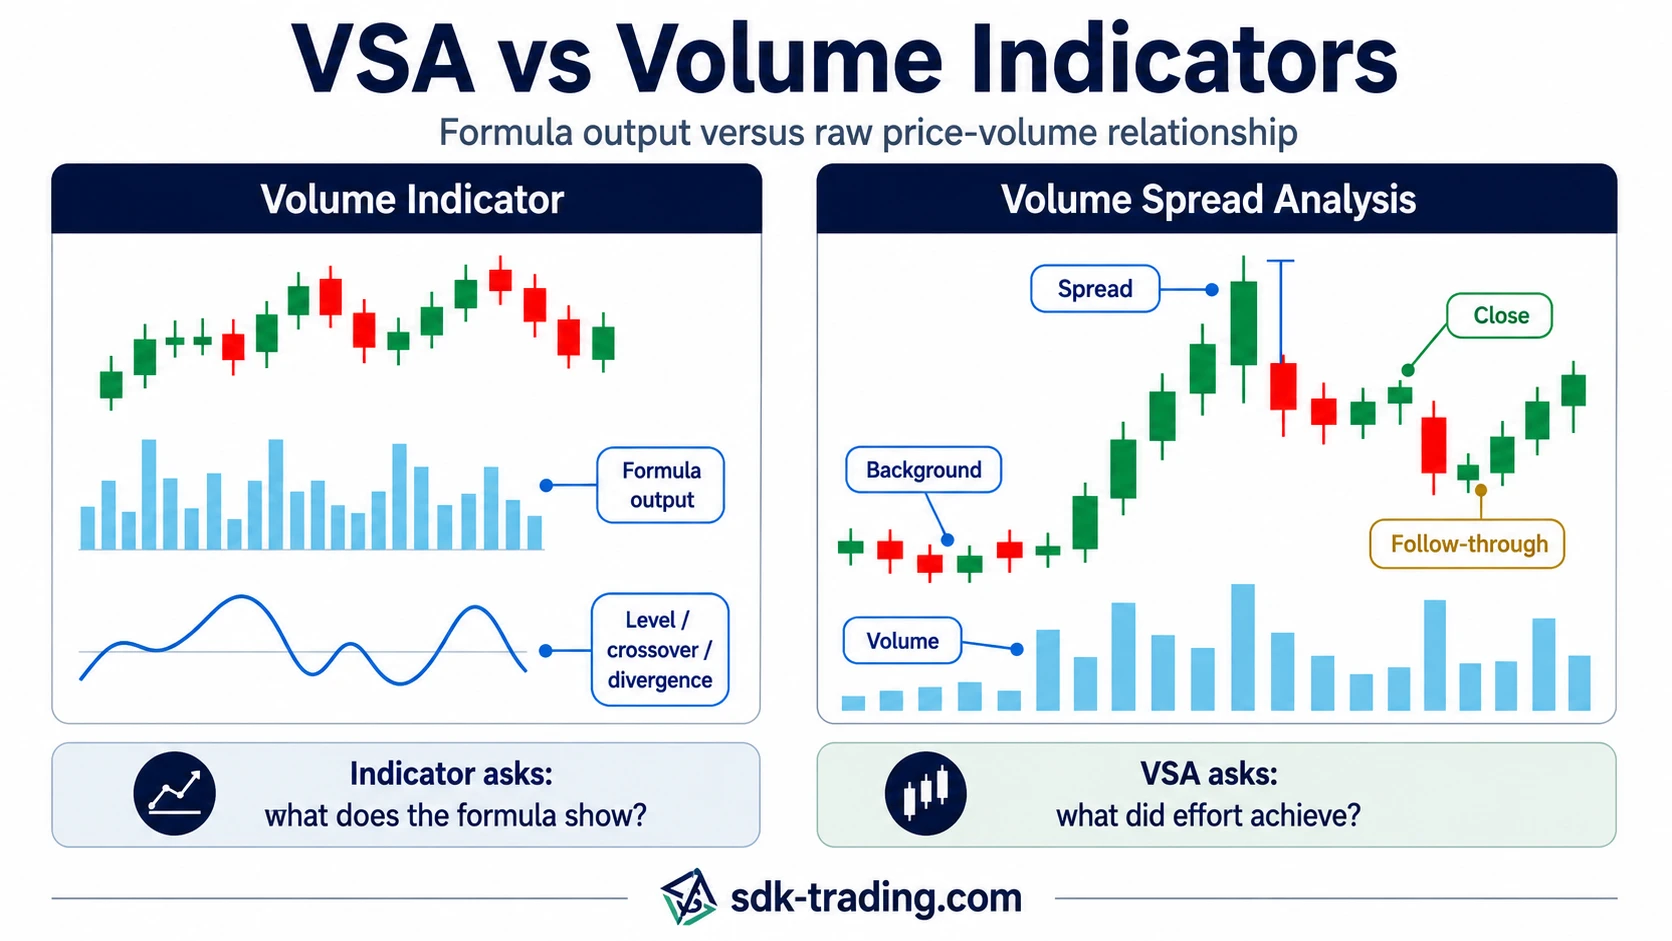
Volume Spread Analysis vs Volume Indicators
Volume Spread Analysis is different from a volume indicator because it does not rely on a single plotted formula. A volume indicator may transform volume into a line, oscillator, or cumulative value. VSA instead compares raw volume with price range, close location, background context, and follow-through.
| Question | Volume indicator | Volume Spread Analysis |
|---|---|---|
| What is measured? | A formula or transformed volume value | Volume, spread, close location, background, and follow-through |
| How is it read? | Through indicator direction, level, crossover, or divergence | Through the relationship between effort and price result |
| Main risk | Treating the indicator value as a complete signal | Treating a volume spike as proof before context agrees |
This difference matters because VSA is interpretive. It asks whether the amount of activity produced a meaningful price result. A high-volume bar, for example, may suggest strength, weakness, absorption, or exhaustion depending on where it appears and what follows.
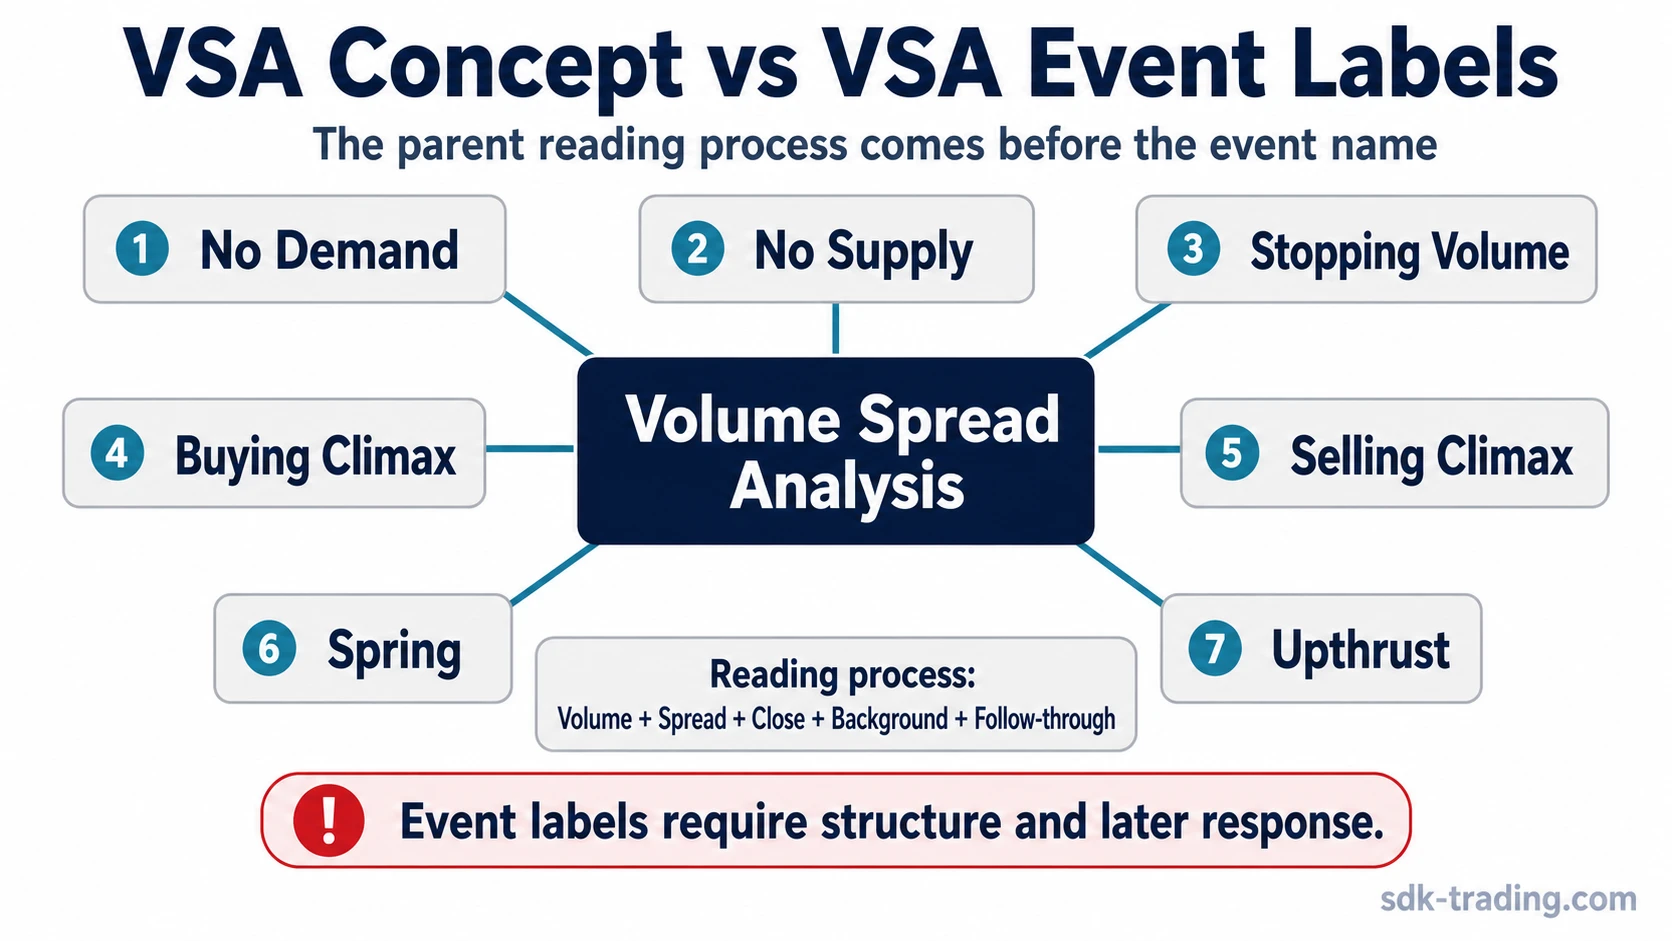
VSA as a Concept vs VSA Events
Volume Spread Analysis is the parent reading process. Event labels such as no demand, stopping volume, buying climax, selling climax, spring, upthrust, and UTAD are narrower classifications inside that process.
This distinction matters because a label is not a signal by itself. A named VSA or Wyckoff event still needs volume, spread, close location, background structure, and later response before the classification becomes useful.
Common VSA Events and Pattern Labels
Common VSA event labels describe how a specific price-volume condition may appear inside a broader reading. They are useful for classification, but they should not replace the full process of checking volume, spread, close location, background context, and follow-through.
- No Demand: an upward attempt with reduced activity and weak follow-through.
- No Supply: a downward attempt with reduced activity and limited selling pressure.
- Stopping Volume: high activity after a decline where downside progress begins to slow.
- Buying Climax: high activity after an advance where upside progress may become inefficient.
- Selling Climax: high activity after a decline where selling pressure may become extreme.
- Upthrust: a failed upward push above a prior area, often read in relation to supply and follow-through.
- Spring: a failed downside break below a prior area, often read in relation to absorption and recovery behavior.
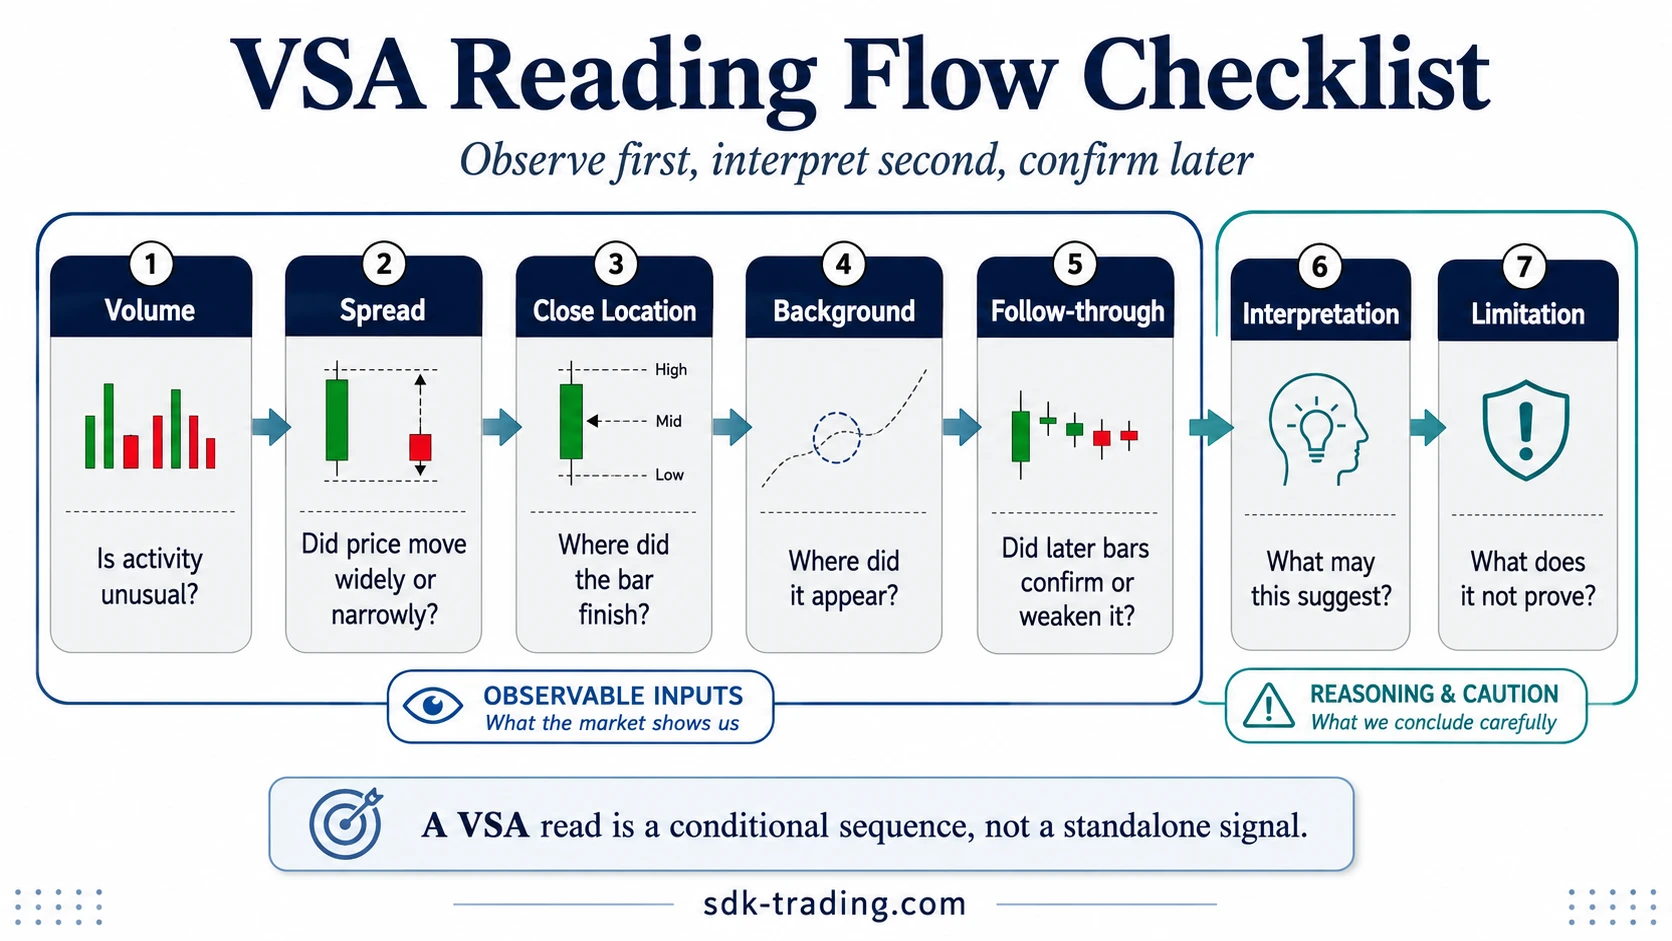
How a VSA Reading Flows
A simple VSA reading starts with observation before interpretation. The trader first checks whether volume is unusual, whether price spread expanded or narrowed, where the bar closed, where the bar appeared in the prior structure, and whether later behavior confirmed or weakened the first reading.
Basic reading sequence: Volume → Spread → Close Location → Background → Follow-through → Interpretation → Limitation
| Step | What to check | What weakens the reading |
|---|---|---|
| Volume | Is activity unusually high, low, rising, falling, or abnormal compared with recent bars? | Volume is read alone without spread or context. |
| Spread | Did price move widely, narrowly, or fail to travel despite activity? | A wide bar is treated as confirmation without follow-through. |
| Close location | Did the bar close near the high, middle, or low of its range? | The close conflicts with the assumed pressure. |
| Background | Did the event appear after an advance, decline, range, breakout, or failed move? | The same bar is interpreted without trend, range, or prior effort. |
| Follow-through | Do later bars confirm, weaken, or invalidate the implied pressure? | The next sequence immediately invalidates the reading. |
| Interpretation | What may the effort-versus-result relationship suggest? | The reading becomes too certain before later evidence appears. |
| Limitation | What does the chart not prove? | The trader treats VSA as proof of intent or a complete trading system. |
This sequence keeps the analysis grounded in what can be seen first. Interpretation comes after the observable inputs, and the limitation remains part of the reading instead of being added only after a conclusion has already been made.
Where Volume Spread Analysis Comes From
Volume Spread Analysis is commonly associated with Wyckoff-style price-volume reading and later VSA teaching traditions, especially the work popularized by Tom Williams. The shared idea is that volume should be read together with price result, not as a standalone signal.
VSA belongs to the same price-volume family as Wyckoff analysis, but it usually presents the reading through bar-by-bar comparisons of volume, spread, close location, and background context.
Simple Volume Spread Analysis Example
Consider a market that has already advanced for several sessions. A new bar appears with unusually high volume, a wide spread, and a close near the lower part of the bar. A VSA reading might treat this as possible supply pressure because the visible effort was large, but the final result was weak relative to the range.
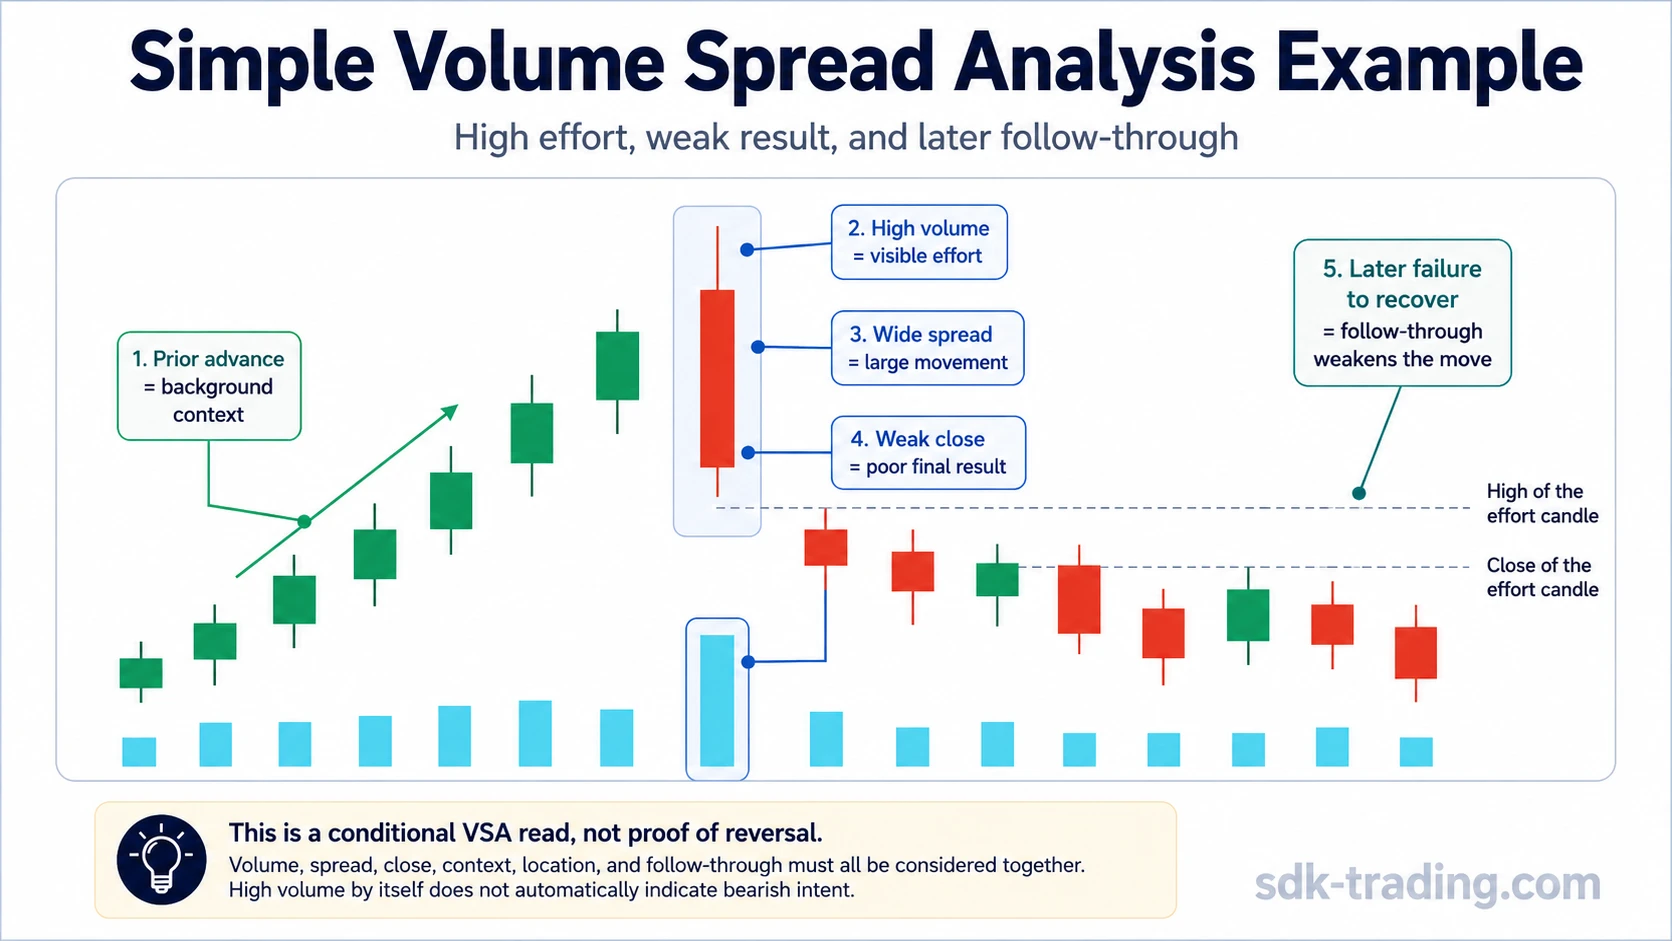
That reading remains conditional. It becomes more meaningful if the next bars fail to regain the lost ground or reject the same area again. If price quickly recovers and accepts above the area, the original interpretation weakens.
The point is not that price must reverse. The point is that effort, result, background context, and follow-through should agree before the VSA interpretation becomes more credible.
Common Mistakes and Limitations
Core limitation: VSA is an interpretation framework. It can help organize what the chart shows, but it cannot prove intent, identify all participants, or remove uncertainty from the trade decision.
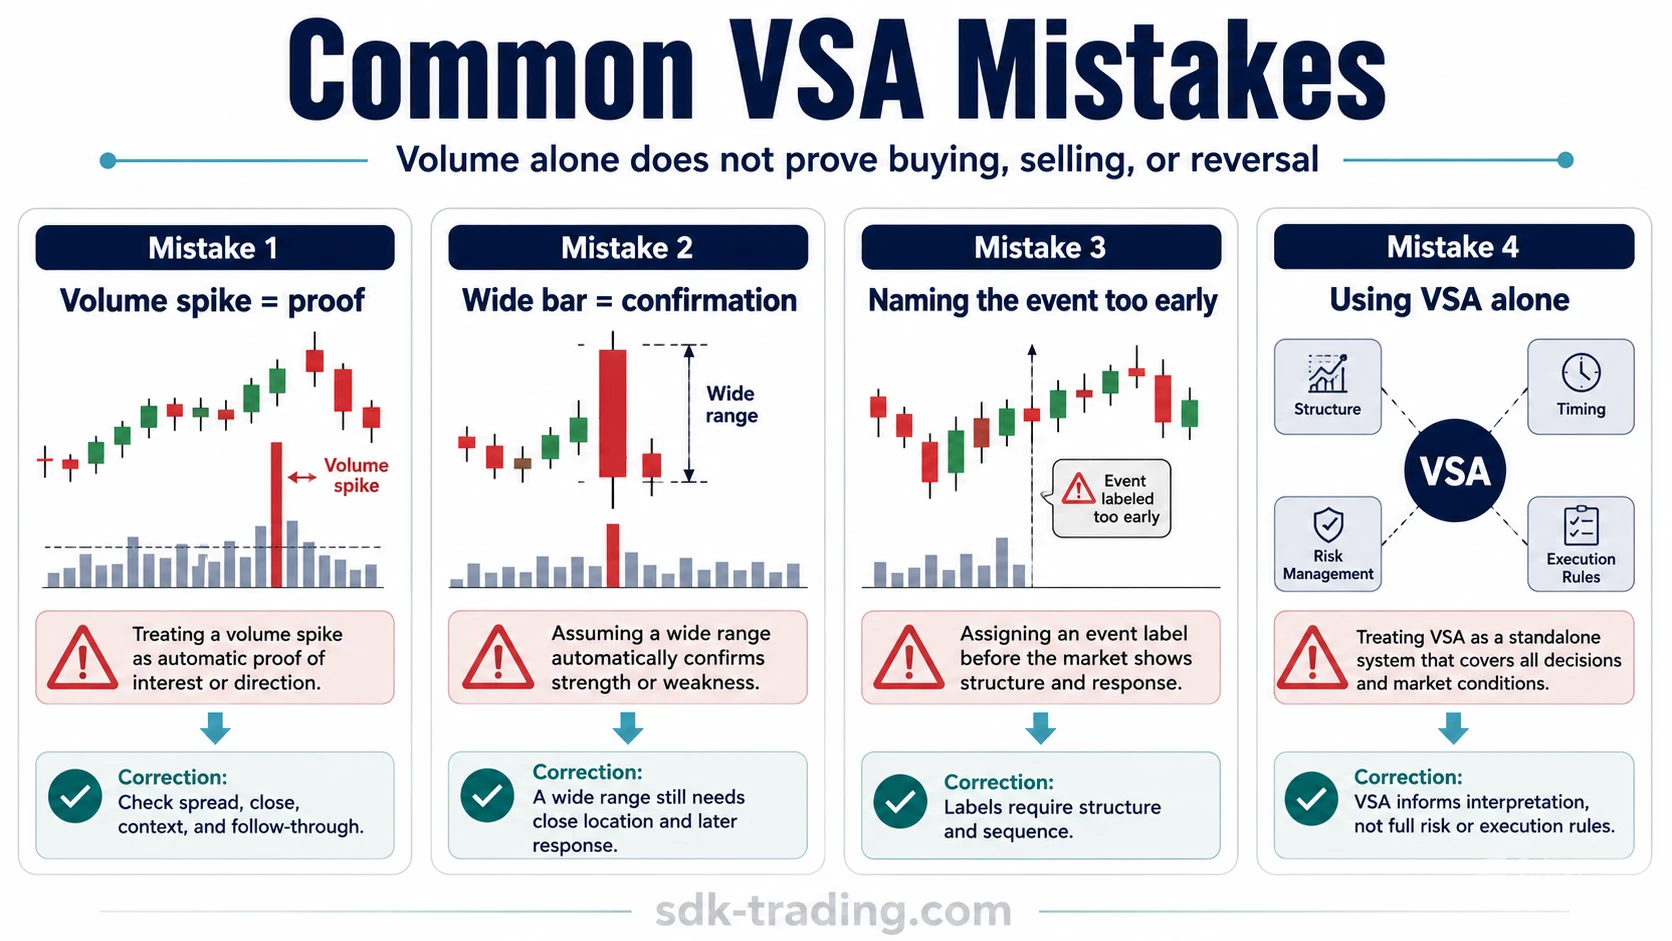
| Mistake | Why it is a problem | Cleaner VSA reading |
|---|---|---|
| Treating a volume spike as proof | A volume spike can reflect aggressive buying, aggressive selling, absorption, liquidation, news reaction, or mechanical flow. | Check spread, close location, background context, and follow-through before assigning meaning. |
| Treating a wide bar as confirmation | A wide spread shows movement, not certainty. A wide bar that immediately fails can mean something different from one that holds its range. | Read the close location and the next bars before assuming strength or weakness. |
| Naming an event too early | Labels such as stopping volume or buying climax can create premature certainty when the sequence is not complete. | Observe the bar, compare it with the background, then wait for confirming or conflicting evidence. |
| Using VSA as a standalone trading system | VSA does not define position size, invalidation, reward-to-risk, or execution rules by itself. | Use VSA as an interpretation layer inside a broader risk-aware trading process. |
FAQ
What does Volume Spread Analysis mean?
Volume Spread Analysis means reading volume, price range, close location, and context together to interpret possible supply and demand pressure.
What is VSA in trading?
VSA in trading stands for Volume Spread Analysis. It is a method of interpreting the relationship between volume, price spread, close location, and market background rather than using volume as a standalone signal.
Is Volume Spread Analysis the same as VSA?
Yes. VSA is the common abbreviation for Volume Spread Analysis.
Does Volume Spread Analysis work?
Volume Spread Analysis can help traders organize price and volume information, but it does not work as a standalone prediction system. Its usefulness depends on context, follow-through, risk management, and avoiding isolated signal reading.
What are the basics of Volume Spread Analysis?
The basics of Volume Spread Analysis are volume, spread or candle range, close location, background context, and follow-through. A reading becomes stronger when effort, result, and later behavior agree.
Is high volume always bullish?
No. High volume can appear during buying, selling, absorption, liquidation, or a battle between sides. The meaning depends on spread, close location, and background context.