A selling climax is a Wyckoff and VSA event that appears after a sustained decline when selling activity reaches exceptional intensity, usually with expanded spread and very high volume. The key boundary is simple: a large down bar or volume spike by itself is only heavy activity. The selling-climax classification becomes more credible when that extreme effort is followed by evidence that supply is becoming less effective.
Definition: A selling climax is a climactic burst of selling after an established decline in which speculative supply reaches unusually high intensity. Spread and volume often expand sharply, and the bar may close well off its low as demand absorbs part of the selling. The following automatic rally and secondary test help show whether the event actually interrupted the decline.
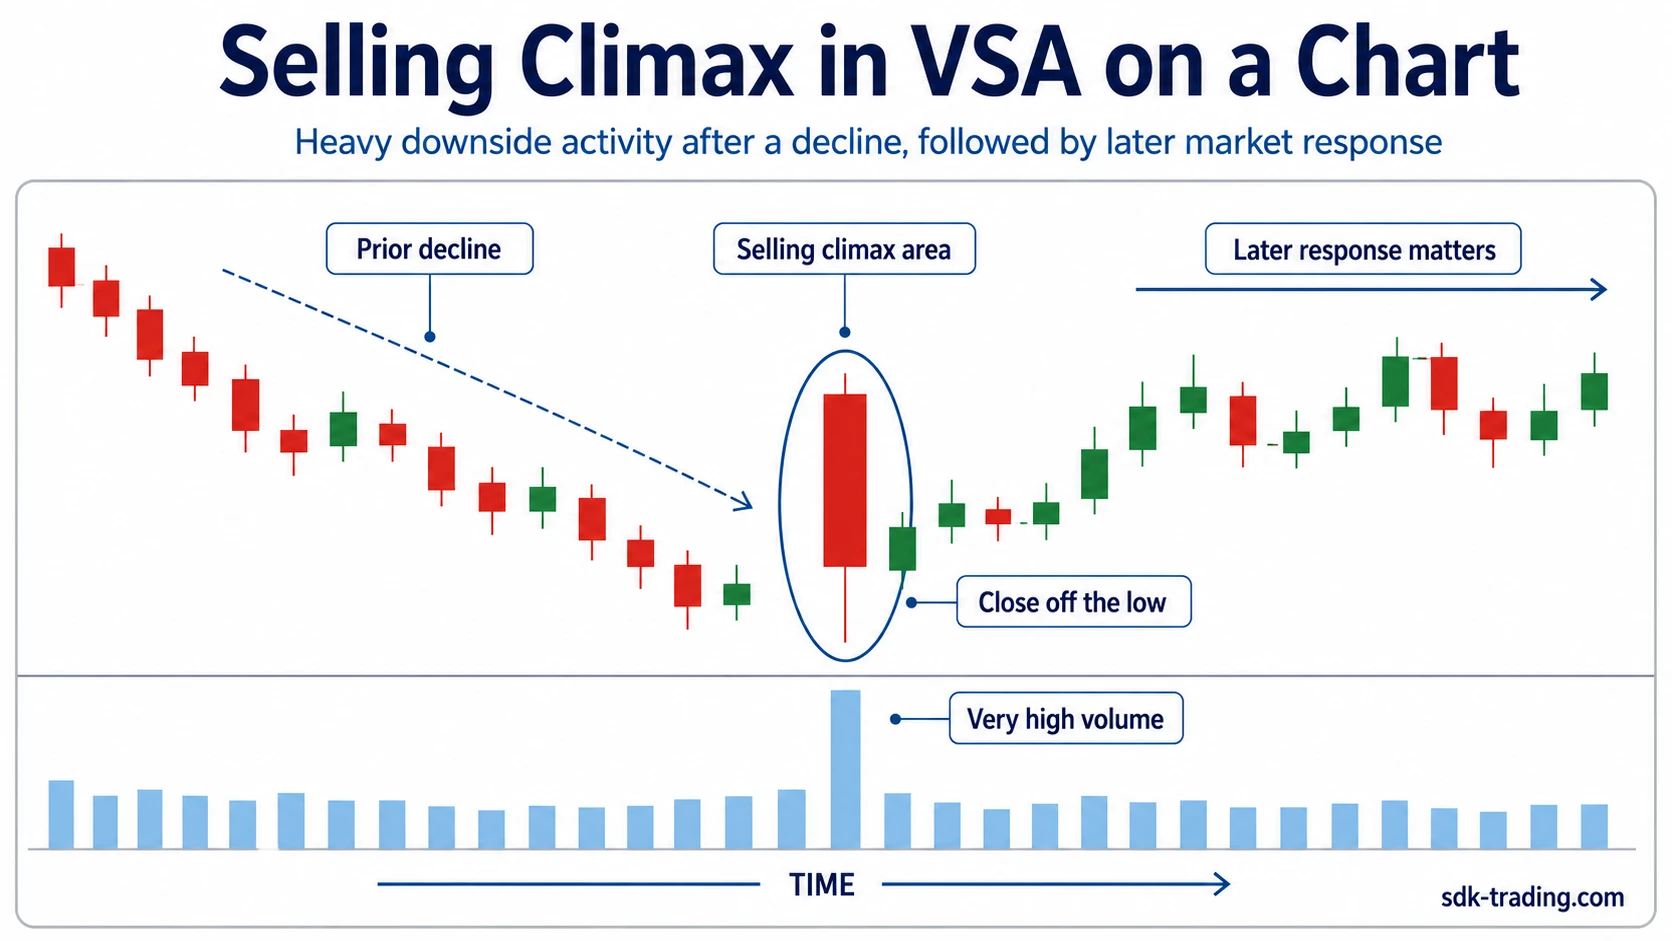
What Is a Selling Climax?
In Volume Spread Analysis, a selling climax is associated with unusually intense downside activity after a decline. Volume may rise dramatically, the downside spread may widen, and the close may move away from the low as opposing demand absorbs part of the available supply.
The prior decline is essential. Exceptional volume in the middle of an established range or during an ordinary pullback is not enough to create the same classification. A selling climax belongs near the point where a developed markdown is approaching an extreme in selling pressure.
The useful question is whether the large amount of selling effort still produces proportional downside result. If extraordinary activity produces only limited additional downside progress and the market then reacts upward, the event has the effort-versus-result characteristics expected near a selling climax.
What a Selling Climax Is Not
| Observed event | Why it is insufficient |
|---|---|
| A volume spike anywhere on the chart | The event needs an established decline and climactic selling context. |
| One unusually wide down bar | Spread shows large movement, but the relationship between effort, result, and the following response still matters. |
| A close above the low | Buying may have entered during the bar, but the close alone cannot classify the larger event. |
| The absolute low of an accumulation structure | A later secondary test or spring can revisit or move below the selling-climax area. |
How Volume, Spread, and Close Location Work Together
Volume describes the amount of market activity. Spread describes the distance between the bar’s high and low. Close location shows how much of the downside movement remained intact by the end of the bar.
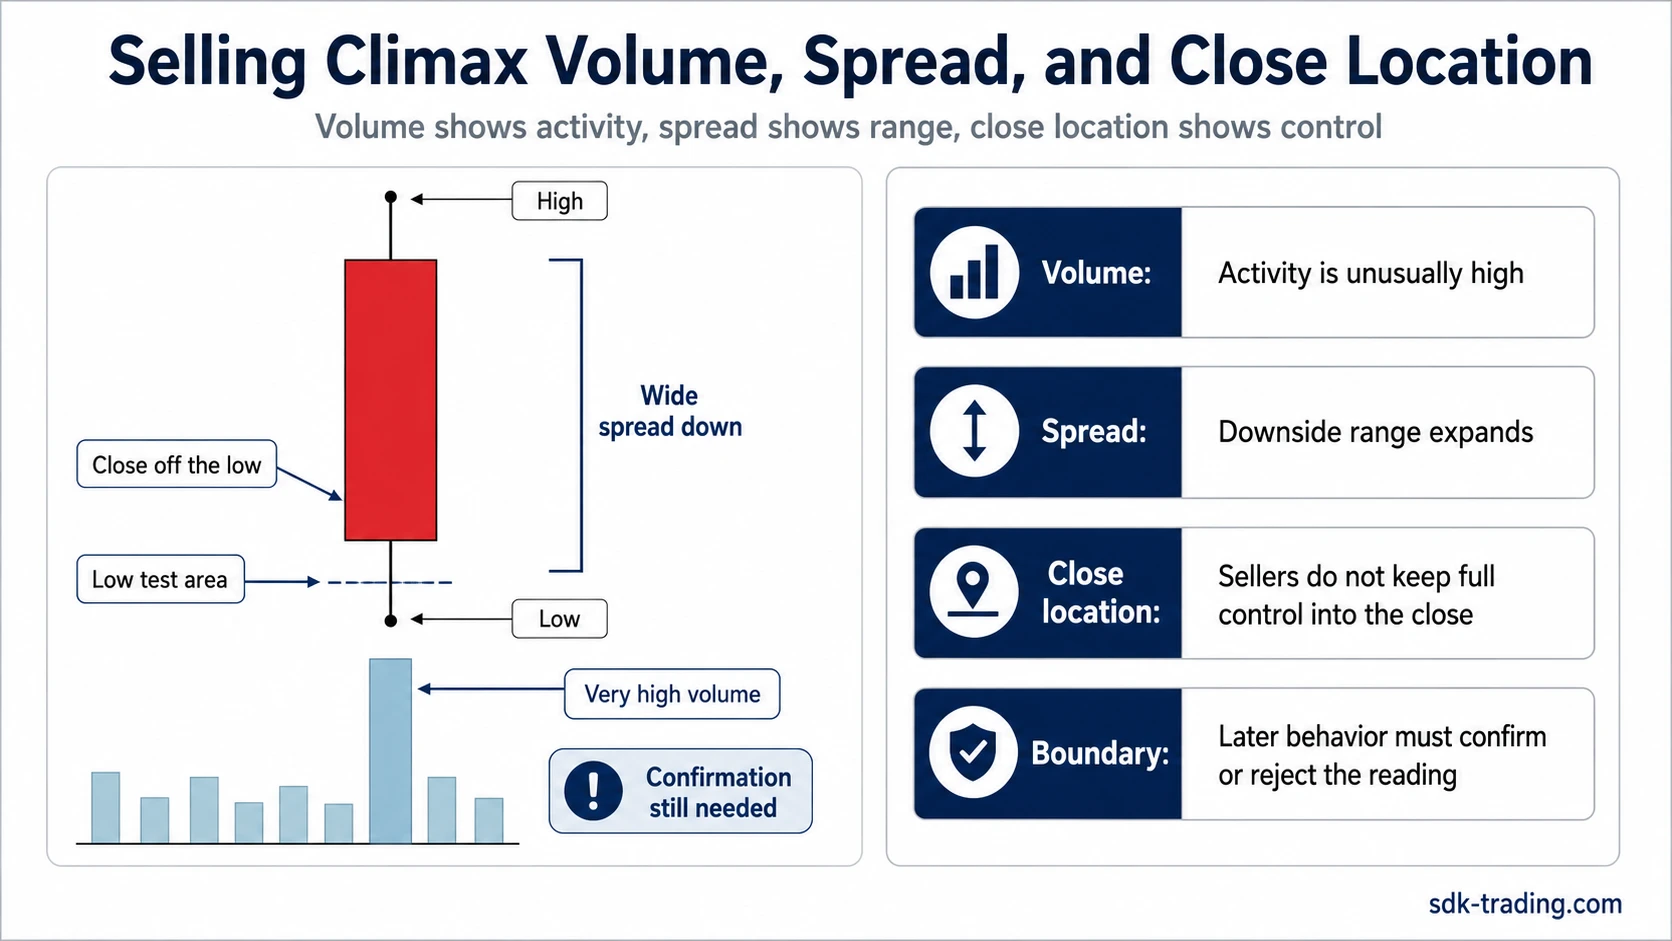
| Observation | What it contributes to the reading |
|---|---|
| Very high or exceptional volume after a prolonged decline | Shows that selling activity has reached an unusual level. |
| Wide downside spread | Shows urgency and strong price movement during the climactic event. |
| Close well above the low | Can show that demand absorbed enough supply to recover part of the bar’s decline. |
| Large effort followed by less additional downside progress | Creates the effort-versus-result mismatch that makes the climax interpretation more significant. |
Selling Climax in Wyckoff and VSA Context
In the Wyckoff method, the selling climax commonly appears during Phase A of a potential accumulation structure. The first strong reaction away from the climax area is the automatic rally. A later secondary test then revisits the area and provides additional information about how much supply remains.
A secondary test that shows less selling pressure, narrower downside spread, or reduced volume relative to the climax is different from a renewed breakdown that continues making easy new lows. The former is more consistent with supply being reduced. The latter suggests that the initial high-volume event did not stop the markdown.
In VSA, the same sequence can be examined through effort versus result. Exceptional selling effort followed by progressively poorer downside result suggests that supply is becoming less effective.
Selling climax should also remain separate from broader volume climax patterns. It is specifically a downside climactic event after an established decline.
Automatic Rally, Secondary Test, and Failure
The first reaction after a selling climax is important because intense selling pressure has temporarily diminished. If price can rally away from the low area, that response helps establish that the climax changed the immediate supply-demand balance.
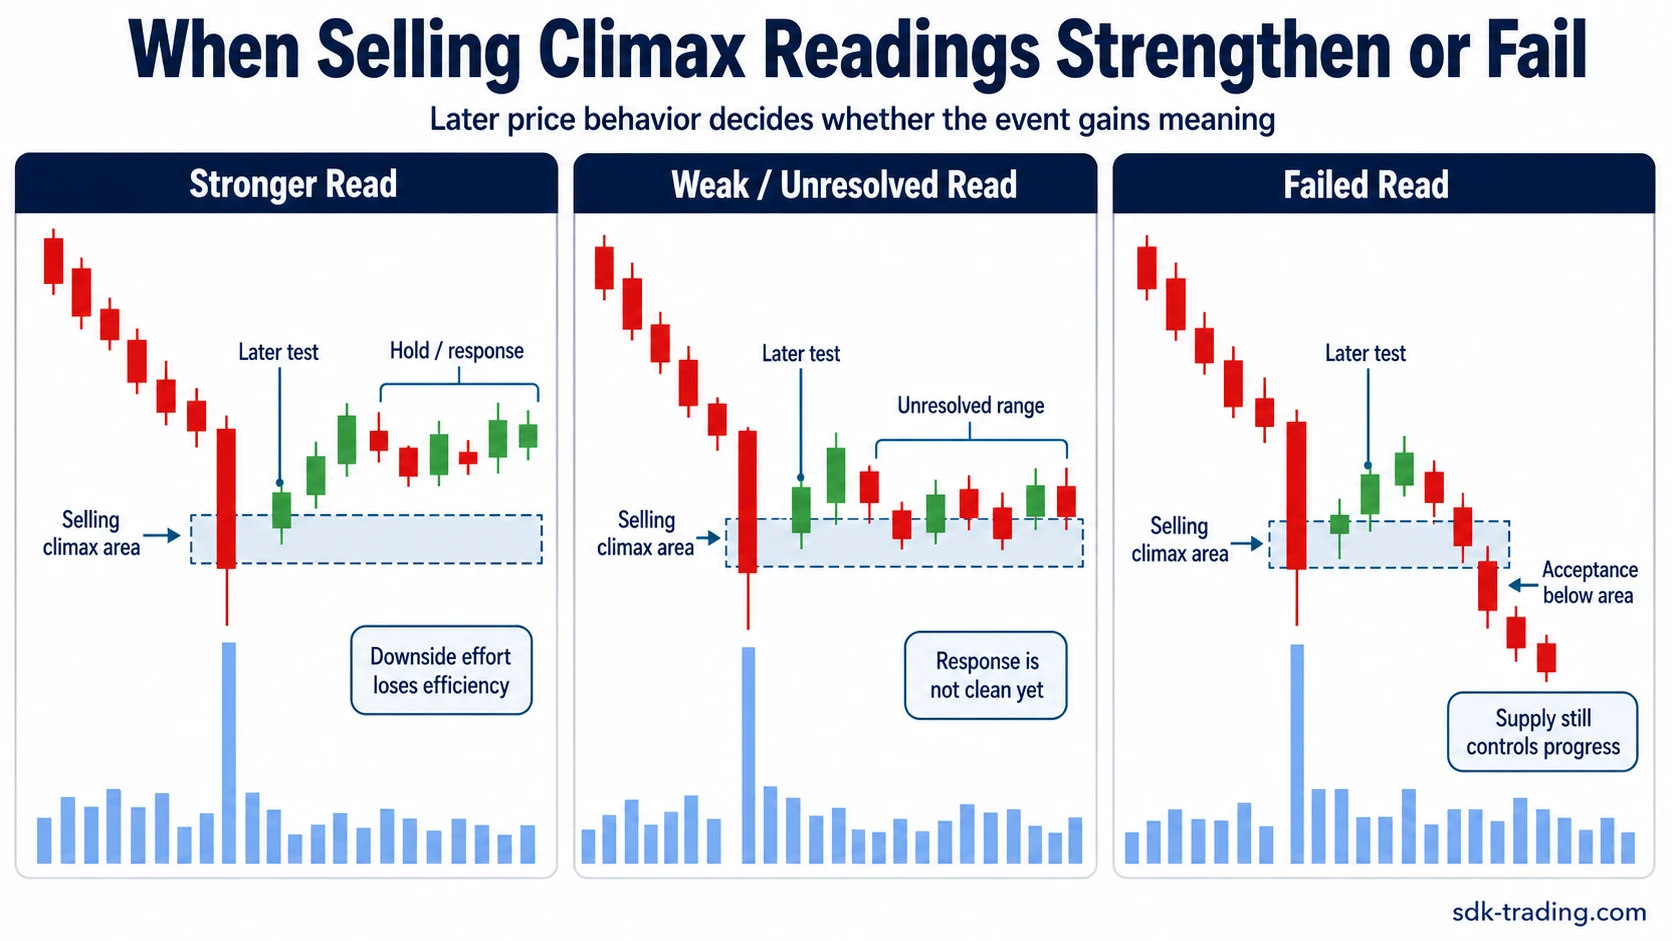
The secondary test then asks a different question: how much supply appears when price returns toward the climax area? A test with less downside spread, less volume, or less ability to extend lower is more consistent with reduced selling pressure.
The selling-climax interpretation weakens when renewed declines remain broad and efficient, volume stays elevated, and price continues through the climax area without showing a meaningful reduction in supply.
Selling Climax Example in Context
Suppose a market has been falling for several sessions and then prints its widest downside bar of the move on exceptional volume. The bar reaches a new low but closes well above that low.
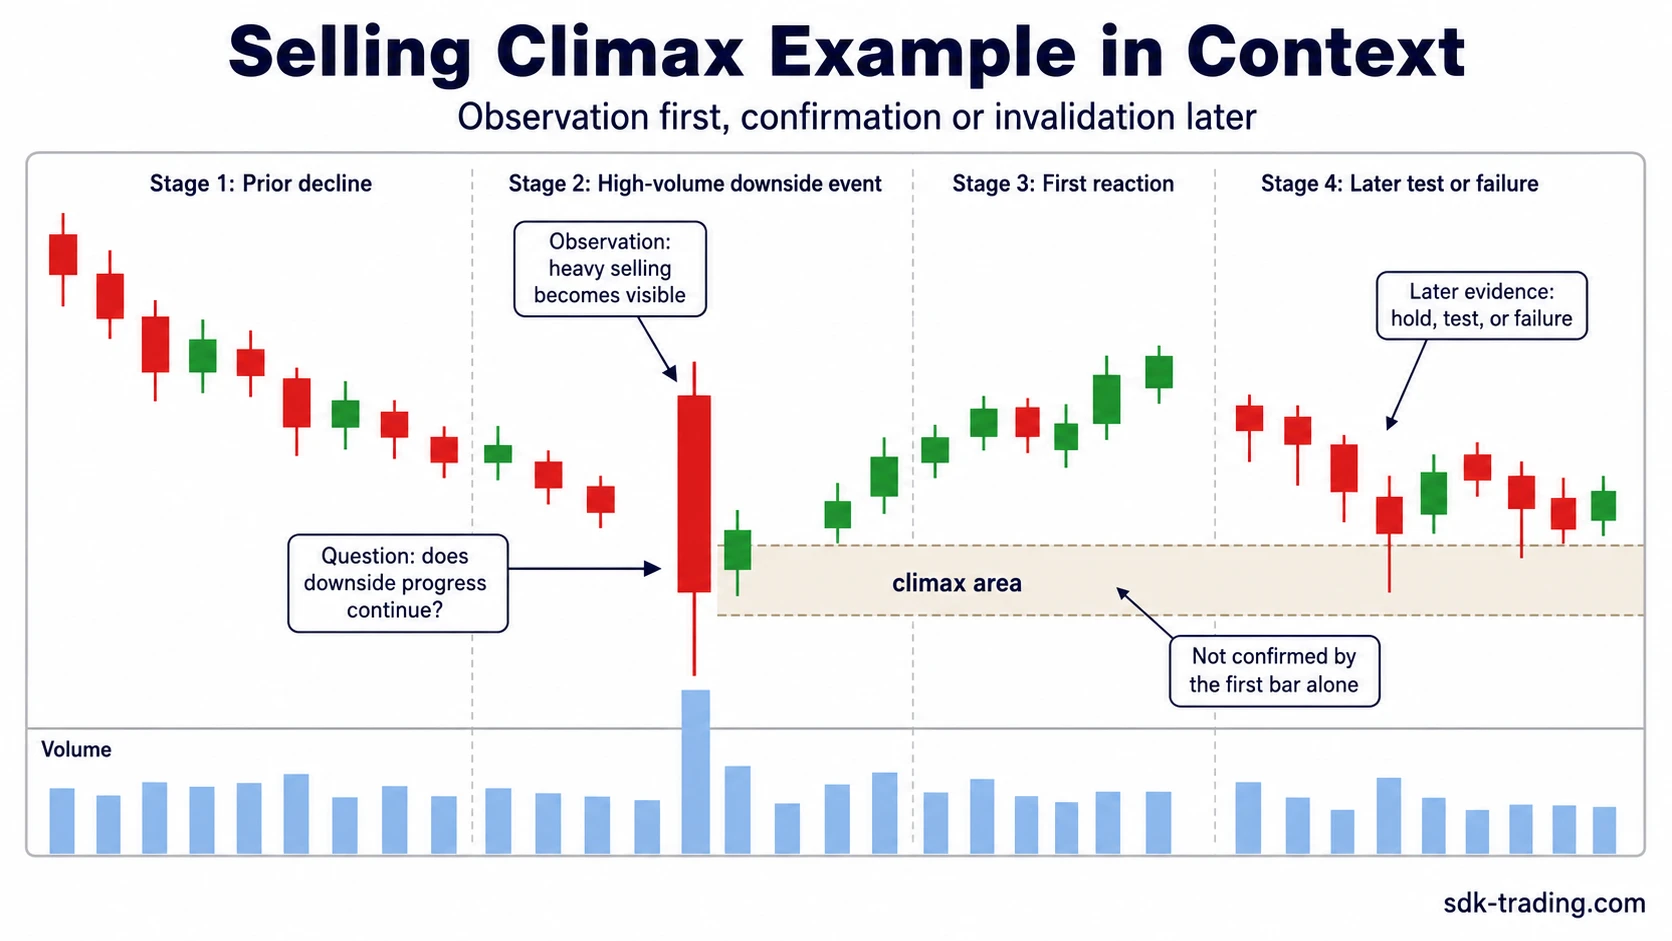
The first bar establishes exceptional selling activity. An automatic rally away from the low then shows that downside pressure has been interrupted. If a later test approaches the area with narrower spread and lower volume, the sequence provides more evidence that supply has diminished.
If instead price returns with another wide decline on strong volume and continues easily through the prior low, the earlier event was climactic activity without a successful stopping process.
Selling Climax vs Buying Climax
A selling climax and a buying climax both describe climactic activity, but they develop on opposite sides of a market move. Selling climax follows a developed decline. Buying climax follows a developed advance.
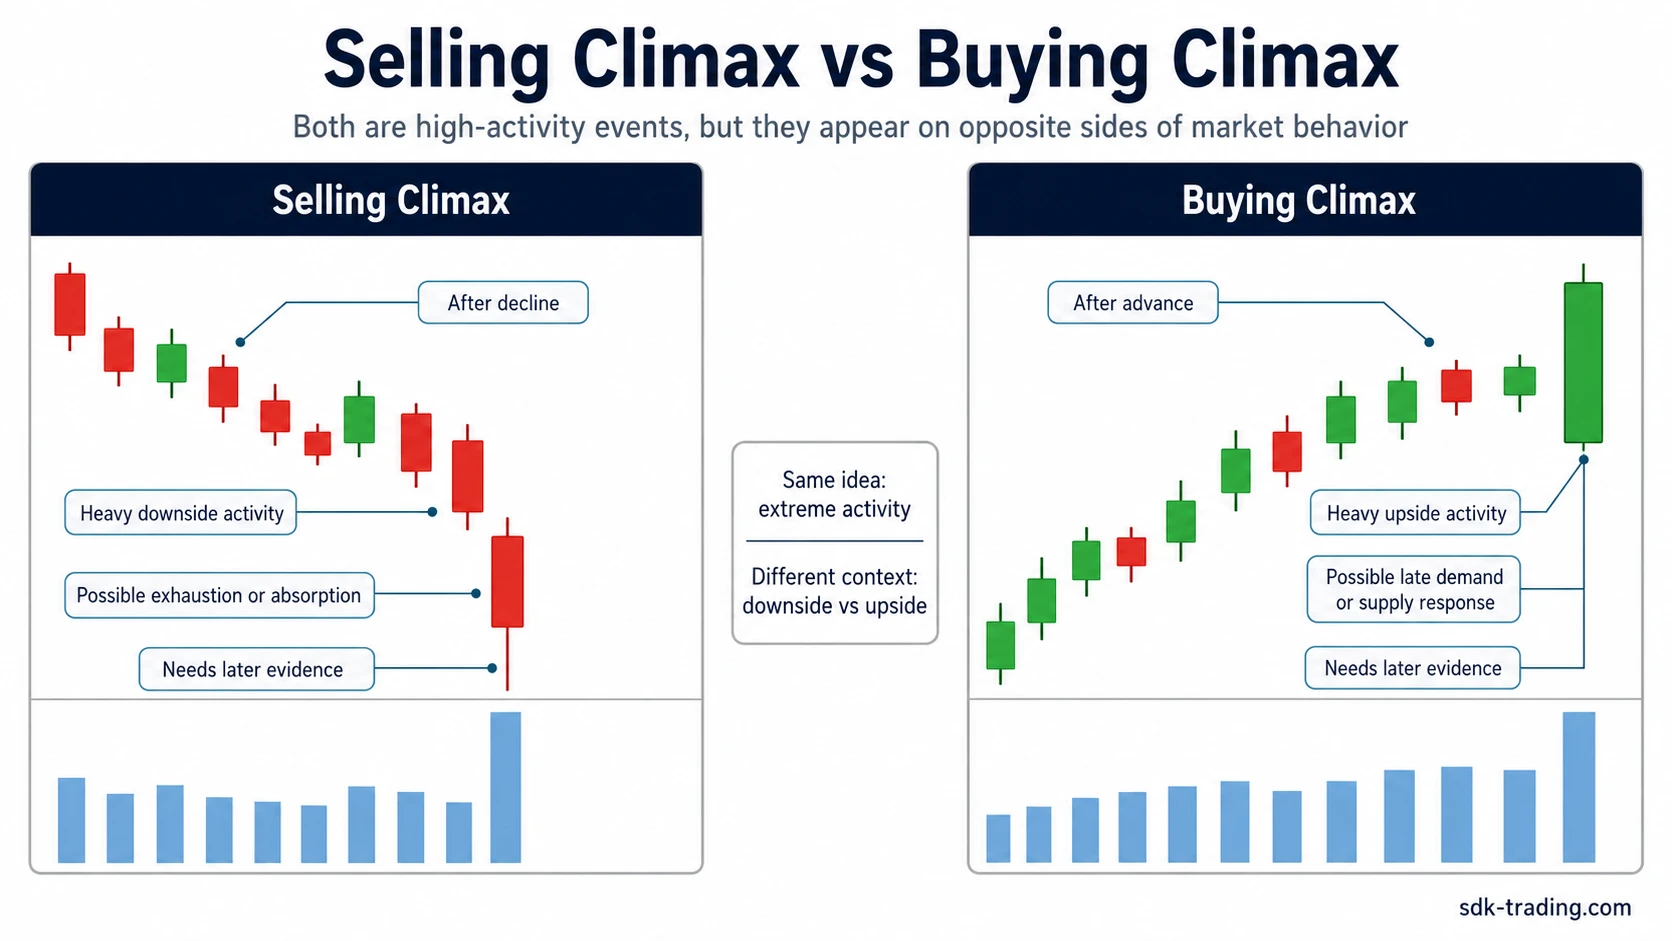
| Concept | Prior move | Climactic activity | What the next sequence tests |
|---|---|---|---|
| Selling climax | Sustained decline | Exceptional selling pressure | Whether remaining supply can continue the markdown |
| Buying climax | Sustained advance | Exceptional buying pressure | Whether remaining demand can continue the markup |
Selling Climax vs Stopping Volume
Selling climax describes the culmination of intense selling after a developed decline. Stopping volume focuses more directly on the relationship between heavy activity and the inability of price to continue lower efficiently.
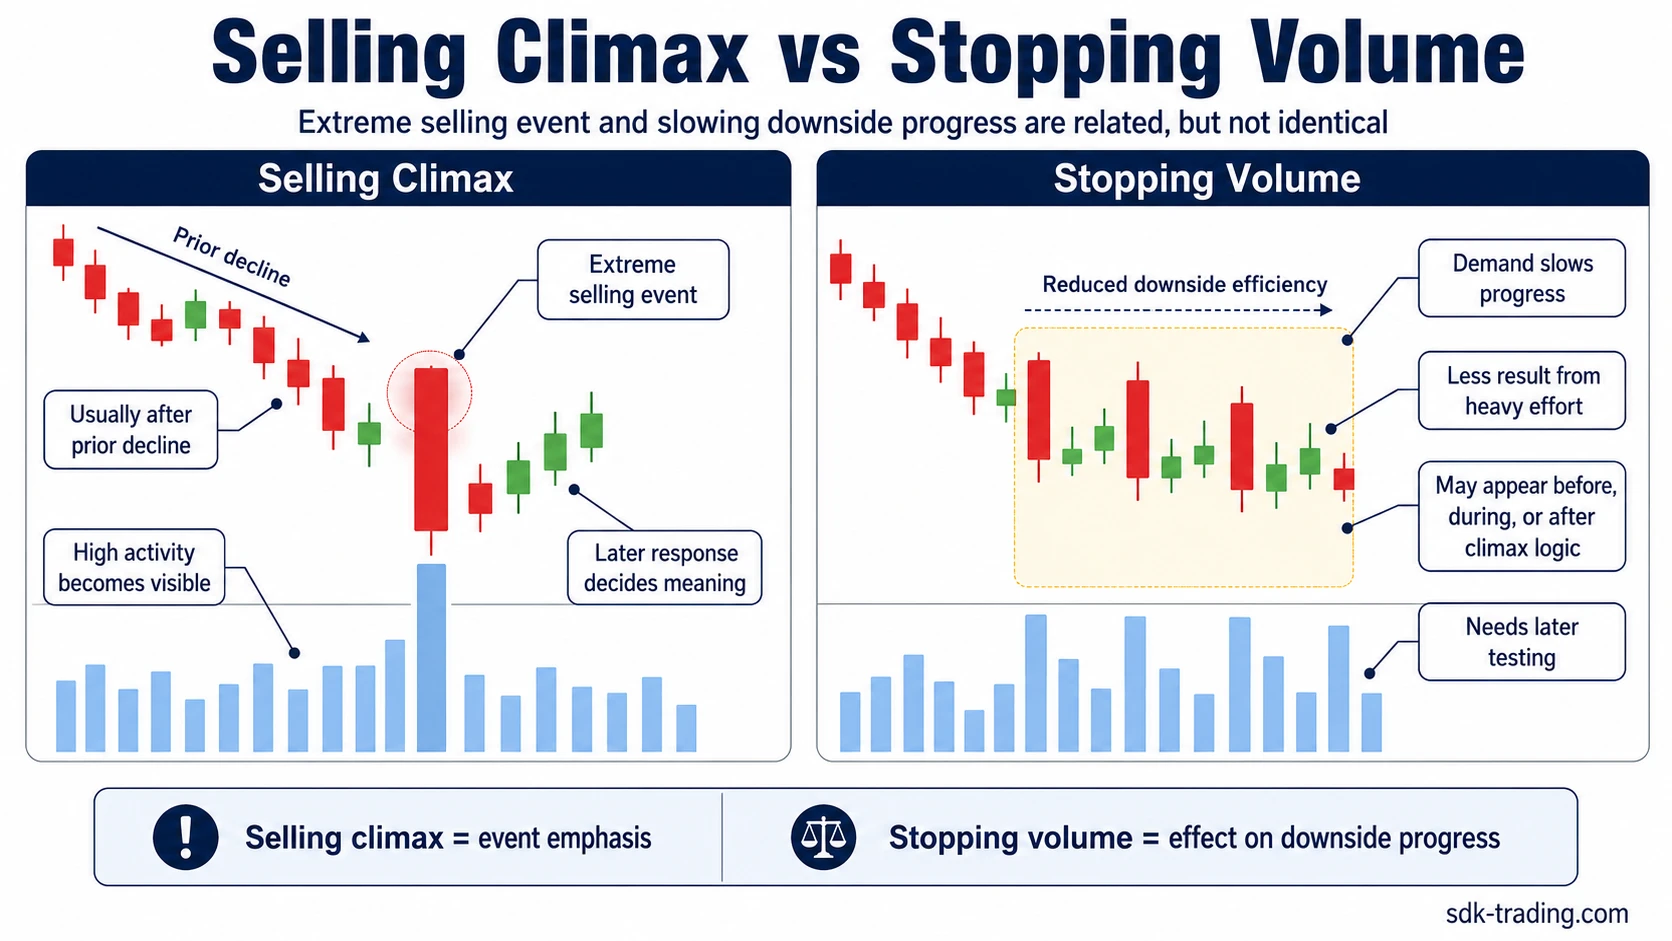
The concepts can overlap because both may involve high volume during a decline. The distinction comes from what is being named. Selling climax describes the climactic selling event. Stopping volume describes evidence that heavy selling is failing to produce the expected downside result.
Common Selling Climax Mistakes
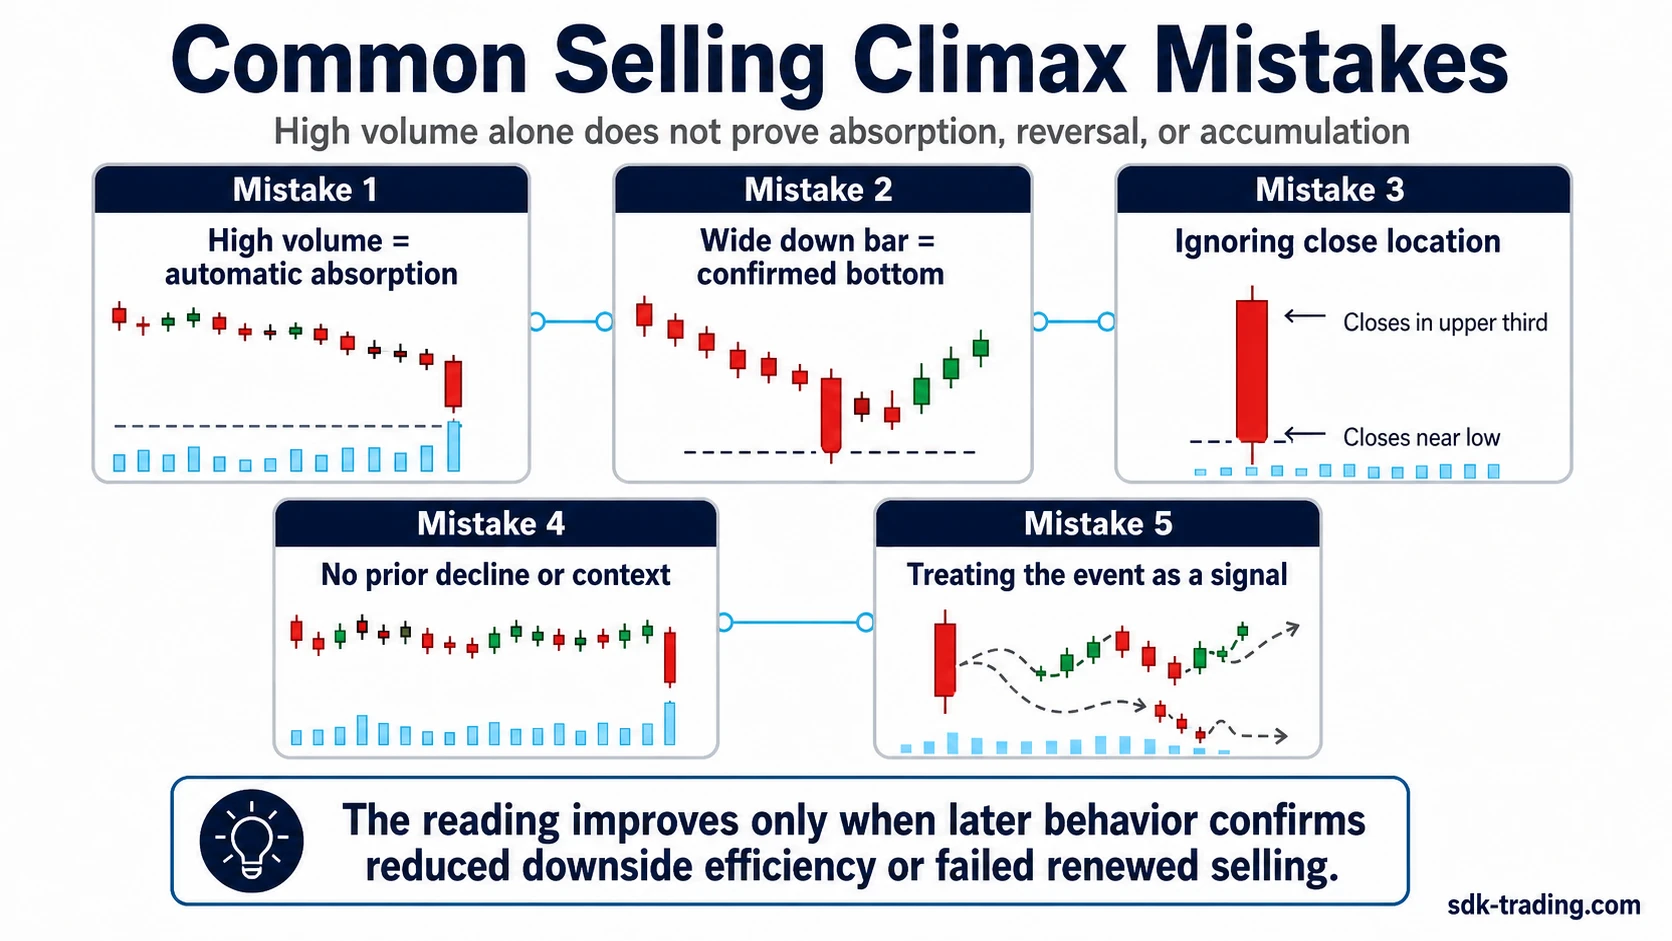
- Calling any high-volume decline a selling climax without an established prior downtrend.
- Using volume alone while ignoring spread and close location.
- Assuming the selling-climax low must remain the absolute low of the later structure.
- Ignoring the automatic rally and secondary test when judging whether supply has diminished.
- Confusing a climactic selling event with a complete accumulation structure.