The stochastic oscillator is a bounded momentum oscillator that compares the latest closing price with the high-low range over a chosen lookback period. Its two main lines, %K and %D, turn that close-position relationship into a 0-100 reading. Overbought, oversold, and line-cross readings are context-dependent observations, not complete conclusions about what price must do next.
Key Points
- The stochastic oscillator measures where the latest close sits inside a recent high-low range.
- %K is the raw close-position reading; %D is a smoothed version of %K.
- The oscillator is bounded between 0 and 100, with 80 and 20 often used as reference thresholds.
- A threshold touch is a state, not an automatic reversal reading.
- Stochastic readings are easier to interpret when oscillator behavior, price behavior, and market context align.
What Is the Stochastic Oscillator?
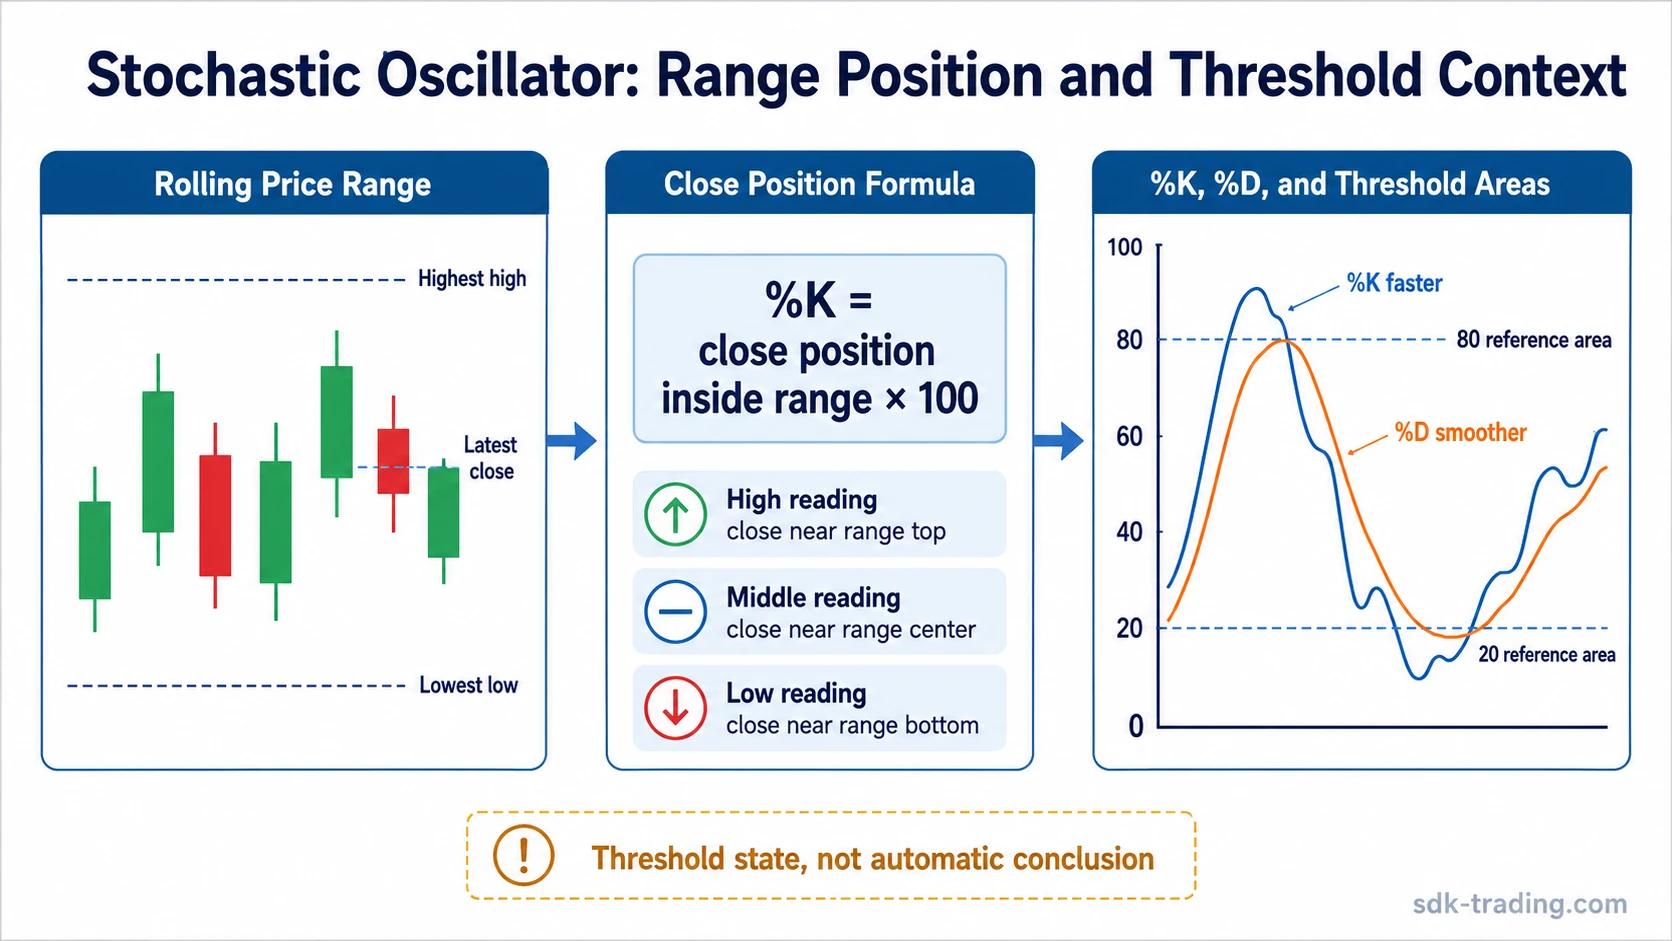
The stochastic oscillator is a technical indicator that measures the position of the latest close relative to the highest high and lowest low over a lookback period. It is usually plotted as a 0-100 oscillator below a price chart.
The important boundary is that the stochastic oscillator does not measure price distance from a prior close in the same way as a percentage momentum indicator. It measures close location inside a rolling range. A close near the top of that range produces a high reading, while a close near the bottom produces a low reading.
This makes the indicator useful for reading whether price is closing near the upper or lower part of its recent range. It does not, by itself, prove accumulation, distribution, reversal, continuation, or trade quality.
How the Stochastic Oscillator Works
The oscillator starts with a lookback window, commonly 14 periods. Within that window, the calculation identifies the highest high, the lowest low, and the latest close. The latest close is then compared with that range to estimate where price finished relative to recent extremes.
A reading near 100 means the close is near the top of the lookback range. A reading near 0 means the close is near the bottom of the lookback range. A middle reading means the close is closer to the center of the range.
The diagnostic value comes from comparing that oscillator state with price behavior. A high stochastic reading during a range-edge rejection has a different meaning from a high reading during a strong trend where price keeps closing near new highs.
Stochastic Oscillator Formula: %K and %D
The standard stochastic oscillator uses %K as the main close-position line and %D as a smoothed version of %K. The formula can vary slightly by platform settings, but the common structure is:
| Component | Formula or meaning | Interpretation role |
|---|---|---|
| %K | ((Current Close – Lowest Low) / (Highest High – Lowest Low)) x 100 | Raw close-position reading inside the lookback range. |
| %D | Moving average of %K | Smoothing line that reduces some of the raw %K noise. |
| Lookback range | Highest high and lowest low over the selected period | Defines the range used to judge close position. |
%K reacts faster because it tracks the current close-position reading directly. %D moves more slowly because it smooths %K. A cross between the two lines can mark a change in oscillator behavior, but a cross between them does not resolve the chart condition on its own.
How to Read Overbought and Oversold Stochastic Readings
Many charting platforms use 80 as an overbought reference area and 20 as an oversold reference area. These levels are common thresholds, not universal market rules.
| Reading | Basic meaning | Required context |
|---|---|---|
| Above 80 | The close is near the upper part of the recent high-low range. | Check whether price is rejecting the range edge or continuing to accept higher prices. |
| Below 20 | The close is near the lower part of the recent high-low range. | Check whether price is rejecting the lower area or continuing to accept lower prices. |
| %K / %D cross | The faster line has crossed the smoothed line. | The cross is easier to interpret when price behavior also shows a change in acceptance or rejection. |
A stochastic reading becomes more useful when oscillator state, price behavior, and market context point in the same direction. A threshold touch without supportive price behavior is only a weak reading.
Clean, Weak, and False-Positive Stochastic Readings
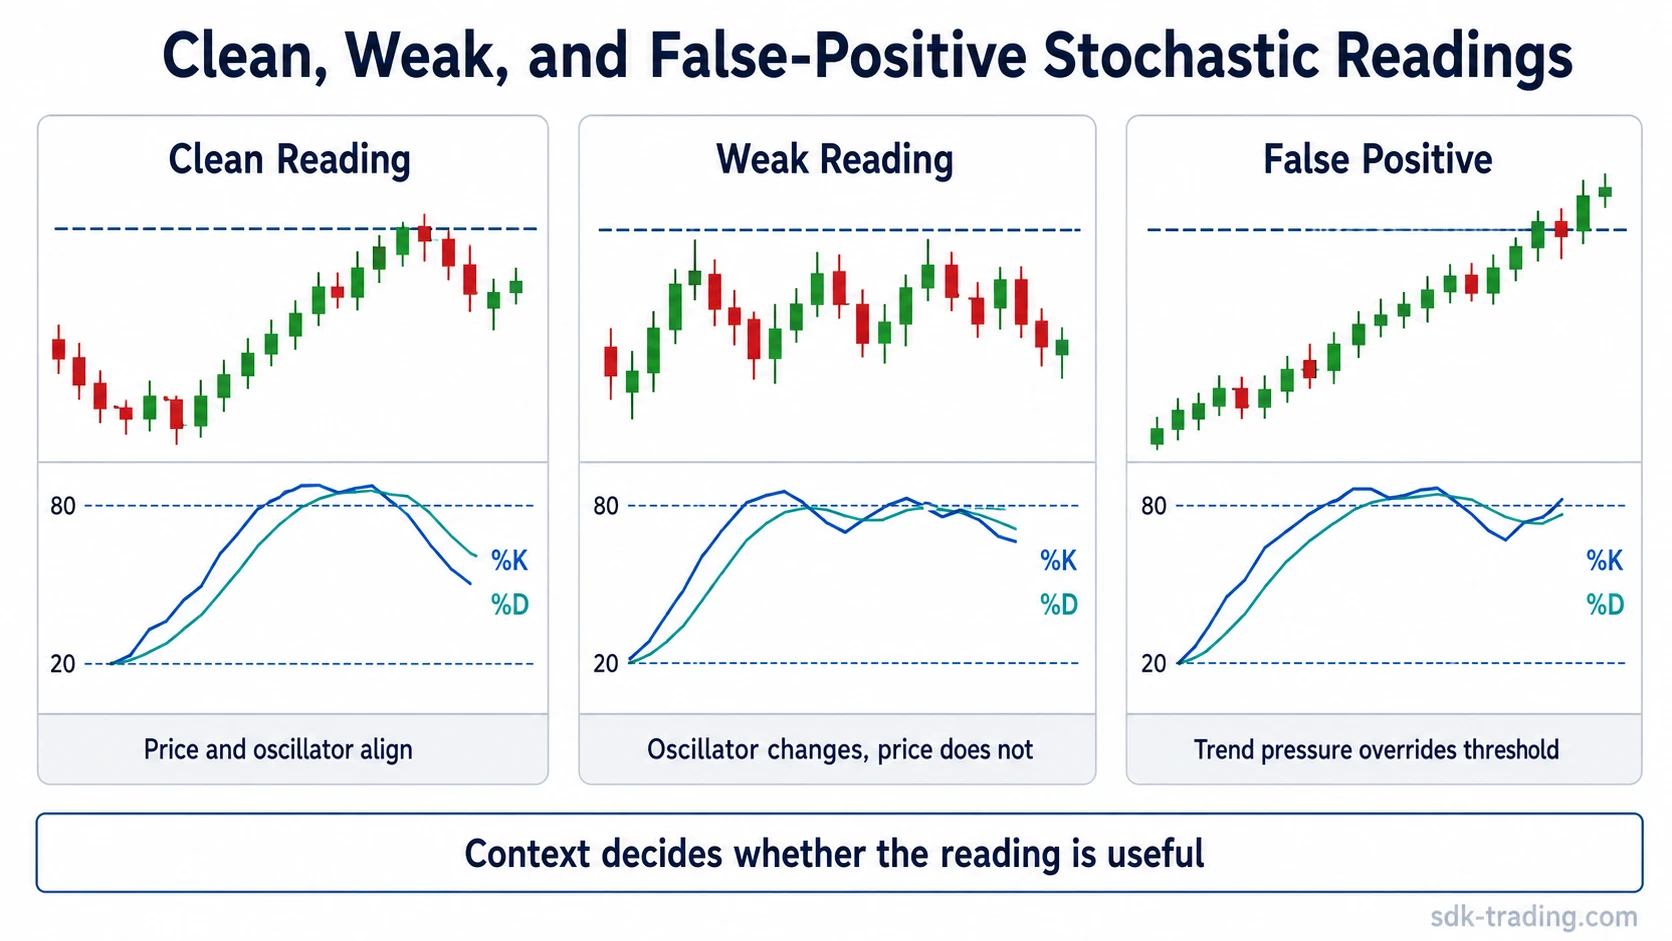
The same stochastic level can carry different meaning depending on the surrounding market condition. The cleanest readings usually occur when oscillator behavior and price behavior support the same interpretation. The weakest readings occur when the oscillator changes but price does not support the change.
| Reading type | What appears on the oscillator | What price context should show | Safer interpretation |
|---|---|---|---|
| Clean reading | The oscillator reaches an extreme, then %K and %D begin moving in the same direction without conflicting line behavior. | Price also shows rejection, slowing acceptance, or a failed push at the relevant range area. | The oscillator reading and price behavior are aligned enough to support an interpretation, not a certainty. |
| Weak reading | The oscillator touches an extreme or produces a line cross. | Price does not show a meaningful shift in acceptance or rejection. | The reading is incomplete because the chart condition has not changed enough. |
| False-positive reading | The oscillator stays extreme or turns briefly from an extreme. | Price continues accepting the trend direction despite the oscillator state. | The threshold reading may be misleading because trend pressure is still dominant. |
Stochastic Oscillator in Range and Trend Conditions
The stochastic oscillator is often easier to interpret in range-bound conditions because range edges give the close-position reading a clearer reference point. A move into the upper part of the range, followed by rejection, can make a high stochastic reading more coherent. A move into the lower part of the range, followed by rejection, can make a low reading more coherent.
Trend conditions can change that reading. In a strong advance, price may keep closing near the top of the lookback range. The stochastic oscillator can remain near the upper area while price continues to accept higher levels. In a strong decline, the oscillator can remain near the lower area while price continues to accept lower levels.
A common scenario is a market that touches the upper stochastic threshold during a sideways range and then fails to hold the range edge. That can produce a cleaner reading than a trending market where price keeps closing higher while stochastic remains elevated. The second case creates a false-positive reversal read if the threshold is treated as a standalone conclusion.
Common Misreadings and Limitations
The stochastic oscillator is a close-position tool. Its main limitation is that a close near the top or bottom of a recent range does not automatically explain why price is there, whether the move is exhausted, or whether trend pressure has ended.
| Limitation | Why it matters | Safer reading |
|---|---|---|
| Threshold false positives | Overbought and oversold readings can persist during strong trends. | Treat thresholds as states that need price and regime context. |
| Smoothing lag | %D responds more slowly because it smooths %K. | Use %D as a stabilizing reference, not as proof of a completed turn. |
| Bounded scale compression | The 0-100 scale can make repeated extreme readings look similar. | Compare the reading with the price structure, not only with the level. |
| Mechanism confusion | Stochastic can be confused with RSI or Stochastic RSI. | Remember that standard stochastic reads price close location inside a price range. |
Stochastic Oscillator vs Related Oscillators
The stochastic oscillator belongs to the oscillator family, but it should not be blended with nearby indicators that measure different inputs. The compact distinction is mechanical: what each oscillator measures first.
| Indicator | Primary measurement | Difference from stochastic oscillator |
|---|---|---|
| RSI | Recent gains versus recent losses. | RSI compares up and down movement strength, while stochastic compares the latest close with a rolling price range. |
| Stochastic RSI | Stochastic-style range logic applied to RSI values. | Measures where RSI sits inside its own recent range, not where price closes inside the price range. |
| ROC | Percentage change from a prior price. | ROC measures displacement from a previous price, while stochastic measures close location inside a high-low range. |
| Awesome Oscillator | Difference between short and long moving averages of median price. | Awesome Oscillator reads moving-average momentum, not close position inside a lookback range. |
| Ultimate Oscillator | Momentum across multiple timeframes. | Ultimate Oscillator blends several lookback periods, while stochastic uses close position within a selected high-low range. |
| MFI | Price and volume-based money flow. | MFI includes volume behavior, while stochastic is based on price range and close location. |
FAQ
What does the stochastic oscillator measure?
The stochastic oscillator measures where the latest closing price sits within the high-low range over a selected lookback period.
What are %K and %D in the stochastic oscillator?
%K is the raw close-position reading, while %D is a smoothed version of %K. %D usually moves more slowly because it averages the faster %K line.
Does overbought mean price must reverse?
No. An overbought stochastic reading means the close is near the upper part of the recent range. Price can stay near that area during strong trend pressure.
Does oversold mean price must bounce?
No. An oversold stochastic reading means the close is near the lower part of the recent range. Price can remain weak if lower prices keep being accepted.
How is the stochastic oscillator different from RSI?
RSI measures recent gains versus recent losses. The stochastic oscillator measures where the latest close sits inside a recent high-low price range.