The awesome oscillator is an unbounded momentum oscillator that compares a 5-period simple moving average of median price with a 34-period simple moving average of median price. Its histogram moves around a zero line, showing whether the shorter median-price average is above or below the longer one and whether that spread is expanding or shrinking.
Definition: The awesome oscillator measures momentum by subtracting a 34-period simple moving average of median price from a 5-period simple moving average of median price. Positive values mean the shorter median-price average is above the longer one. Negative values mean it is below the longer one.
Key Points
- The awesome oscillator compares 5- and 34-period simple moving averages of median price.
- The zero line separates positive and negative spread between the shorter and longer averages.
- Bar color reflects change from the prior AO bar, not automatic bullish or bearish territory.
- AO readings weaken when the histogram changes inside choppy price action without clear price acceptance.
What Is the Awesome Oscillator?
The awesome oscillator, often shortened to AO, is a momentum indicator developed by Bill Williams. It is plotted as a histogram rather than a bounded line, so it does not move between fixed 0-100 levels. The reading is relative to its own zero line and to the changing distance between two median-price averages.
AO is designed to show a shift in momentum, not a complete market decision. A histogram above zero means the shorter median-price average is higher than the longer median-price average. A histogram below zero means the shorter average is lower. Useful interpretation comes from combining zero-line position, bar expansion or contraction, and surrounding market structure.
How the Awesome Oscillator Is Calculated
The awesome oscillator starts with median price rather than close price. Median price is calculated as the high plus the low divided by two:
Median price: (High + Low) / 2
Awesome Oscillator: SMA of median price over 5 periods – SMA of median price over 34 periods
AO uses the midpoint of each bar’s high-low range, so its input differs from close-price oscillators. The 5-period average represents the shorter momentum window. The 34-period average represents the slower baseline. When the short average rises above the long average, AO moves above zero. When the short average falls below the long average, AO moves below zero.
Because both inputs are moving averages, AO can lag fast price changes. A sudden histogram turn may describe a change in the spread between averages, but it does not prove that price has accepted a new direction.
How to Read the Awesome Oscillator Histogram
The AO histogram has four basic visual elements: zero-line position, bar height, bar color, and expansion or contraction. These elements should be read together because each one answers a different question.
| AO element | What it describes | Reading boundary |
|---|---|---|
| Above zero | The 5-period median-price average is above the 34-period average. | Positive territory, but still needs market structure. |
| Below zero | The 5-period median-price average is below the 34-period average. | Negative territory, even if the latest bar turns green. |
| Green bar | The current AO value is higher than the previous AO value. | Improvement from the prior bar, not automatic positive territory. |
| Red bar | The current AO value is lower than the previous AO value. | Weakening from the prior bar, not automatic negative territory. |
| Taller bars | The spread between the two averages is expanding. | Momentum is stretching, but an extreme bar is not proof of exhaustion. |
| Shorter bars | The spread between the two averages is contracting. | Momentum is compressing, but compression may remain unresolved. |
The common trap is reading color as territory. A green AO bar below zero can mean negative momentum is becoming less negative, while the oscillator is still below the zero line. A red AO bar above zero can mean positive momentum is cooling, while the oscillator is still in positive territory.
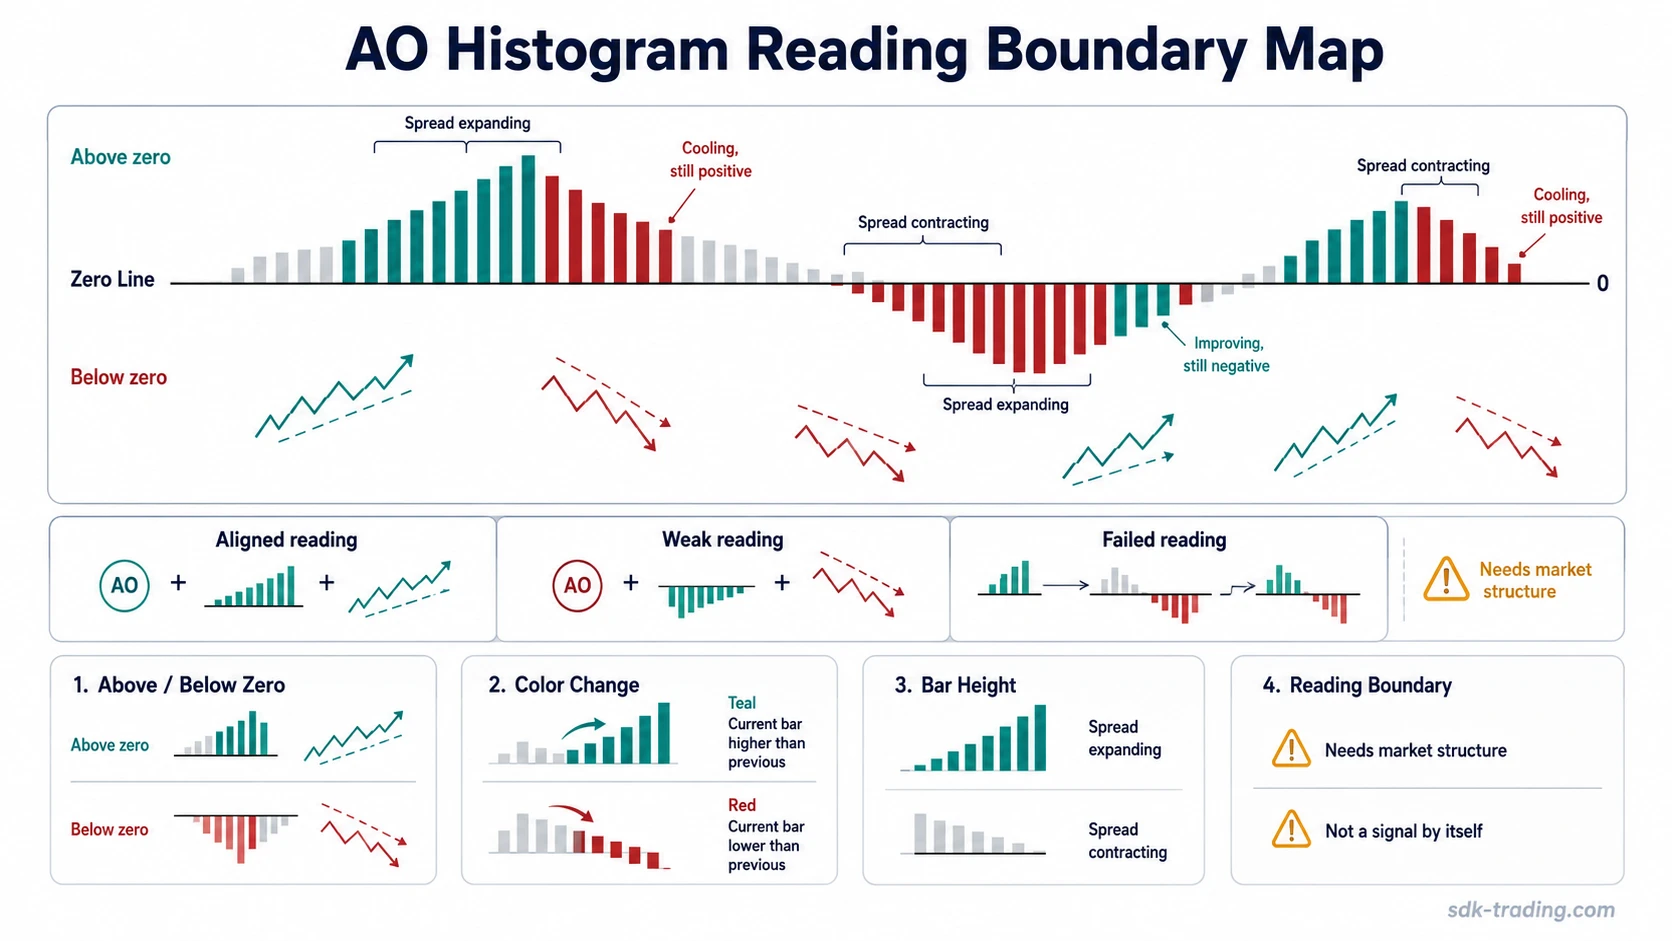
Clean, Weak, and Invalid AO Readings
A cleaner AO reading is not defined by the most colorful bar or the largest histogram spike. A cleaner reading appears when zero-line position, histogram direction, and market behavior point in the same direction. A weaker reading appears when only one element improves while the rest of the chart remains mixed.
| Reading type | AO behavior | Market behavior | Interpretation boundary |
|---|---|---|---|
| Clean reading | AO is on the relevant side of zero and the bars expand in the same direction. | The tested area holds instead of rotating back immediately. | The oscillator and market structure are aligned. |
| Weak reading | AO color improves, but the histogram remains on the opposite side of zero. | Price remains inside a range or stalls near the same area. | The reading is improving, but not yet aligned. |
| Invalid or failed reading | AO crosses the zero line and quickly reverses back through it. | Price fails to hold the tested area and returns into prior chop. | The initial histogram change did not produce durable acceptance. |
Awesome oscillator example in context: Price moves sideways after a decline while AO remains below zero. The next AO bar turns green, but the histogram is still negative and price cannot reclaim the middle of the range. That improvement is not the same as a clean positive reading. The case becomes more constructive only if AO expands toward or through zero while price also accepts higher levels. It remains weak or unresolved if the histogram fades again below zero and price stays trapped in the same range.
Common Awesome Oscillator Reading Patterns
AO patterns can organize the histogram into recognizable shapes, but they should stay inside interpretation boundaries. The pattern names describe momentum behavior; they do not remove the need to compare the oscillator with market structure.
| Pattern | Basic idea | Reading boundary |
|---|---|---|
| Zero-line cross | AO moves from negative to positive territory, or from positive to negative territory. | More useful when price also holds the tested area instead of immediately rotating back. |
| Saucer | AO changes color after a short pullback while staying on the same side of zero. | Needs trend context to avoid treating a small pause as a completed continuation reading. |
| Twin peaks | Two histogram peaks form on the same side of zero, with the second peak showing a change in momentum. | More defensible when the second peak differs clearly and price behavior supports the shift. |
| Divergence | Price makes a new swing extreme while AO fails to make a matching histogram extreme. | Requires comparable price swings and comparable oscillator swings; random points can create false divergence. |
These patterns are best treated as reading patterns. They can highlight a change in momentum, but the chart still needs evidence of acceptance, rejection, compression, or failed follow-through before the interpretation becomes useful.
Common Awesome Oscillator Misreads
AO is easy to overread because the histogram changes visually from bar to bar. The most reliable use starts by separating what the oscillator actually measures from what the chart may appear to imply.
Green below zero: A green bar below zero shows improvement from the prior AO bar, but the shorter median-price average is still below the longer average.
Red above zero: A red bar above zero shows contraction from the prior AO bar, but the shorter average is still above the longer average.
Tall bars: A tall histogram bar shows a wider spread between averages. It does not prove exhaustion by itself.
Zero-line whipsaw: A quick move above or below zero inside sideways price action may reflect moving-average noise rather than a stable momentum shift.
AO without market structure: The histogram is incomplete when the chart has not shown whether the new area is being accepted or rejected.
Awesome Oscillator vs Nearby Oscillators
The awesome oscillator differs from bounded oscillators because it has no fixed upper or lower scale. That makes its histogram relative to the current market and to its own prior values, rather than to a fixed overbought or oversold band.
The stochastic oscillator is a bounded range oscillator, so its reading model depends more directly on where price closes within a recent high-low range.
The ultimate oscillator uses multiple time periods to compare buying pressure with true range, which gives it a different construction from AO’s 5/34 median-price average spread.
AO can also look similar to MACD because both are built from a difference between faster and slower averages. The important distinction is that AO uses median price and a fixed 5/34 structure, while MACD is usually built from exponential moving averages of closing price.
Limitations of the Awesome Oscillator
AO is useful for reading momentum shifts, but it is not a complete market model. It does not include volume, liquidity, order flow, trend quality, or broader market context. It also relies on moving averages, so fast price changes can appear late or become distorted during choppy conditions.
Moving-average lag: AO reacts through averages, so the histogram can trail sharp changes in price behavior.
No fixed overbought or oversold scale: Because AO is unbounded, high or low readings are relative rather than fixed threshold events.
Sideways-market noise: Zero-line crosses can become unstable when price is rotating inside a range.
No volume input: AO does not show whether a move is supported by participation, liquidity, or effort behind the price change.
Pattern dependence: Saucer, twin-peak, and divergence readings require clean swing comparison; unclear swings weaken the reading.
FAQ
What does the awesome oscillator measure?
The awesome oscillator measures the difference between a 5-period simple moving average of median price and a 34-period simple moving average of median price. It shows whether the shorter median-price average is above or below the longer one.
How is the awesome oscillator calculated?
Median price is calculated as high plus low divided by two. AO then subtracts the 34-period simple moving average of median price from the 5-period simple moving average of median price.
What does a green AO bar below zero mean?
A green AO bar below zero means the current AO value is higher than the previous AO value, but the oscillator is still in negative territory. It shows improvement from the prior bar, not a complete positive-territory reading.
When can an awesome oscillator reading become weak?
An AO reading can become weak when price is sideways, when zero-line crosses reverse quickly, or when histogram color changes without price acceptance. The reading is stronger when oscillator behavior and market structure align.