The Ultimate Oscillator is a bounded momentum oscillator that compares buying pressure with true range across multiple lookback windows, commonly 7, 14, and 28 periods. It blends short, medium, and longer pressure readings into one 0-100 value, but it does not confirm a trade by itself.
Its main purpose is to show whether recent closes are carrying pressure relative to the full price range being created. A high reading, low reading, threshold touch, or divergence can describe momentum pressure, but the interpretation becomes more useful only when price behavior, structure, and market context support it.
What Is the Ultimate Oscillator?
The Ultimate Oscillator is a multi-period momentum indicator developed by Larry Williams to reduce the weakness of relying on one lookback window. Instead of measuring only short-term momentum, it combines three pressure readings so that a single short-term move does not dominate the whole interpretation.
Definition: The Ultimate Oscillator measures buying pressure relative to true range across short, medium, and longer lookback periods, then converts the weighted result into a bounded 0-100 oscillator reading.
The useful boundary is simple: the indicator measures pressure inside its own formula. It does not prove that price must reverse, continue, or respond at a specific level. A reading can become more meaningful when it agrees with price acceptance, rejection, trend structure, range behavior, or a broader confirmation process.
| Boundary item | Practical meaning |
|---|---|
| What it is | A bounded multi-window momentum oscillator. |
| What it measures | Buying pressure relative to true range across several periods. |
| What it is not | It is not a prediction tool or a standalone trade instruction. |
| What supports a reading | Price behavior, structure, acceptance, rejection, and surrounding market context. |
| What weakens a reading | Price behavior that contradicts the oscillator or continues accepting the opposite direction. |
How the Ultimate Oscillator Formula Works
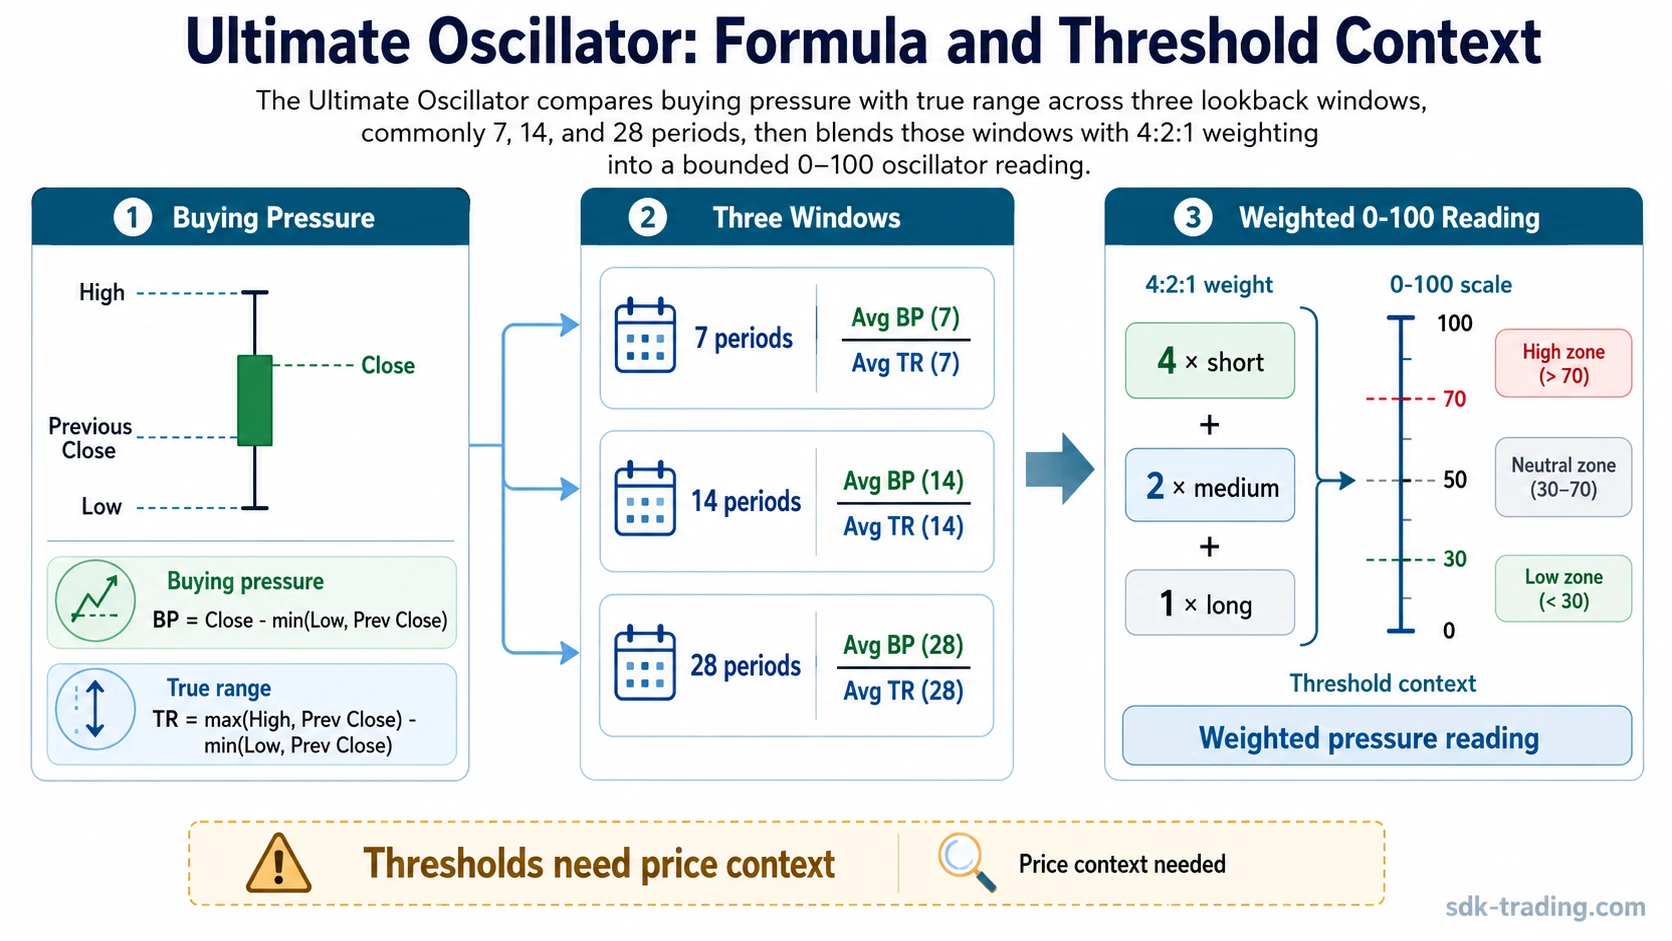
The formula starts with two ideas: buying pressure and true range. Buying pressure compares the current close with the lower of the current low or the prior close. True range compares the higher of the current high or prior close with the lower of the current low or prior close.
Buying Pressure: Close minus the minimum of current low or previous close.
True Range: Maximum of current high or previous close minus minimum of current low or previous close.
After those values are calculated, the indicator creates average buying-pressure-to-true-range ratios over three windows, usually 7, 14, and 28 periods. The shorter window receives the highest weight, the medium window receives a smaller weight, and the longer window receives the smallest weight.
| Formula part | Role in the indicator |
|---|---|
| Buying pressure | Shows where the close sits relative to downside range pressure. |
| True range | Captures the full effective range, including gaps from the previous close. |
| 7-period average | Represents the short-term pressure window and receives the highest weight. |
| 14-period average | Represents the medium pressure window. |
| 28-period average | Represents the longer pressure window. |
| 4:2:1 weighting | Gives more influence to recent pressure while still including broader context. |
| 0-100 scale | Converts the weighted result into a bounded oscillator reading. |
A simplified expression is:
Ultimate Oscillator = 100 x [(4 x Average 7) + (2 x Average 14) + Average 28] / 7
Each average is based on buying pressure divided by true range over that lookback window. The formula therefore does not only ask whether price moved up or down. It asks how much buying pressure appears relative to the range that price had to travel through.
What Ultimate Oscillator Readings Mean
Ultimate Oscillator readings are usually interpreted through high readings, low readings, threshold movement, and divergence. These readings describe pressure conditions inside the indicator. They do not become reliable conclusions unless price behavior supports the same interpretation.
| Reading / element | What it can suggest | What weakens it |
|---|---|---|
| High reading | Buying pressure has been strong relative to true range. | Price remains extended without rejection, or the market continues accepting higher levels. |
| Low reading | Buying pressure has been weak relative to true range, often reflecting weaker closing behavior inside the recent range. | Price continues accepting lower levels without a structural response. |
| Bullish divergence | Price makes a weaker low while the oscillator stops confirming the same pressure. | The divergence does not change price structure or attract meaningful acceptance higher. |
| Bearish divergence | Price makes a stronger high while the oscillator stops confirming the same pressure. | Price keeps accepting higher levels and the divergence remains only an internal indicator mismatch. |
| Threshold cross | The oscillator has moved out of an extreme area or into a new pressure zone. | The cross appears without price confirmation or occurs inside a strong trend that keeps absorbing the signal. |
| Multi-window agreement | Short, medium, and longer pressure readings are not strongly contradicting each other. | One window dominates the reading while the broader market structure disagrees. |
Thresholds are reference areas, not proof. A market can stay extended while the oscillator remains high or low. The reading becomes more useful when the threshold behavior appears at a meaningful price area and price begins to confirm the change in pressure.
Clean, Weak, and False-Positive Readings
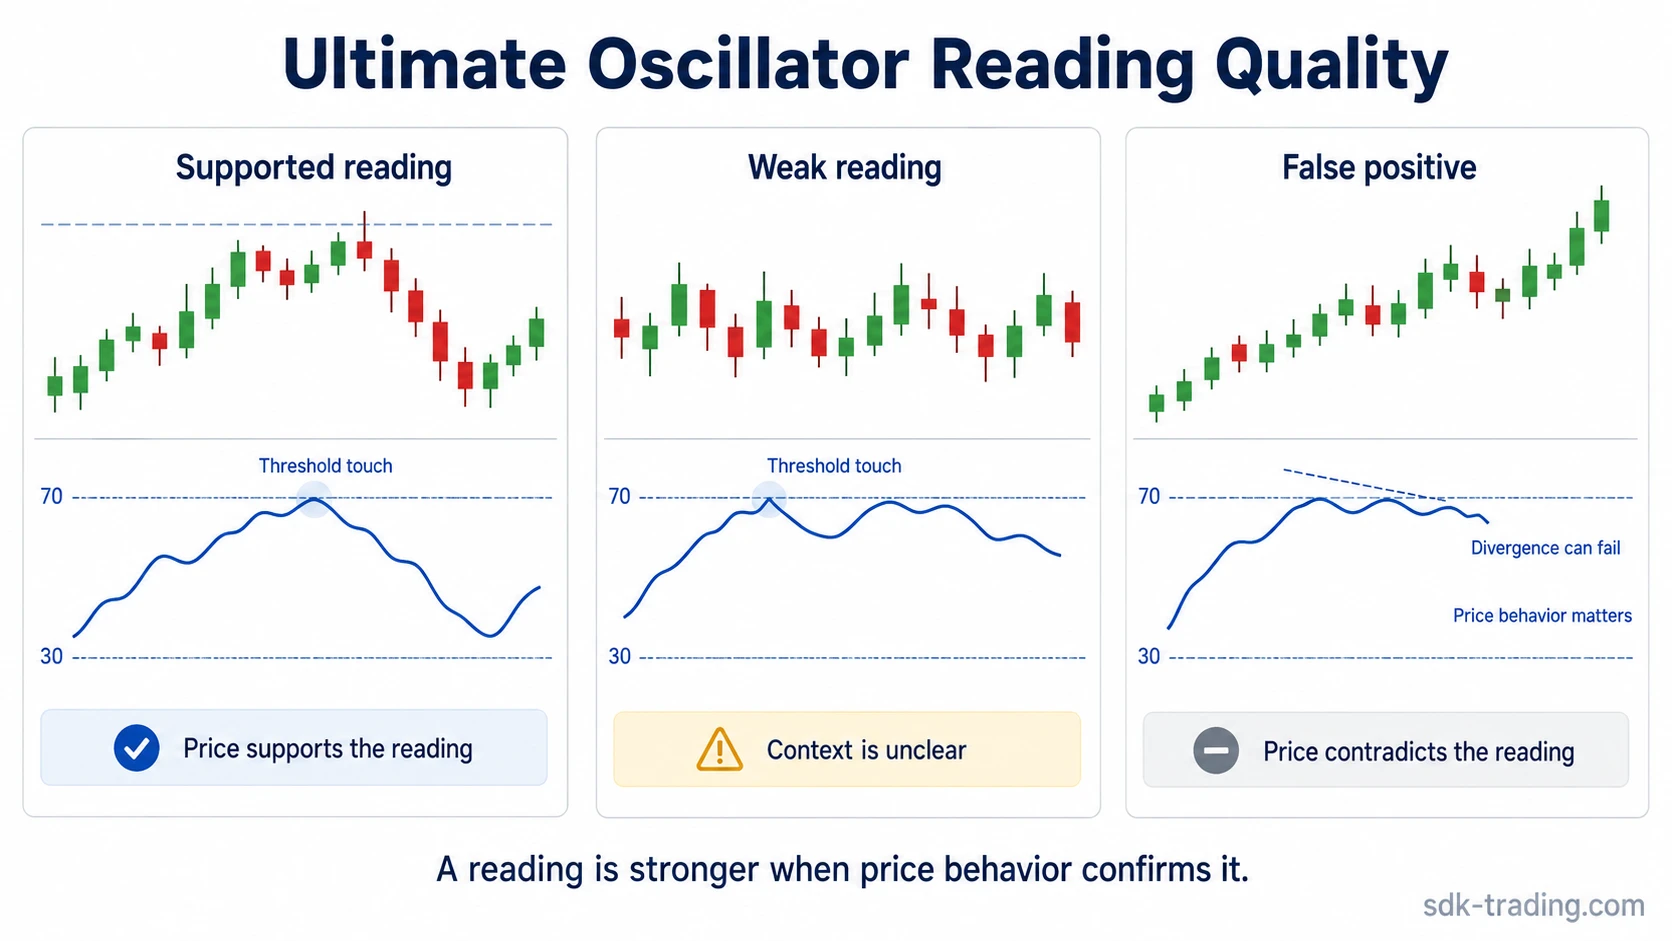
A clean Ultimate Oscillator reading is not simply a high number, low number, or divergence. It is a reading that fits the surrounding price behavior. The oscillator and the chart do not need to say the same thing perfectly, but they should not actively contradict each other.
| Reading type | What it looks like | How to interpret it safely |
|---|---|---|
| Clean reading | The oscillator reading aligns with price behavior, structure, and acceptance or rejection. | The reading can support interpretation because the chart is confirming the same pressure shift. |
| Weak reading | The oscillator reacts, but price behavior does not confirm the change. | The reading should remain secondary until price begins to reject the prior direction or show structural change. |
| False-positive reading | A threshold touch or divergence appears, but price continues accepting the opposite direction. | The oscillator signal is invalidated by price behavior and should not be treated as a conclusion. |
For example, a bullish divergence may appear while price continues to accept lower levels. In that case, the divergence is only an internal mismatch between price and the oscillator. It becomes more useful only if price begins to reject lower levels, form a structural response, or show that downside continuation pressure is weakening.
Why Ultimate Oscillator Divergence Can Fail
Divergence is one of the most common Ultimate Oscillator interpretations, but it is also one of the easiest to overstate. A divergence means the oscillator is no longer confirming price movement in the same way. It does not mean price has already changed direction.
A weak divergence often appears when the oscillator is reacting to one part of the range while the broader market continues to accept the prevailing direction. The reading becomes stronger only when price starts rejecting that direction, losing continuation pressure, or changing structure.
Limitation: Divergence is a warning condition, not a completed conclusion. It can remain early, fail completely, or become irrelevant if price keeps accepting the prior direction.
Ultimate Oscillator vs Other Oscillators
The Ultimate Oscillator belongs to the oscillator family, but it is not the same as RSI, Williams %R, Stochastic RSI, or the Stochastic Oscillator. The main difference is the input logic. The Ultimate Oscillator blends buying pressure relative to true range across three lookback windows.
| Indicator | Boundary distinction |
|---|---|
| RSI | Normalizes gains and losses over a lookback period. |
| Stochastic Oscillator | Measures where the close sits within the recent high-low range. |
| Williams %R | Uses similar range-position logic, but with an inverted scale. |
| Stochastic RSI | Applies stochastic logic to RSI values rather than directly to price range. |
| Ultimate Oscillator | Blends buying pressure relative to true range across 7, 14, and 28 period windows. |
This distinction matters because two oscillators can reach extreme-looking readings for different reasons. One may be reacting to close location, another to normalized gains and losses, and another to a weighted blend of pressure and true range. A comparison with another momentum oscillator should therefore start with inputs and calculation logic, not only with the shape of the plotted line.
Limitations of the Ultimate Oscillator
The Ultimate Oscillator can organize pressure information across several windows, but it still has the limitations of a bounded, formula-based indicator. It can remain high or low for longer than expected. It can show divergence before price responds. It can react late when smoothing absorbs part of the change.
| Limitation | Why it matters |
|---|---|
| Extreme readings can persist | Strong trends can keep the oscillator elevated or depressed without immediate reversal. |
| Divergence can fail | Price may continue accepting the prevailing direction even when oscillator pressure slows. |
| Fixed weighting is not universal | The 4:2:1 blend may not fit every asset, timeframe, or volatility environment equally well. |
| Smoothing can delay reaction | The indicator may react after part of the pressure change has already appeared in price. |
| Price can contradict the reading | Market structure and acceptance can invalidate a threshold touch or divergence. |
The safest interpretation is to treat the Ultimate Oscillator as a pressure-reading tool. It can help organize whether buying pressure is strengthening or weakening across multiple windows, but it should not replace market structure, volume context, risk definition, or execution discipline.
FAQ
What does the Ultimate Oscillator measure?
The Ultimate Oscillator measures buying pressure relative to true range across multiple lookback periods, commonly 7, 14, and 28 periods.
What is the Ultimate Oscillator formula?
It calculates buying-pressure-to-true-range averages over three lookback windows, weights them 4:2:1, and converts the result into a 0-100 oscillator value.
Is the Ultimate Oscillator a buy or sell signal?
No. It is an indicator reading. A threshold touch, high reading, low reading, or divergence needs price behavior and market context before it can support any interpretation.
Why can Ultimate Oscillator divergence fail?
Divergence can fail when price continues accepting the prior direction even though the oscillator no longer confirms the move with the same pressure.