Overbought and oversold are oscillator threshold states, not automatic reversal signals. Overbought means an oscillator is stretched toward its upper side. Oversold means it is stretched toward its lower side. Neither condition confirms exhaustion, direction, or a trade action by itself.
The useful distinction is not “sell high” versus “buy low.” The useful distinction is whether the threshold state is supported or weakened by market context. A strong trend can keep an oscillator stretched for longer than expected, while a range-bound market may react more cleanly around upper and lower threshold zones.
Key Points
- Overbought means an oscillator is stretched toward its upper threshold.
- Oversold means an oscillator is stretched toward its lower threshold.
- A threshold state is not a reversal signal by itself.
- Trend or range context changes how the reading should be interpreted.
What Overbought vs Oversold Readings Mean
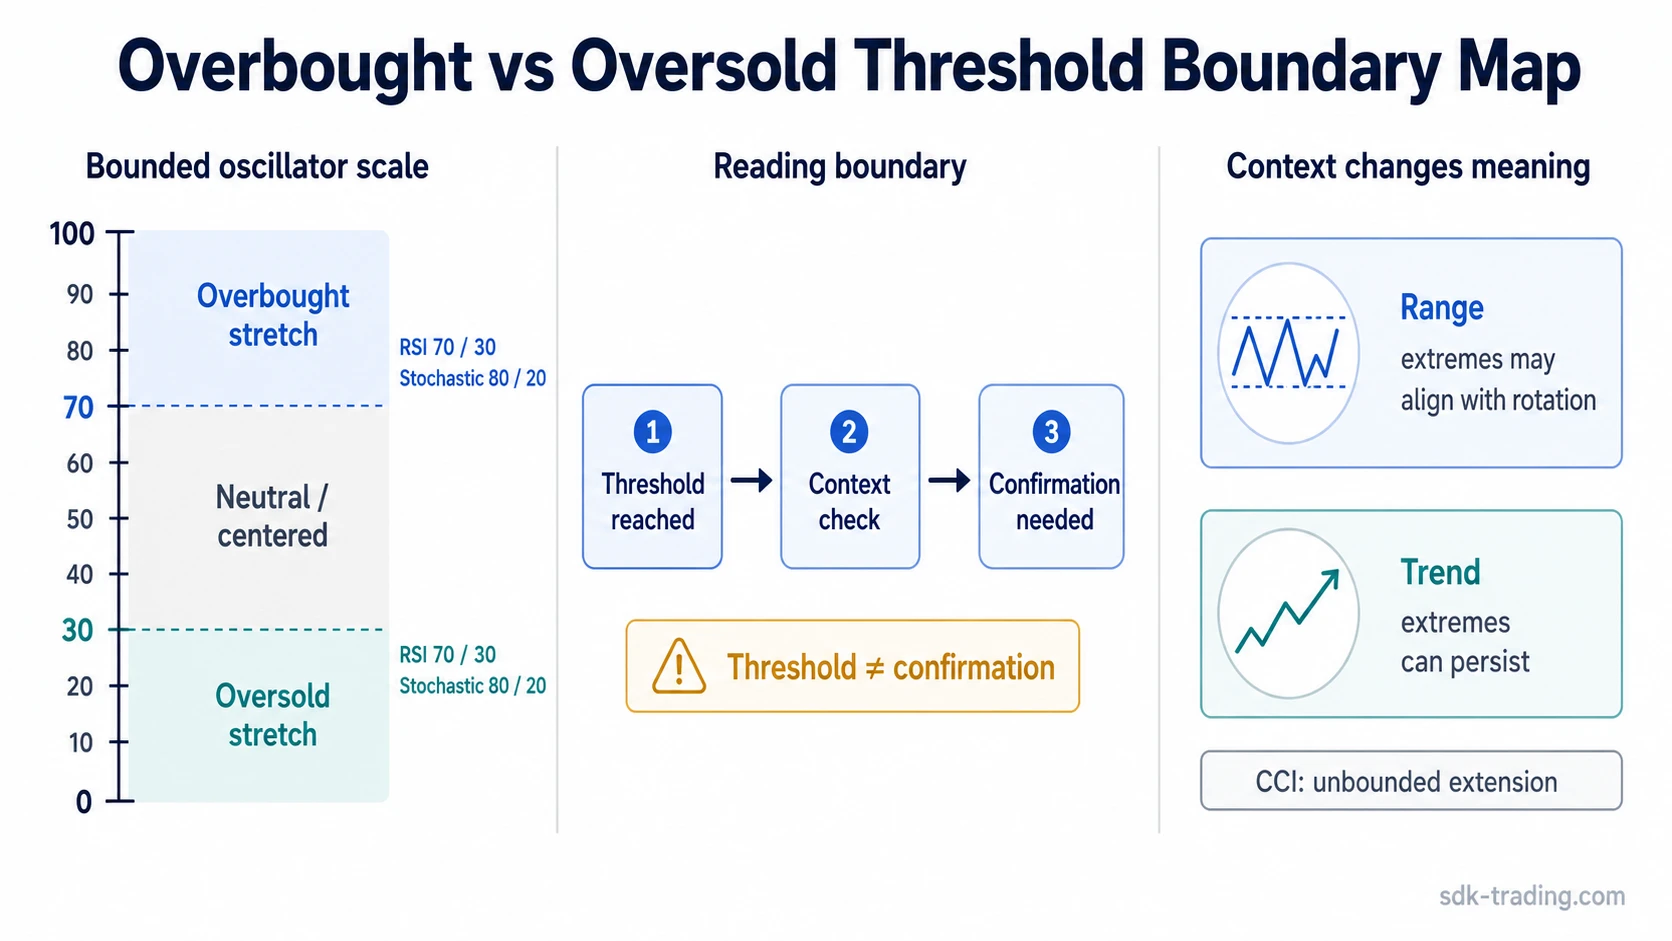
An overbought reading shows that an oscillator has moved into its upper-side zone. In many bounded oscillators, this means the reading is near a commonly watched high threshold, such as RSI above 70 or stochastic above 80. These are common examples, not universal rules for every oscillator.
An oversold reading shows the opposite condition: the oscillator has moved toward its lower-side zone. Common examples include RSI below 30 or stochastic below 20. The reading can show downside pressure, but it does not prove that selling is finished.
The broader concept of overbought and oversold oscillator readings is about stretched conditions inside an indicator model. The narrower decision is how to separate a threshold state from confirmation.
Threshold Reading Boundary
| Reading | Common threshold example | What it can suggest | What it does not prove |
|---|---|---|---|
| Overbought | RSI above 70 or stochastic above 80 | The oscillator is stretched toward the upper side of its model | Price must fall |
| Oversold | RSI below 30 or stochastic below 20 | The oscillator is stretched toward the lower side of its model | Price must rise |
| Neutral or centered | Mid-zone readings vary by oscillator | Momentum or pressure is less stretched | Trend direction |
| Unbounded extension | CCI above or below common reference levels | Price is displaced from its average relative to mean deviation | A fixed 0-100 boundary |
Bounded oscillators and unbounded oscillators need different handling. RSI and stochastic are usually read on a 0-100 scale. The CCI oscillator is different because it can extend beyond common reference levels instead of staying inside a fixed 0-100 boundary.
Why Overbought Does Not Automatically Mean Sell
An overbought reading shows strength or upside stretch. It does not show that buyers have finished, that trend structure has broken, or that price has failed to continue.
The signal becomes more meaningful only when it is compared with price behavior. If price reaches resistance, momentum weakens, and follow-through fails after the oscillator is already stretched, the overbought condition may become part of a weaker-reading case. Without that surrounding evidence, the threshold only describes stretch.
A strong trend can also remain overbought through several swings. In that condition, the oscillator may be describing persistent buying pressure rather than an immediate reversal point.
Why Oversold Does Not Automatically Mean Buy
An oversold reading shows downside stretch. It does not prove that sellers are exhausted, that demand has returned, or that a reversal has started.
The signal becomes stronger only when context changes. Price may stop making progress lower, momentum may fail to confirm a new low, or market structure may begin to stabilize. Without those changes, an oversold oscillator can remain weak while price continues lower.
The common mistake is treating the first oversold print as enough evidence. A threshold can identify pressure, but confirmation comes from what happens after the threshold is reached.
Range vs Trend Context
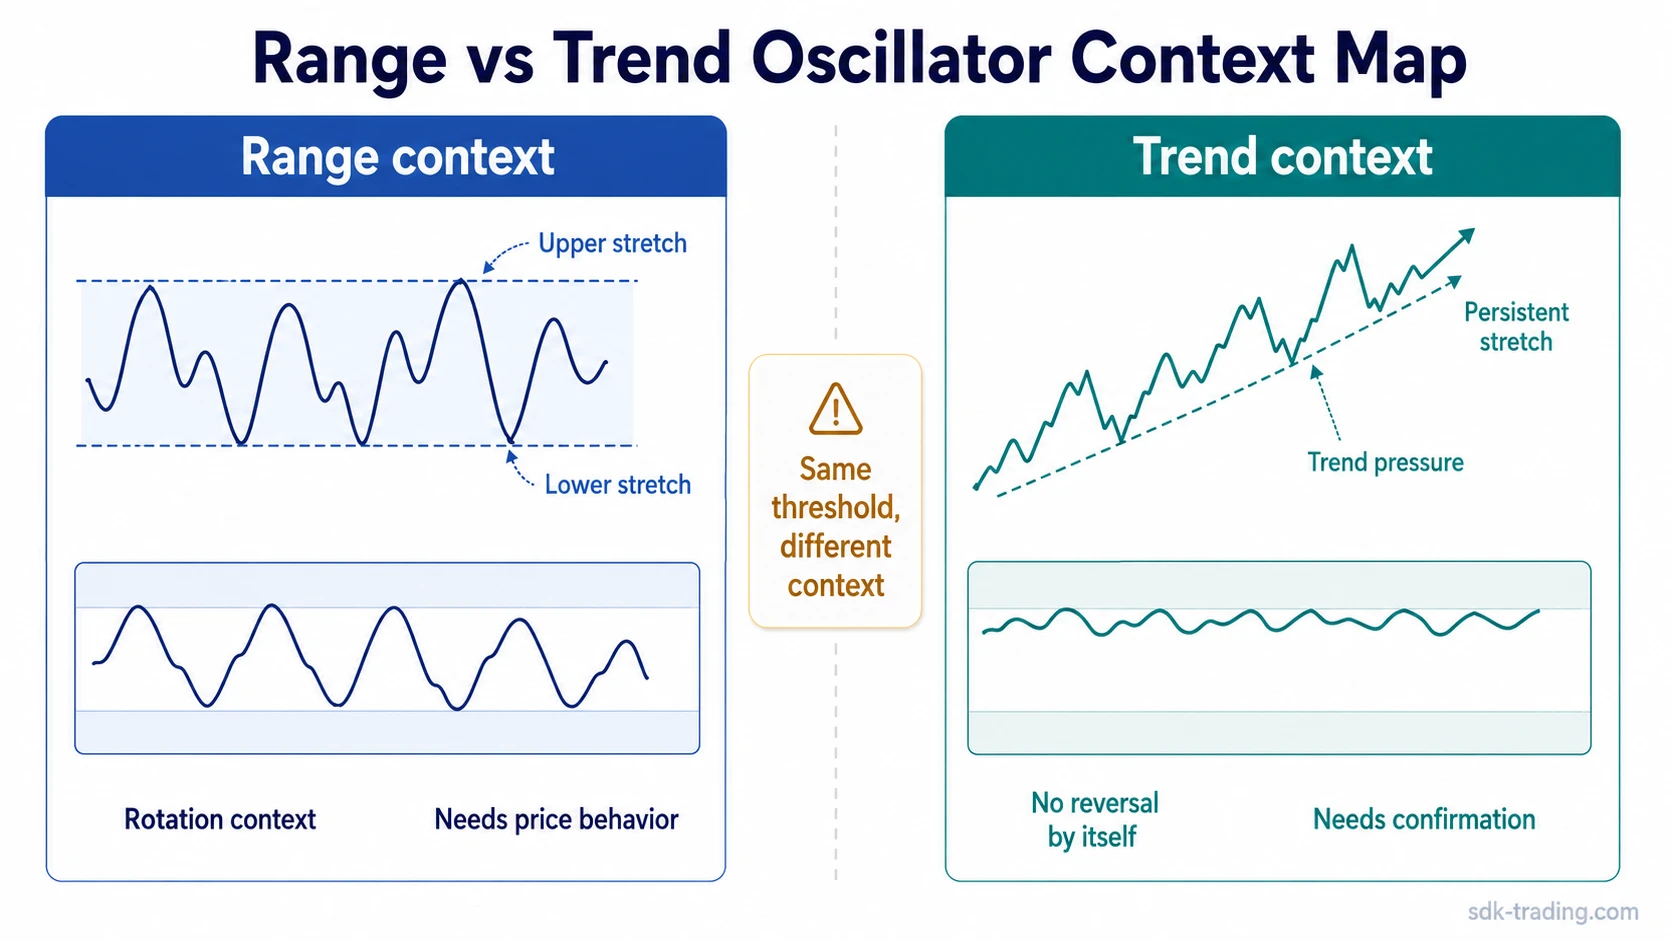
The same overbought or oversold reading can mean different things in different market conditions.
In a range-bound market, price is already rotating between upper and lower areas. In that setting, upper oscillator thresholds may align with stretched upside rotation, and lower thresholds may align with stretched downside rotation. The reading can be useful, but it still needs price context.
In a strong trend, oscillator extremes can persist. Overbought readings may appear repeatedly during an uptrend, and oversold readings may appear repeatedly during a downtrend. The threshold still describes stretch, but the interpretation changes because trend pressure can keep the oscillator near an extreme.
Common Mistake: Treating Thresholds as Signals
| Condition | Possible implication | Limitation |
|---|---|---|
| Overbought appears in a weak range near resistance | Upside pressure may be stretched | The reading still needs rejection, weakening momentum, or failed follow-through |
| Overbought appears in a strong uptrend | Buying pressure may still be persistent | The threshold alone is not a reversal warning |
| Oversold appears in a weak downtrend | Selling pressure may still be dominant | The reading alone does not prove demand has returned |
| Oversold appears near a range low | Downside rotation may be stretched | The reading still needs stabilization or follow-through change |
The unsafe shortcut is “overbought means sell” or “oversold means buy.” A safer reading separates condition, implication, and limitation. The threshold describes the condition. Market context decides whether the condition is useful.
Range vs Trend Example
A market has been moving sideways for several sessions. Price reaches the upper part of the range while an oscillator moves into an overbought zone. The reading is tempting because the market has already been rotating between boundaries. If price then fails to hold the upper area and momentum weakens, the threshold becomes part of a stronger stretched-reading case.
Now compare that with a market pressing higher in a persistent uptrend. The oscillator can reach overbought and stay elevated while price keeps making higher highs. In that case, the same threshold warns that the move is stretched, but it does not carry the same meaning as it would inside a clean range.
How to Read the Boundary Safely
Common mistake: Reading the threshold as the trade decision.
Safer interpretation: Read the threshold as a condition, then check whether price behavior confirms or weakens that condition.
Overbought and oversold readings are most useful when they answer a narrow question: is the oscillator stretched, and does market context support that stretched reading? They are weakest when treated as standalone commands.
FAQ
Is overbought always bearish?
No. Overbought means an oscillator is stretched toward its upper side. In a strong uptrend, that stretch can persist while price continues to show strength.
Is oversold always bullish?
No. Oversold means an oscillator is stretched toward its lower side. In a strong downtrend, that stretch can persist until price behavior shows stabilization or failed downside follow-through.
Are RSI 70/30 and stochastic 80/20 universal thresholds?
No. RSI 70/30 and stochastic 80/20 are common examples for bounded oscillators. Other oscillators may use different reference levels or may not operate on a fixed 0-100 scale.