An overbought or oversold indicator reading is an oscillator threshold state. It shows that an indicator calculation has reached an upper or lower extreme relative to its own scale, lookback period, and smoothing method. It is not a direct command to buy, sell, fade, or follow price.
Definition: An overbought reading means an indicator has moved into an upper extreme zone. An oversold reading means the indicator has moved into a lower extreme zone. The reading describes the condition of the indicator calculation, not a guaranteed reversal in price.
| Diagnostic question | Safer interpretation |
|---|---|
| What it is | A threshold reading inside a specific indicator model. |
| What it is not | A complete trading decision or reversal forecast. |
| What makes it cleaner | Range behavior, slowing momentum, failed continuation, or rejection near the extreme. |
| What weakens it | Strong trend acceptance, repeated closes in the same direction, or disagreement across related indicators. |
Key Points
- Overbought and oversold readings are threshold states, not standalone trading signals.
- RSI 70/30 and stochastic 80/20 are common examples, but thresholds depend on the indicator.
- Different oscillators can disagree because they use different inputs, scales, lookbacks, and smoothing.
- A reading is usually cleaner in a range and more dangerous to overread in a persistent trend.
- The useful question is whether price behavior confirms, rejects, or ignores the extreme reading.
What Overbought and Oversold Mean
Overbought means the indicator has reached an upper extreme. Oversold means the indicator has reached a lower extreme. In both cases, the reading says that recent price behavior, range position, momentum, or another measured input has stretched far enough to cross a predefined threshold.
The common mistake is to translate those words too literally. Overbought does not mean buyers must disappear. Oversold does not mean sellers must run out of pressure. A strong trend can keep an oscillator near an extreme while price keeps accepting higher highs or lower lows.
The practical difference between the two readings matters because the upper and lower zones represent different sides of the same threshold model. For a narrower contrast, how the upper and lower extremes differ can be separated more directly.
| Reading | What it describes | What it does not prove |
|---|---|---|
| Overbought | The indicator is in an upper extreme zone. | That price must fall immediately. |
| Oversold | The indicator is in a lower extreme zone. | That price must rise immediately. |
How Overbought and Oversold Indicators Work
Most overbought and oversold tools are oscillators. They compress recent market behavior into a line, ratio, or percentage scale, then compare the current reading with an upper or lower reference zone. The threshold is only meaningful inside the rules of that specific calculation.
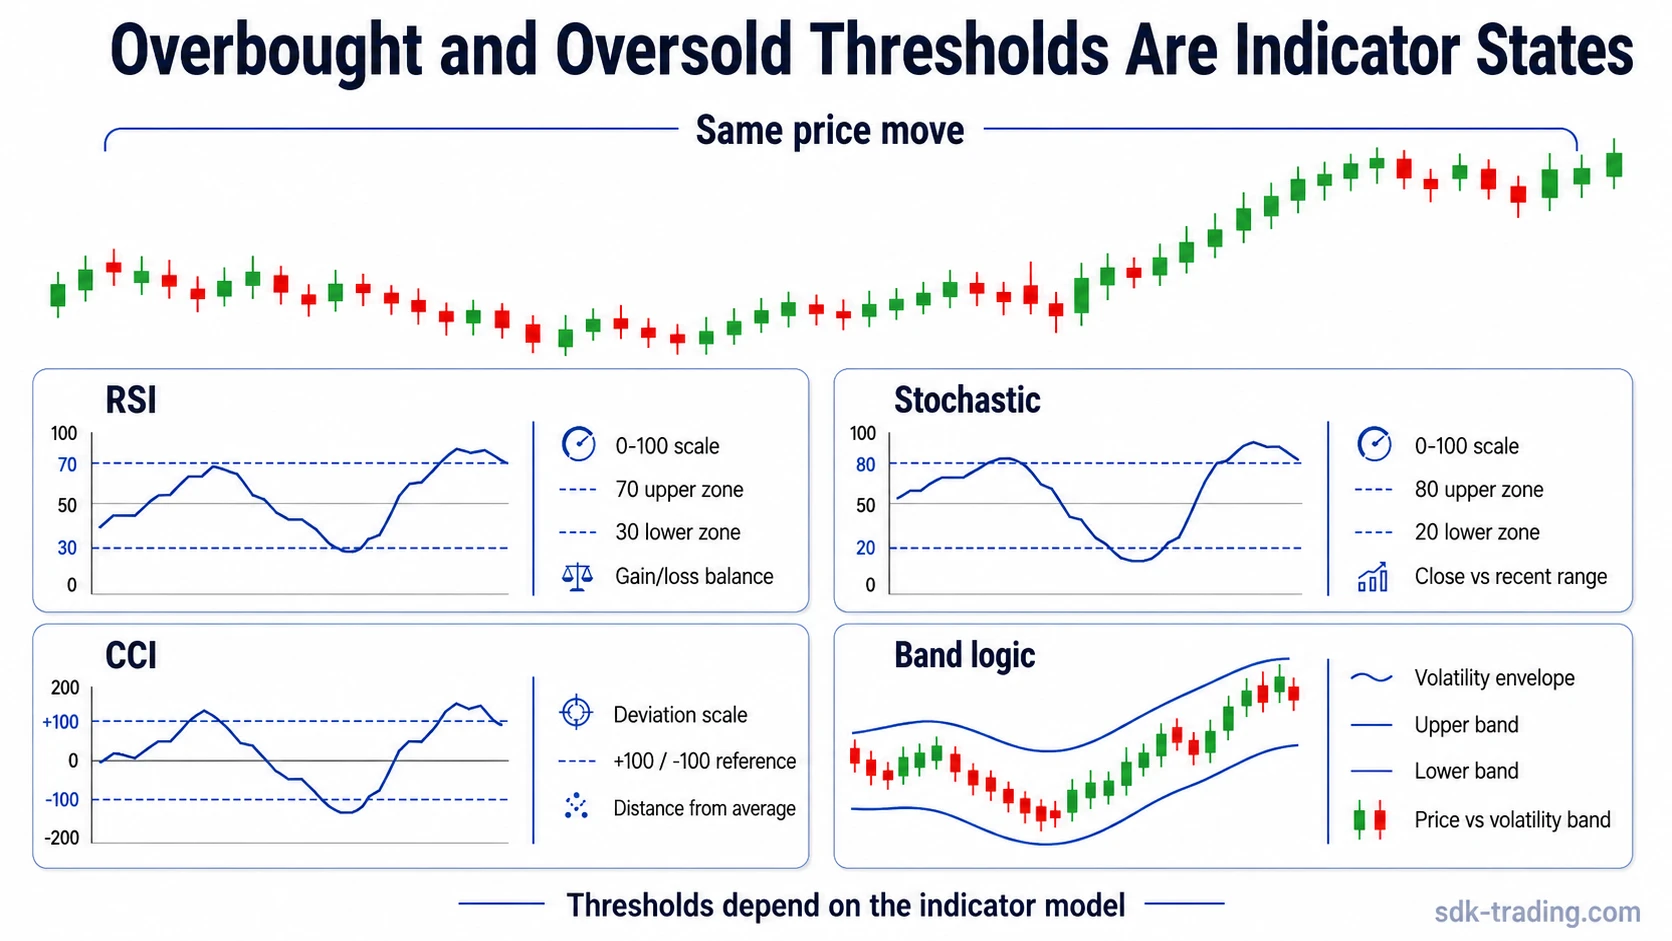
RSI, for example, is commonly read with 70 as an overbought reference and 30 as an oversold reference. The stochastic oscillator is often read with 80 and 20 zones. Those values are useful reference points, but they are not universal laws. They come from each indicator’s design and from market convention.
Different indicators can reach extremes for different reasons. RSI responds to the balance of recent gains and losses. Stochastic readings compare the close with the recent high-low range. CCI measures deviation from a typical price average. Bollinger Bands frame price around volatility bands rather than a fixed 0 to 100 oscillator scale. A range-position oscillator logic can also describe the close relative to a recent high-low range, but it still needs context before the reading becomes useful.
| Indicator / scale | Example threshold | What the reading shows | Main caveat |
|---|---|---|---|
| RSI | 70 / 30 | Recent gains or losses have become dominant inside the lookback. | Can remain elevated or depressed during strong trends. |
| Stochastic oscillator | 80 / 20 | The close is near the upper or lower part of the recent range. | Can flip quickly when the range expands or contracts. |
| CCI | Often +100 / -100 | Price has moved far from its recent typical-price average. | Extreme readings are not bounded in the same way as 0 to 100 oscillators. |
| Bollinger Bands | Upper / lower band interaction | Price is pressing against a volatility envelope. | A band touch can reflect volatility expansion, not exhaustion. |
Common Thresholds and Why They Differ
Thresholds differ because indicators do not measure the same thing. A bounded 0 to 100 oscillator behaves differently from an unbounded deviation indicator or a volatility band. Even two bounded oscillators can disagree if one measures recent gain-loss balance and another measures the close within a high-low range.
Lookback length changes sensitivity. A shorter lookback may reach an extreme faster and reset faster. A longer lookback may respond more slowly and stay smoother. Smoothing can reduce noise, but it can also delay the moment when the reading changes direction.
Normalization also matters. Some indicators convert raw movement into a bounded scale, while others compare price with an average, range, or volatility envelope. That is why overbought and oversold should be read as indicator-specific conditions rather than identical signals across every tool.
Range Markets vs Strong Trends
Overbought and oversold readings are often more intuitive in a range. When price repeatedly rotates between a lower area and an upper area, an oscillator extreme may help show when price is stretched near one side of that range. Even then, the reading is only a condition. It still needs evidence that price is failing to continue.
Strong trends are different. In a persistent advance, an overbought reading may remain elevated while price keeps closing higher. In a persistent decline, an oversold reading may remain depressed while price keeps accepting lower levels. The threshold touch can be early, noisy, or irrelevant until price behavior changes.
Strong-trend caveat: A repeated extreme reading can show trend pressure rather than reversal risk. The reading becomes more useful only when the trend begins to lose acceptance, momentum changes behavior, or price fails to hold the area that created the extreme.
Clean, Weak, and Invalid Readings
The same threshold reading can have different quality depending on the surrounding price behavior. A clean reading does not mean certain reversal. It means the indicator extreme and the market context are telling a more coherent story.
| Status | Reading condition | What it suggests | What would weaken it |
|---|---|---|---|
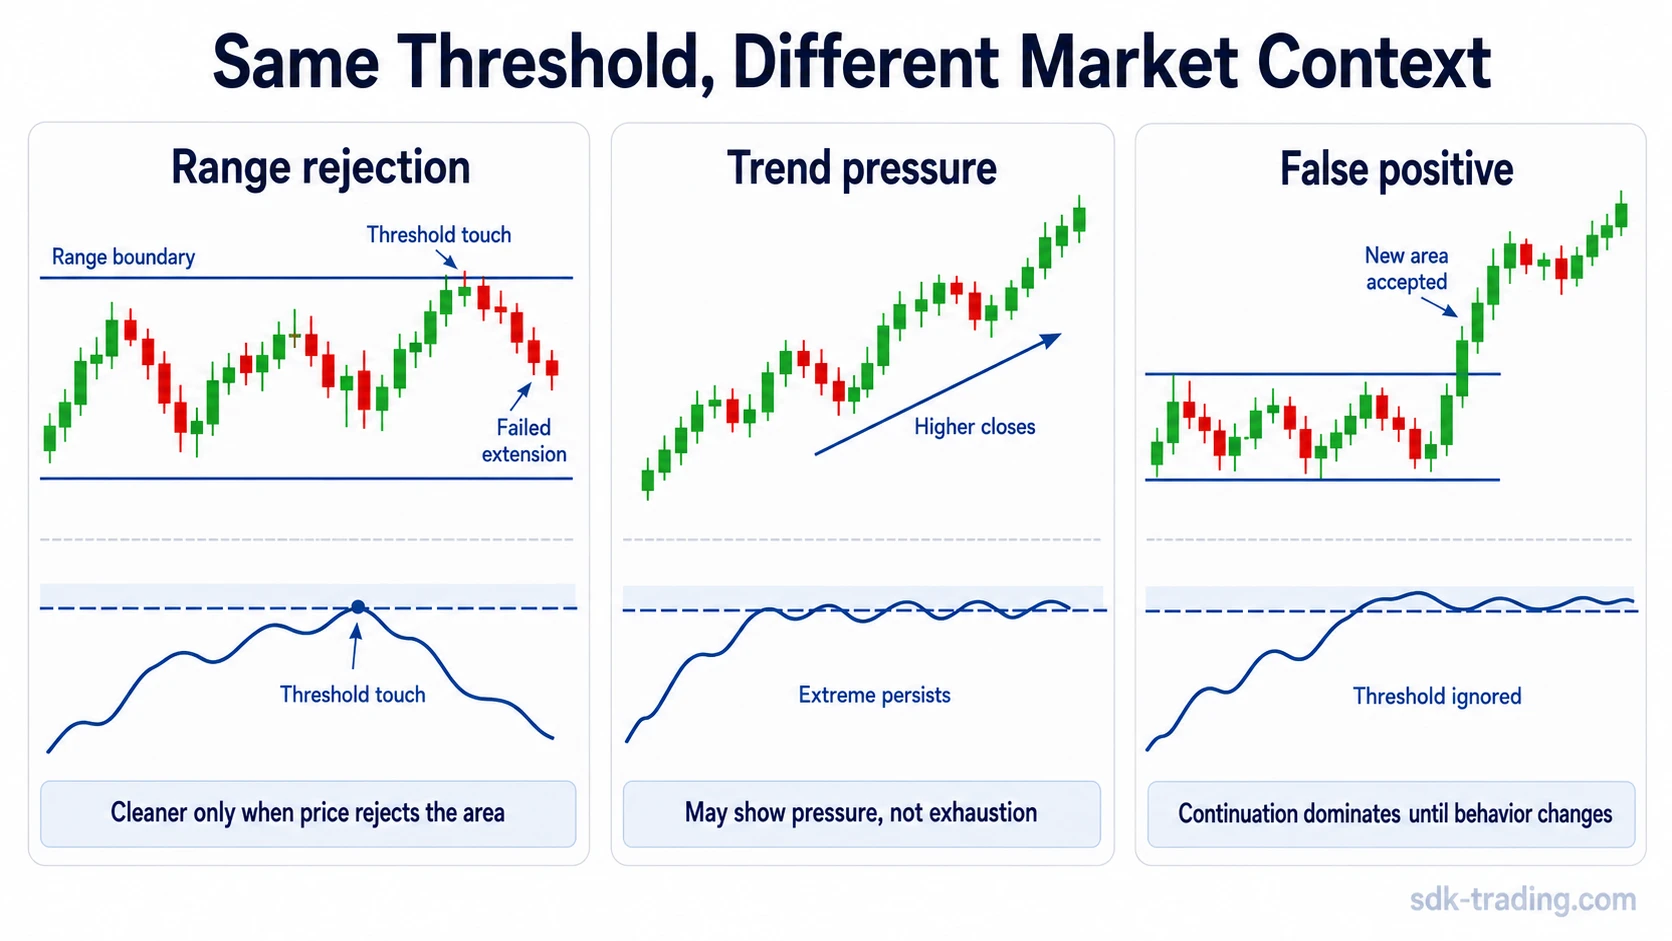
| Clean | The oscillator reaches an extreme near a range boundary and price fails to extend. | The market may be stretched and losing continuation pressure. | A fast reclaim and renewed acceptance in the prior direction. |
| Weak | The oscillator reaches an extreme, but price is still closing strongly in the same direction. | The reading may reflect trend strength more than exhaustion. | Repeated closes that keep confirming the trend direction. |
| Invalid / false positive | The threshold is touched, but price breaks out, accepts the new area, and the oscillator stays extreme. | The threshold did not capture a usable exhaustion point. | Continuation becomes the dominant evidence until behavior changes. |
Overbought Oversold Indicator Reading in Context
Consider a range where price has repeatedly rotated between a lower boundary and an upper boundary. Price pushes into the upper area, and RSI moves above 70. The overbought label fits the indicator condition, but the reading is still incomplete.
If price closes above the range, holds the breakout area, and the oscillator remains elevated, the threshold may be describing accepted upside pressure rather than exhaustion. In that case, the overbought reading is weak as a reversal clue because price is not rejecting the area that created the extreme.
A cleaner reading appears when price tests above the upper area, fails to hold there, and a second attempt stalls while the oscillator starts to roll down from the extreme. The useful comparison is not whether the threshold was touched. It is whether price accepts or rejects the area that produced the reading.
Common Mistakes With Overbought and Oversold Readings
- Treating a threshold as a reversal: The indicator can show stretch without showing that the market has changed direction.
- Ignoring trend strength: Persistent trends can keep oscillators extreme for longer than expected.
- Comparing indicators as if they share one scale: RSI, stochastic, CCI, Williams %R, and Bollinger Bands use different construction logic.
- Acting before behavior changes: A threshold touch is weaker than a failed continuation attempt, rejection, or loss of acceptance.
- Using defaults without checking settings: Lookback and smoothing choices can change how often an indicator reaches an extreme.
Related Context Checks
Divergence and failure swings can sometimes help qualify an overbought or oversold reading, but they do not replace the basic threshold problem. A divergence can still fail in a strong trend. A failure swing can still be late if price has already moved far from the area where risk can be defined.
ADX, trend filters, and range structure can help separate a stretched oscillator from a trend that is still accepting price. The point is not to stack indicators until they agree. The point is to ask whether each tool is measuring a different part of the same condition or only repeating the same delayed information.
FAQ
What does overbought mean in an indicator?
Overbought means the indicator has reached an upper extreme zone based on its own scale and calculation. It describes a stretched indicator condition, not a guaranteed price reversal.
What does oversold mean in an indicator?
Oversold means the indicator has reached a lower extreme zone. It can show downside stretch, but it does not prove that price must rise.
Does overbought mean price must fall?
No. Overbought can appear during strong advances and may persist while price continues higher. The reading needs context from trend behavior, acceptance, rejection, and follow-through.
Does oversold mean price must rise?
No. Oversold can persist during strong declines. A lower extreme becomes more useful only when price behavior begins to reject further downside or fails to continue lower.
Why do different indicators show different overbought or oversold readings?
Different indicators use different inputs, scales, lookbacks, and smoothing. RSI, stochastic, CCI, Williams %R, and Bollinger Bands can therefore show different extreme readings during the same price move.