The CCI indicator, or Commodity Channel Index, is a technical-analysis oscillator that measures how far typical price has moved from its average after adjusting for mean deviation.
Definition: The Commodity Channel Index (CCI) compares current typical price with a moving average of typical price. A high positive reading shows price is extended above its recent average, while a deep negative reading shows price is extended below it.
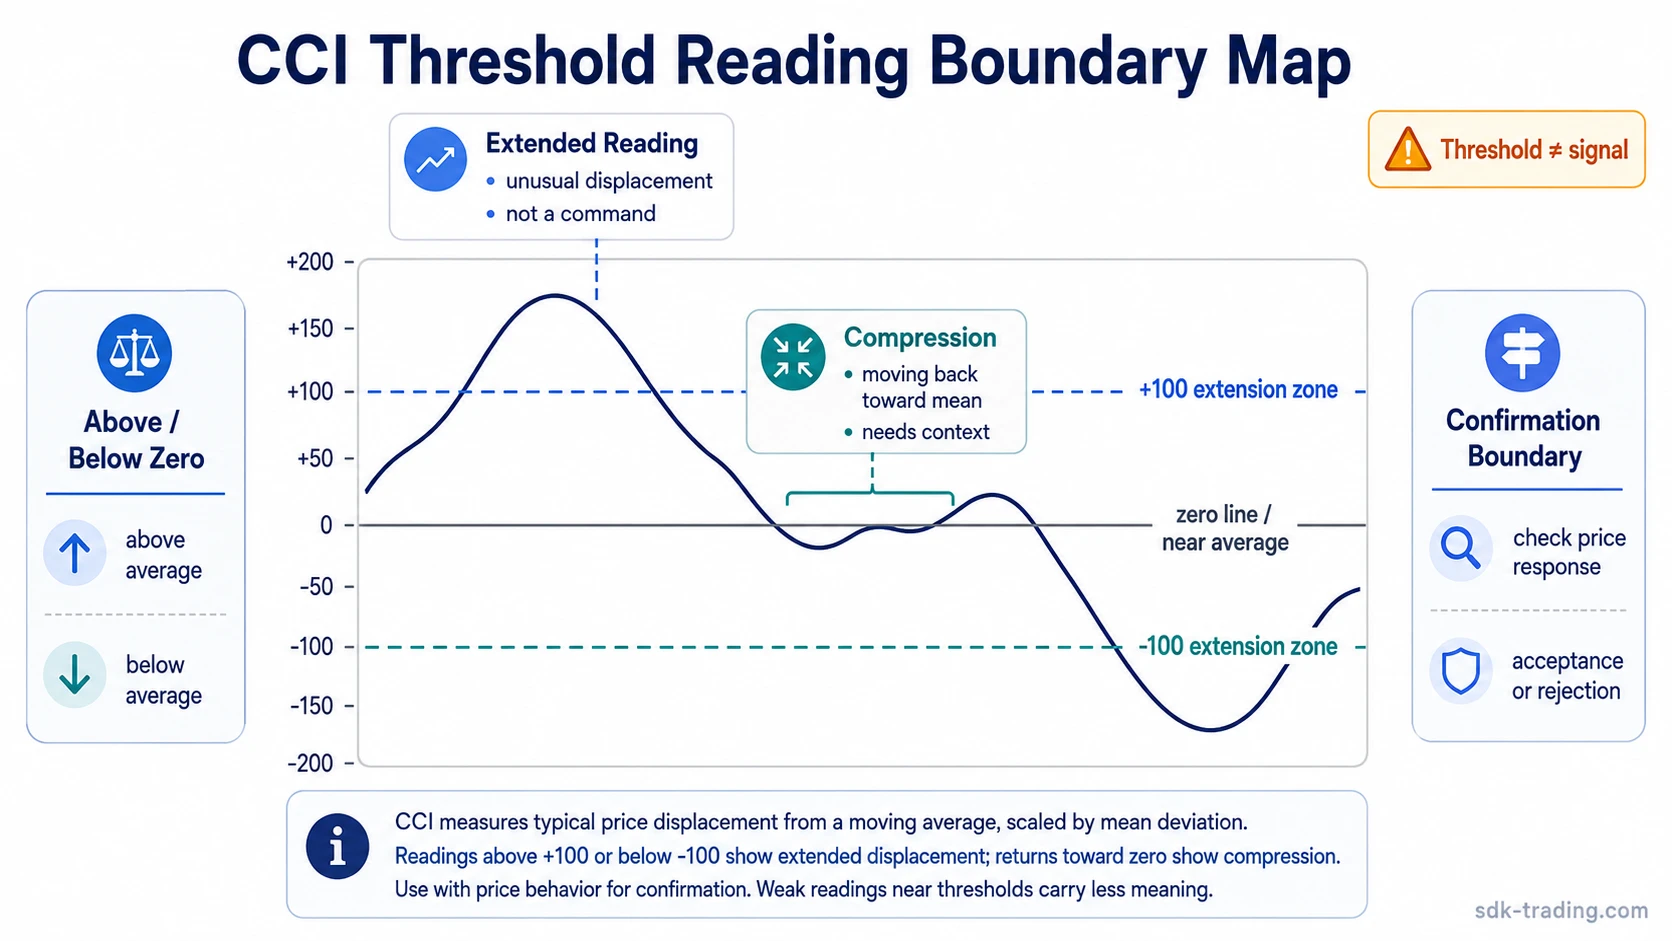
CCI readings are often watched around +100, -100, and the zero line, but those levels are reference zones rather than trade commands. An extended reading can continue, fail, compress, or reverse depending on market structure, volatility, and later price behavior.
Key Points
- The CCI indicator measures price displacement from an average using typical price, a moving average, mean deviation, and a scaling constant.
- Readings above +100 or below -100 usually show unusual displacement, not automatic reversal or continuation.
- The zero line marks the area where typical price is close to its moving average.
- CCI is unbounded, so extreme readings can expand farther than many traders expect.
- Clean, weak, and invalid CCI readings depend on market response, not the threshold alone.
What Is the CCI Indicator?
The CCI indicator is a price-based oscillator used in technical analysis to compare current typical price with a recent average. It was developed by Donald Lambert and is commonly used to identify stretched conditions, shifts around the mean, and possible changes in momentum pressure.
The important feature is the comparison method. CCI does not measure price change in the same way as a bounded momentum oscillator. It measures how far typical price sits from its moving average after scaling that distance by mean deviation.
That structure makes CCI useful for reading displacement. A high positive value means price is far above its recent average. A low negative value means price is far below its recent average. Neither condition proves that price must reverse.
How the Commodity Channel Index Formula Works
The Commodity Channel Index formula starts with typical price, then compares that value with a moving average of typical price. Mean deviation is used to scale the distance so readings can be interpreted across changing price conditions.
| Formula part | What it means | Why it matters |
|---|---|---|
| Typical Price | (High + Low + Close) / 3 | Uses the candle’s range and close instead of the close alone. |
| SMA of Typical Price | The moving average of typical price over the selected lookback. | Creates the reference center that CCI measures against. |
| Mean Deviation | The average absolute distance between typical price values and the moving average of typical price. | Scales the reading by recent variation instead of raw distance alone. |
| 0.015 constant | A scaling factor used in the standard CCI formula. | Helps place many readings near the common +100 and -100 reference zones. |
Formula: CCI = (Typical Price – SMA of Typical Price) / (0.015 x Mean Deviation)
The formula means CCI reacts not only to price direction, but also to how unusual the current price location is compared with recent variation. A volatility shock can change the denominator and make CCI comparisons less stable, especially when the lookback period is short or the market has just changed behavior.
How to Read CCI Values
CCI values are usually read relative to the zero line and the common +100 and -100 zones. The zero line represents the area where typical price is close to its moving average. Positive readings show price above that average, while negative readings show price below it.
| CCI area | Basic reading | Boundary |
|---|---|---|
| Above zero | Typical price is above its moving-average reference. | Positive does not automatically mean trend continuation. |
| Below zero | Typical price is below its moving-average reference. | Negative does not automatically mean bearish control. |
| Above +100 | Price is unusually extended away from its average. | An upside extension can persist in a strong advance. |
| Below -100 | Price is unusually extended below its average. | A downside extension can persist in a strong decline. |
| Back inside the range | Displacement is compressing toward the mean. | Compression is not confirmation unless price behavior supports it. |
CCI is unbounded. Unlike RSI, it does not stop at a fixed upper or lower limit. That matters because a reading above +100 can extend to much higher values, and a reading below -100 can continue lower when price keeps holding away from its average.
Clean, Weak, and Invalid CCI Readings
A useful CCI reading separates the oscillator value from the market behavior around it. The threshold starts the question; price structure, volatility, and follow-through decide whether the reading deserves weight.
| Reading type | What it looks like | Safer interpretation |
|---|---|---|
| Clean CCI reading | CCI reaches an extreme while price behavior also shows a clear displacement from the recent average and later response confirms that the extended condition mattered. | The CCI value and market behavior point in the same direction, so the reading has context behind it. |
| Weak CCI reading | CCI crosses +100 or -100, but price remains holding beyond the tested area and no meaningful rejection or compression appears. | The threshold marks extension, but the market has not shown that the extension is failing. |
| Invalid CCI reading | The threshold crossing is treated as a complete decision by itself, without checking trend, range behavior, volatility, or follow-through. | The oscillator has been overread. A number alone is not enough to define the market condition. |
A clean CCI reading does not require a dramatic reversal. It requires alignment between the indicator’s displacement message and the chart behavior that follows. A weak reading often appears when CCI is extended but price continues to hold the new area. An invalid reading usually appears when the threshold is interpreted as a mechanical instruction.
Common CCI Misreadings
The most common CCI mistake is treating overbought and oversold as reversal proof. A reading above +100 can mean price is extended away from its average, but a strong trend can remain extended while buyers continue pushing beyond prior reference areas. A reading below -100 can mean downside displacement, but a weak market can stay displaced for longer than expected.
Common mistake: Reading +100 as automatically bearish or -100 as automatically bullish ignores whether price is being accepted or rejected around the extended area.
Lookback length also changes interpretation. A shorter lookback can make CCI react quickly but may create more noise. A longer lookback can smooth the reading but may respond more slowly when the market changes character.
Regime matters as well. CCI can behave differently in a range, a persistent trend, or a volatility shock. The reading is more useful when the market condition matches what the oscillator is measuring: displacement from an average, not a complete trading system.
Limitation: A CCI extreme can show unusual displacement without proving reversal. Thresholds become more useful when they are compared with price acceptance, failed follow-through, compression, and the broader market condition.
CCI Compared With Nearby Oscillators
CCI is closest to other oscillators in appearance, but its calculation gives it a different job. It focuses on typical-price displacement from a mean, scaled by mean deviation.
Awesome Oscillator uses a median-price moving-average spread, so its zero-centered behavior comes from the difference between two averages rather than CCI’s distance from an average.
MFI adds a price-volume money-flow layer, while CCI remains price-based. That difference matters when volume behavior is part of the interpretation.
RSI is also commonly compared with CCI because both can be used to study extended conditions, but RSI is bounded and built around relative gains and losses. CCI is unbounded and built around typical-price deviation from a moving average.
Practical Scenario: When a CCI Extreme Is Not Enough
Price advances above a prior resistance area and CCI pushes above +100. The extended reading is noticeable, but price continues to close above the tested area and pullbacks remain shallow. In that condition, the CCI extreme shows upside displacement; it does not prove that the move has failed.
The reading deserves more caution only if price stops being accepted higher, recovery attempts weaken, or CCI compresses while price fails to extend. Without that change in behavior, the threshold remains a reference zone rather than confirmation.
The same logic applies below -100. A downside extreme can show that price is extended, but the interpretation changes if lower prices continue to be accepted instead of rejected. CCI becomes more useful when the oscillator reading and the market’s response are compared together.
FAQ
What does the CCI indicator measure?
The CCI indicator measures how far typical price is from its moving average after adjusting that distance by mean deviation. It is mainly a price-displacement oscillator.
Is CCI bounded like RSI?
No. CCI is unbounded, so readings can move far above +100 or far below -100. That makes context important when interpreting extreme values.
What do +100 and -100 mean on CCI?
+100 and -100 are common reference zones for unusual displacement above or below the recent average. They are not automatic reversal or continuation levels.
Can CCI give false signals?
CCI can create misleading readings when thresholds are treated mechanically, when volatility changes suddenly, or when price remains accepted beyond the extended area.