The MFI indicator, or Money Flow Index, is a bounded trading oscillator that uses typical price and volume to estimate positive and negative money-flow pressure. It moves between 0 and 100, with high or low readings often treated as stretched conditions, but threshold readings and divergence do not prove that price must reverse.
Definition: The Money Flow Index measures whether recent price movement is being supported by volume-weighted money flow. A rising MFI reading suggests stronger positive money flow, while a falling reading suggests stronger negative money flow.
Key Points
- MFI is a volume-weighted oscillator built from typical price and volume.
- The indicator is normalized between 0 and 100.
- Readings above 80 or below 20 describe stretched conditions, not automatic reversal points.
- Divergence can show a pressure mismatch, but price behavior still has to confirm the interpretation.
- MFI differs from RSI because MFI includes volume while RSI uses price momentum only.
What Is the MFI Indicator?
The MFI indicator is a technical analysis oscillator that compares positive and negative money flow over a lookback period, commonly 14 periods. It is sometimes described as a volume-weighted relative strength measure because it combines price change with traded volume.
The key distinction is pressure, not prediction. MFI can show when price movement is being supported by stronger volume-weighted participation, but the reading remains conditional. A high reading can persist during a strong advance, and a low reading can persist during a strong decline.
MFI is most useful when it separates three ideas: what the indicator measures, where the reading sits on the 0-100 scale, and whether later price behavior supports or contradicts the pressure reading.
How the MFI Indicator Is Calculated
MFI starts with typical price, then weights that price by volume. The calculation does not only ask whether price closed higher or lower. It asks whether the price movement carried enough volume-weighted pressure to shift the balance between positive and negative money flow.
| Calculation step | What it uses | Why it matters |
|---|---|---|
| Typical price | High, low, and close divided by three | Creates a single price point for each period instead of using the close alone. |
| Raw money flow | Typical price multiplied by volume | Connects price movement with the amount of activity behind it. |
| Positive money flow | Raw money flow when typical price rises versus the previous period | Counts volume-weighted pressure on periods with rising typical price. |
| Negative money flow | Raw money flow when typical price falls versus the previous period | Counts volume-weighted pressure on periods with falling typical price. |
| Money flow ratio | Positive money flow divided by negative money flow | Compares the balance between positive and negative pressure. |
| MFI value | 100 – (100 / (1 + money flow ratio)) | Normalizes the result into a 0-100 oscillator reading. |
When typical price is unchanged from the previous period, that period is usually not assigned to positive or negative money flow. The formula matters because it explains why MFI can behave differently from price-only oscillators: a price move on expanding volume affects the reading differently from a similar move on weak or fading volume.
How to Read MFI Thresholds
MFI threshold readings usually focus on the 80 and 20 areas. A reading above 80 is commonly treated as an overbought zone, while a reading below 20 is commonly treated as an oversold zone. These labels describe stretched pressure conditions; they do not create a complete trading conclusion by themselves.
| MFI zone | Basic reading | Safer interpretation boundary |
|---|---|---|
| Above 80 | Strong positive money flow or stretched upside pressure | Can remain elevated while price keeps holding higher levels. |
| Near 50 | More balanced positive and negative money flow | Often needs price context because the oscillator alone is less informative. |
| Below 20 | Strong negative money flow or stretched downside pressure | Can remain depressed while price keeps holding lower levels. |
| Above 90 or below 10 | More extreme pressure reading | Shows a stronger stretch, but still needs later price behavior that confirms or contradicts the reading. |
MFI Divergence and Pressure Mismatch
MFI divergence appears when price and the indicator stop confirming each other. Bearish divergence can appear when price makes a higher high while MFI makes a lower high. Bullish divergence can appear when price makes a lower low while MFI makes a higher low.
Divergence boundary: Divergence carries more weight when price rejects the new extreme or fails to hold beyond it. It carries less weight when price continues in the trend direction and MFI remains stretched without a visible behavior shift.
MFI vs RSI
MFI and RSI are both bounded oscillators, but they measure different inputs. RSI measures price momentum. MFI adds volume to the calculation, so it attempts to show whether price movement is supported by volume-weighted money flow.
That difference does not make MFI automatically better than RSI. It makes the two indicators useful for different questions. MFI focuses on price-volume pressure, while RSI focuses on price-only momentum. A deeper MFI vs RSI comparison separates the inputs, use cases, and false-reading risks more directly.
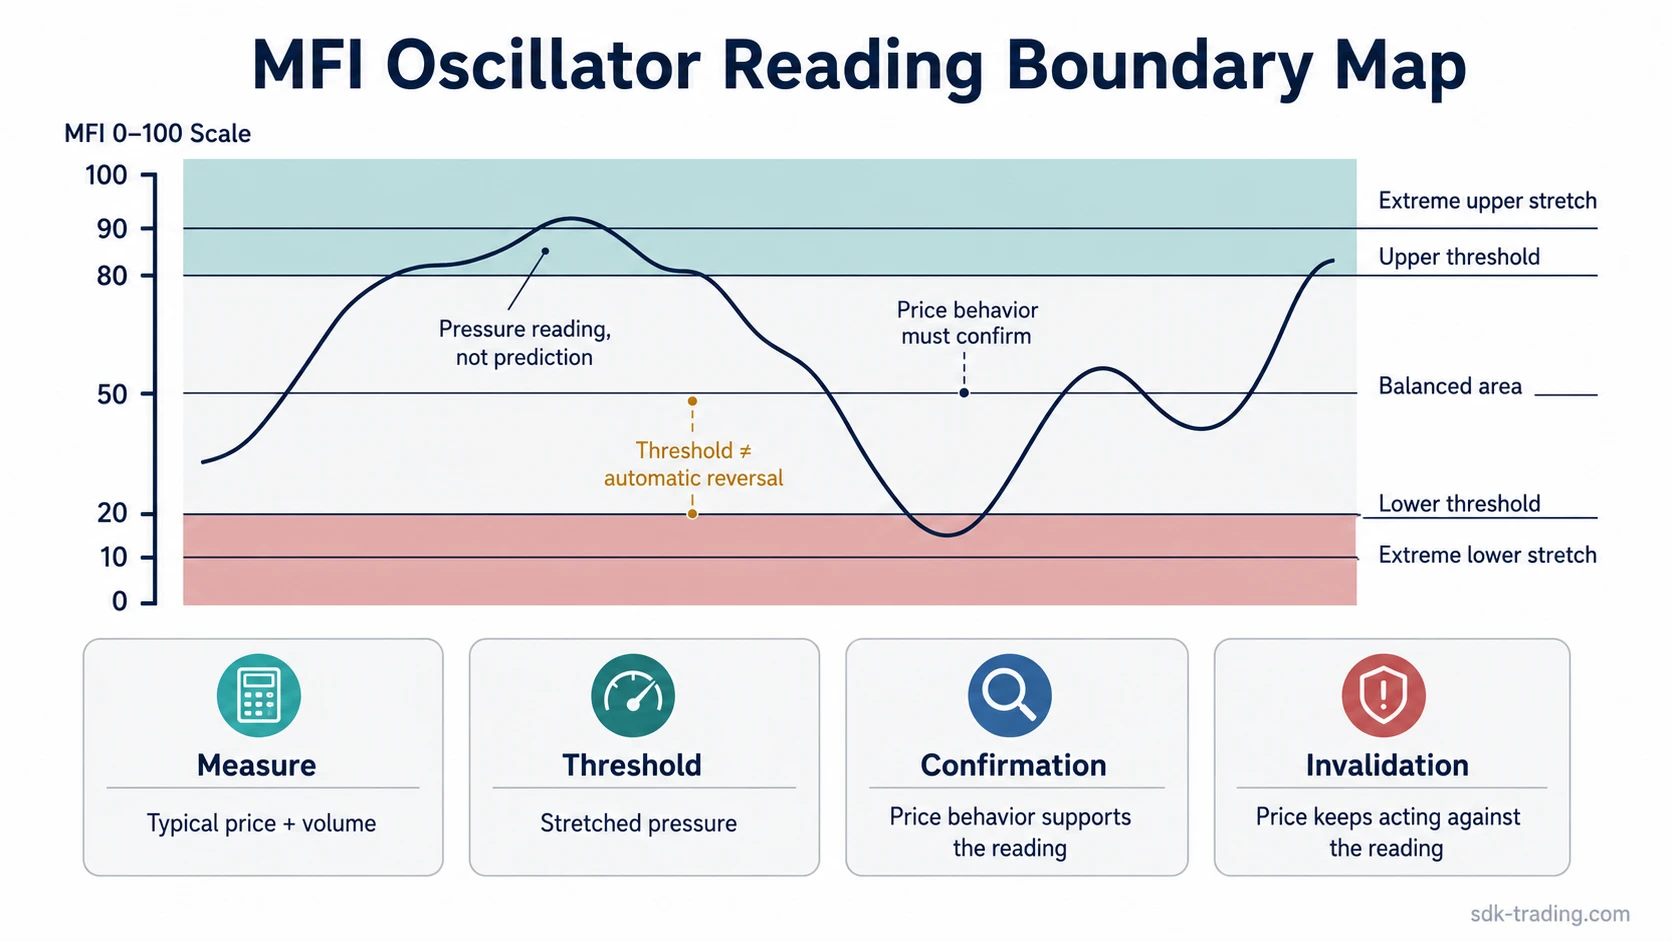
MFI Reading Boundary: Measure, Threshold, Confirmation, Invalidation
A useful MFI reading separates the oscillator value from the market conclusion. The indicator can measure pressure, but it cannot prove acceptance, rejection, or reversal without help from price behavior.
| Boundary layer | What MFI can show | What it does not prove |
|---|---|---|
| Measure | Whether positive or negative money flow is stronger over the lookback period | It does not prove future price direction. |
| Threshold | Whether the reading is stretched toward the upper or lower end of the range | It does not prove that the stretch has ended. |
| Confirmation | Whether later price behavior supports the pressure reading | It does not remove uncertainty or guarantee follow-through. |
| Invalidation | Whether price keeps acting against the oscillator interpretation | It does not rescue a reading that price action has already contradicted. |
Simple MFI threshold example: Price advances into a prior resistance area while MFI rises above 80. The high reading may show stretched upside pressure, but the interpretation remains incomplete if price continues to hold above the tested area. A reversal interpretation needs more evidence, such as failure to hold the breakout area and later recovery attempts that stall.
Clean, Weak, and Invalid MFI Readings
| Reading type | Typical condition | Interpretation limit |
|---|---|---|
| Clean reading | MFI pressure, price behavior, and later follow-through align | The reading is still conditional, but the evidence is more coherent. |
| Weak reading | MFI is extreme, but price has not rejected or reclaimed a meaningful area | The oscillator describes stretch, not reversal. |
| Invalid reading | Price keeps moving with the trend despite the MFI extreme or divergence | The oscillator warning has not translated into market behavior. |
| Unresolved reading | MFI changes direction, but price remains trapped or undecided | More context is needed before treating the reading as meaningful. |
Common MFI Mistakes
Mistake 1: Treating overbought or oversold readings as automatic reversal evidence. Thresholds describe stretched conditions, not completed turns.
Mistake 2: Reading divergence as certainty. Divergence can highlight a pressure mismatch, but it can fail when the trend keeps holding new prices.
Mistake 3: Ignoring volume quality. MFI depends on volume data, so thin, fragmented, or unreliable volume can weaken the reading.
Mistake 4: Comparing MFI to every oscillator as if they measure the same thing. MFI adds volume-weighted pressure, while nearby oscillators may focus on price displacement, momentum, or rate of change.
MFI Limitations
Volume dependency: MFI is only as useful as the volume input behind it. Centralized exchange volume, fragmented market volume, and thin trading conditions can affect how reliable the oscillator appears.
Lag and smoothing: The common 14-period lookback smooths recent activity. That can reduce noise, but it can also delay recognition when pressure changes quickly.
Trend persistence: A strong trend can keep MFI elevated or depressed. The reading should be compared with price behavior, failed holds, and later follow-through rather than treated as a standalone conclusion.
Related Oscillators
MFI belongs to the oscillator family, but its price-volume input makes it different from nearby tools. RSI focuses on price momentum, MFI adds volume-weighted pressure, the CCI indicator focuses on typical-price displacement from an average, and ROC measures the rate of price change over a selected period.
These differences matter because two oscillators can reach a similar-looking extreme for different reasons. The better reading comes from understanding what each oscillator measures before comparing thresholds or divergence.
FAQ
What does the MFI indicator measure?
The MFI indicator measures positive and negative money flow by combining typical price and volume. It shows whether recent pressure is leaning toward positive or negative money-flow pressure.
What is a common MFI overbought or oversold level?
Common MFI threshold levels are 80 for overbought conditions and 20 for oversold conditions. These levels describe stretched readings, not automatic reversal points.
How is MFI different from RSI?
MFI includes volume in its calculation, while RSI is based on price momentum. That makes MFI a price-volume oscillator and RSI a price-only momentum oscillator.
Can MFI divergence fail?
Yes. MFI divergence can fail when price continues in the trend direction despite the pressure mismatch. Divergence is more useful when later price behavior confirms rejection or failed acceptance.