MFI and RSI are both technical-analysis oscillators used to read pressure, momentum, extremes, and divergence, but they answer different questions. MFI adds volume-weighted money flow to the reading, while RSI focuses on price momentum through recent gains and losses.
The useful comparison is not which oscillator is universally better. The useful question is whether the chart question depends more on participation through volume or on price movement alone.
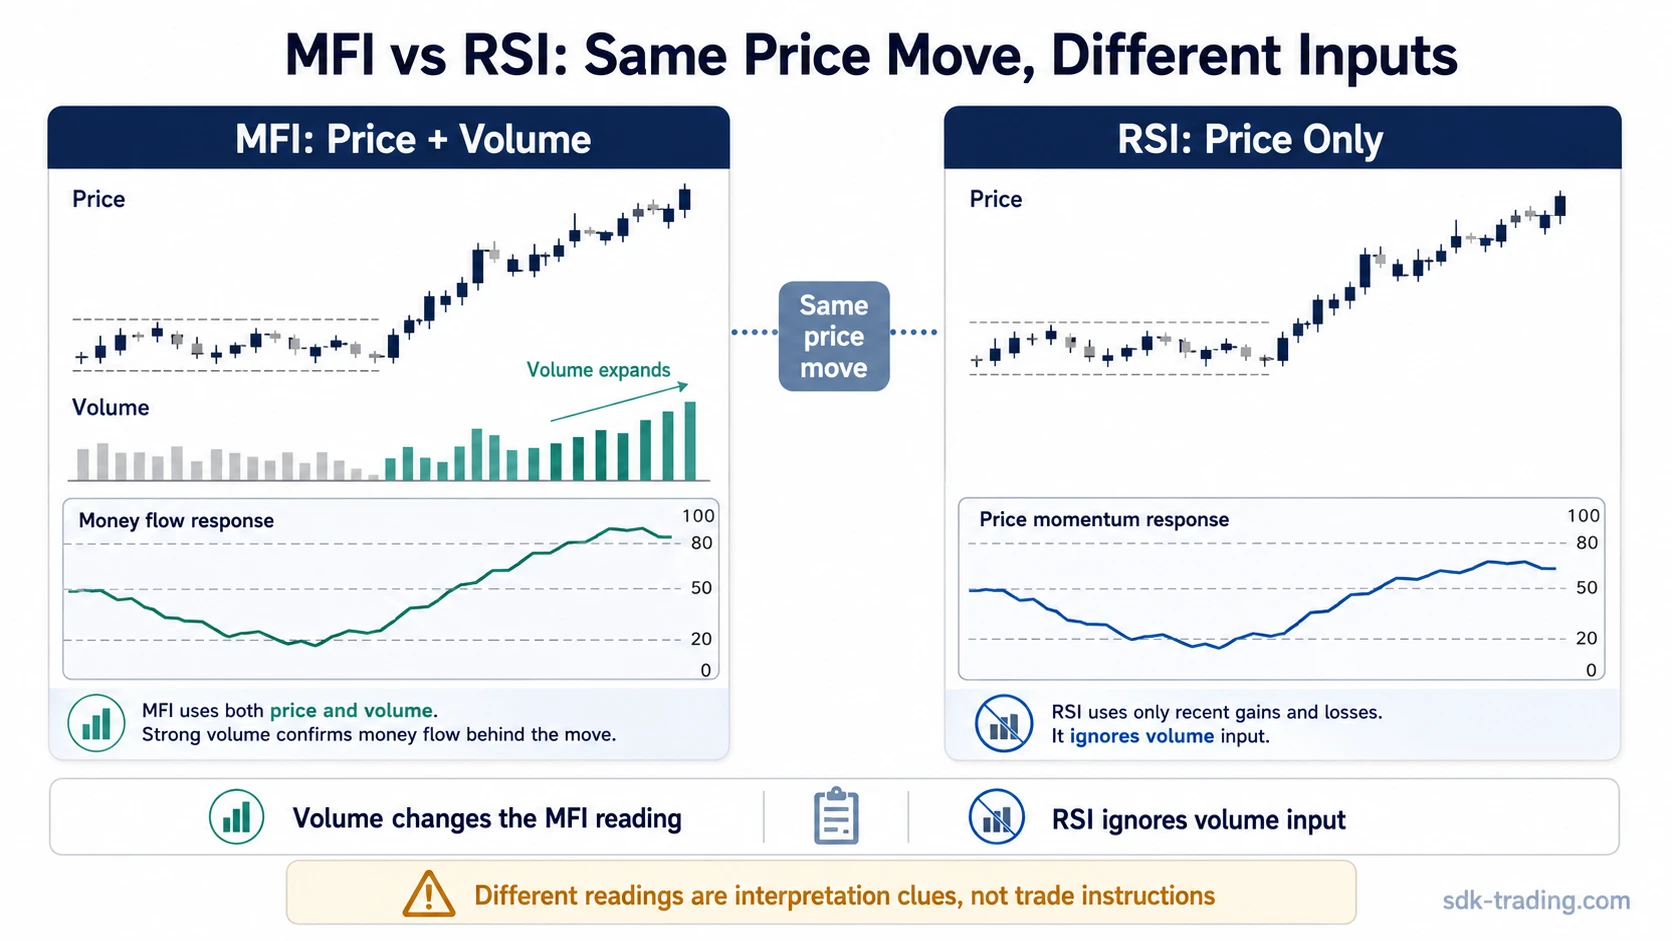
Core distinction: MFI compares buying and selling pressure through price and volume. RSI compares recent price gains and losses to judge momentum. They can rise together, diverge from each other, or give different emphasis during the same price move.
Key Points
- MFI adds volume-weighted money flow; RSI reads price momentum.
- MFI can react more when participation changes; RSI can stay more direct when price rhythm is the main question.
- Common threshold zones differ: MFI often uses 80/20, while RSI often uses 70/30.
- Divergence and extreme readings are interpretation clues, not trade instructions.
MFI vs RSI at a Glance
| Comparison point | MFI | RSI |
|---|---|---|
| Main input | Price and volume | Price only |
| Core question | Is money flow expanding or fading behind the move? | Is price momentum strengthening or weakening? |
| Common threshold zones | Often 80 for high readings and 20 for low readings | Often 70 for high readings and 30 for low readings |
| More useful when | Volume participation is central to the interpretation | Price rhythm and momentum are the main focus |
| Main weakness | Volume distortions can change the reading | Price-only momentum can miss participation changes |
MFI is most useful when volume participation is part of the question.
RSI is more direct when the main question is whether recent price momentum is expanding or fading.
The Core Difference: Volume-Weighted Flow vs Price Momentum
MFI, or Money Flow Index, combines typical price with volume to estimate whether money flow is leaning positive or negative. A higher MFI reading usually means that rising typical prices are being supported by stronger positive money flow. A lower reading usually means that negative money flow is dominating.
RSI, or Relative Strength Index, removes volume from the calculation. It compares the size of recent gains with recent losses and turns that relationship into a bounded oscillator. That makes RSI more direct for reading price momentum, especially when volume data is incomplete, uneven, or less relevant to the instrument being analyzed.
The difference matters because two charts can have the same price path but different participation behind the move. RSI may treat the move mainly as price strength. MFI may respond more sharply if the same move arrives with expanding volume and stronger positive money flow.
Same Chart, Different Reading
Example of a basic MFI vs RSI reading: Price advances from a consolidation area and closes higher for several bars. RSI rises because recent gains are larger than recent losses. MFI also rises, but the size of the MFI response depends on whether volume expands during the advance.
If volume participation increases as price rises, MFI may push higher than RSI because money flow is part of the calculation. If price advances steadily while volume stays ordinary, RSI may give the cleaner price-momentum read because the move is mostly a price-rhythm question.
The comparison becomes more useful when later candles show whether the advance is being accepted or whether follow-through stalls after the oscillator reading expands.
The same price advance can therefore produce two useful but different readings. RSI asks how strong the price momentum is. MFI asks whether the move is also being supported by stronger volume-weighted participation.
When MFI Gives the More Useful Reading
MFI usually becomes more useful when participation is central to the interpretation. That can happen when price is approaching a prior reaction area, when a breakout attempt depends on volume expansion, or when a divergence appears between price movement and money flow.
A rising price move with rising MFI can suggest that participation is expanding with the move. A rising price move with weakening MFI can suggest that the move is less supported by money flow than price alone may imply. Neither condition creates a trade decision by itself, but the contrast can sharpen the reading.
| Chart question | Why MFI may help | What still needs caution |
|---|---|---|
| Is participation expanding with price? | MFI includes volume-weighted money flow. | One volume spike can distort the short-term reading. |
| Is a price move losing sponsorship? | MFI can diverge when price rises but money flow fades. | Divergence can persist without an immediate reversal. |
| Is an extreme reading volume-supported? | MFI can separate a price-only extreme from a money-flow extreme. | Strong trends can keep high or low readings extended. |
When RSI Gives the More Direct Reading
RSI often gives the more direct reading when the main question is price momentum rather than participation. It can be easier to compare across charts because it does not depend on volume quality. That can matter when volume is fragmented, unavailable, unusually distorted, or less reliable than the price series itself.
RSI can also be useful when the focus is trend rhythm. A strong trend may keep RSI elevated or depressed for longer than expected, but the oscillator still gives a direct view of how recent gains and losses are changing. That makes it useful for comparing momentum phases without introducing a volume variable.
| Chart question | Why RSI may help | What still needs caution |
|---|---|---|
| Is price momentum accelerating? | RSI isolates recent price gains and losses. | A high reading does not automatically mean reversal risk is immediate. |
| Is momentum fading despite higher prices? | RSI divergence can reveal weakening price momentum. | Divergence can fail if trend acceptance remains strong. |
| Is volume data unreliable? | RSI avoids volume as an input. | Price-only momentum may miss participation changes. |
Divergence, Extremes, and Thresholds
MFI and RSI both use bounded oscillator scales, but their common threshold references are not identical. MFI is often discussed around 80 and 20 zones. RSI is often discussed around 70 and 30 zones. These zones describe elevated or depressed oscillator readings, not automatic reversal points.
Divergence works the same way. If price makes a higher high while RSI makes a lower high, price momentum may be fading. If price makes a higher high while MFI makes a lower high, money flow may be weakening behind the move. Both readings are conditional. The interpretation improves when later price behavior confirms failed acceptance, weakening follow-through, or a loss of participation.
False-equivalence warning: MFI is not automatically a better RSI because it includes volume. Extra input can add useful information, but it can also add noise when volume is distorted or when price momentum is the cleaner question. The stronger comparison is not “better or worse,” but “which input answers the current chart question more directly.”
Where Both Can Mislead
Both oscillators can mislead when extreme readings are treated as complete conclusions. Strong trends can keep MFI or RSI elevated for longer than expected. A low oscillator reading can also remain low while price continues to decline. The oscillator reading describes pressure or momentum, not the full market structure.
Low-quality volume can make MFI harder to read. Thin trading, fragmented venues, unusual session effects, or a single abnormal volume burst may pull the oscillator away from the broader price structure. RSI avoids that volume problem, but it also loses the participation layer that MFI is designed to capture.
A more disciplined interpretation separates oscillator information from trading decisions. MFI and RSI can support a market reading, but structure, acceptance, rejection, volatility, and later follow-through decide whether the reading remains useful or begins to weaken.
FAQ
Is MFI better than RSI?
MFI is not universally better than RSI. MFI can be more useful when volume participation is central to the reading, while RSI can be cleaner when price momentum is the main question.
Why can MFI and RSI give different readings?
MFI includes volume-weighted money flow, while RSI uses recent price gains and losses. A price move with unusual volume participation can therefore affect MFI more than RSI.
Can MFI and RSI be used together?
They can be compared as different lenses. Agreement may support the same interpretation, while disagreement can highlight a gap between price momentum and volume-weighted participation.
Do MFI 80/20 and RSI 70/30 levels mean the same thing?
No. They are common reference zones for different oscillators. They can highlight elevated or depressed readings, but they do not create trade instructions by themselves.