The Rate of Change indicator is a momentum oscillator that compares the current price with the price from a selected number of periods ago and expresses the difference as a percentage. It is often shortened to the ROC indicator, but the useful meaning comes from the calculation: current price relative to a prior lookback reference.
ROC is not a bounded 0-100 oscillator. A reading can move above or below zero without a fixed upper or lower limit, so overbought and oversold interpretation depends on the market, the lookback length, volatility, and how price behaves after the reading appears.
Key Points
- The Rate of Change indicator compares current price with price from a selected number of periods ago.
- ROC is expressed as a percentage, so it measures displacement rather than a fixed oscillator band.
- The zero line marks whether price is above or below the lookback reference.
- Overbought and oversold levels are not universal because ROC is unbounded.
- The same ROC value can mean different things under different lookbacks, volatility backgrounds, and price behavior.
What the Rate of Change Indicator Measures
Definition: The Rate of Change indicator measures percentage price displacement over a selected lookback period. It shows how far the current price is above or below the price from n periods ago, not whether a trade is complete, confirmed, or high quality.
ROC is most useful when it is treated as a measurement of displacement. A high positive reading means price is far above its lookback reference. A deep negative reading means price is far below its lookback reference.
The indicator does not explain by itself whether that displacement is accepted, rejected, extended, fading, or only a short volatility burst. That judgment requires price behavior and market context around the reading.
How the ROC Formula Works
ROC formula:
ROC = ((Current Price - Price n Periods Ago) / Price n Periods Ago) x 100
The variable n is the lookback length. A 10-period ROC compares the current price with the price 10 periods ago. A 20-period ROC compares the current price with the price 20 periods ago.
For example, if price is now 110 and the price 10 periods ago was 100, ROC is 10%. If price is now 110 and the price 20 periods ago was 108, ROC is about 1.85%. Both readings can be accurate, but they describe different lookback references.
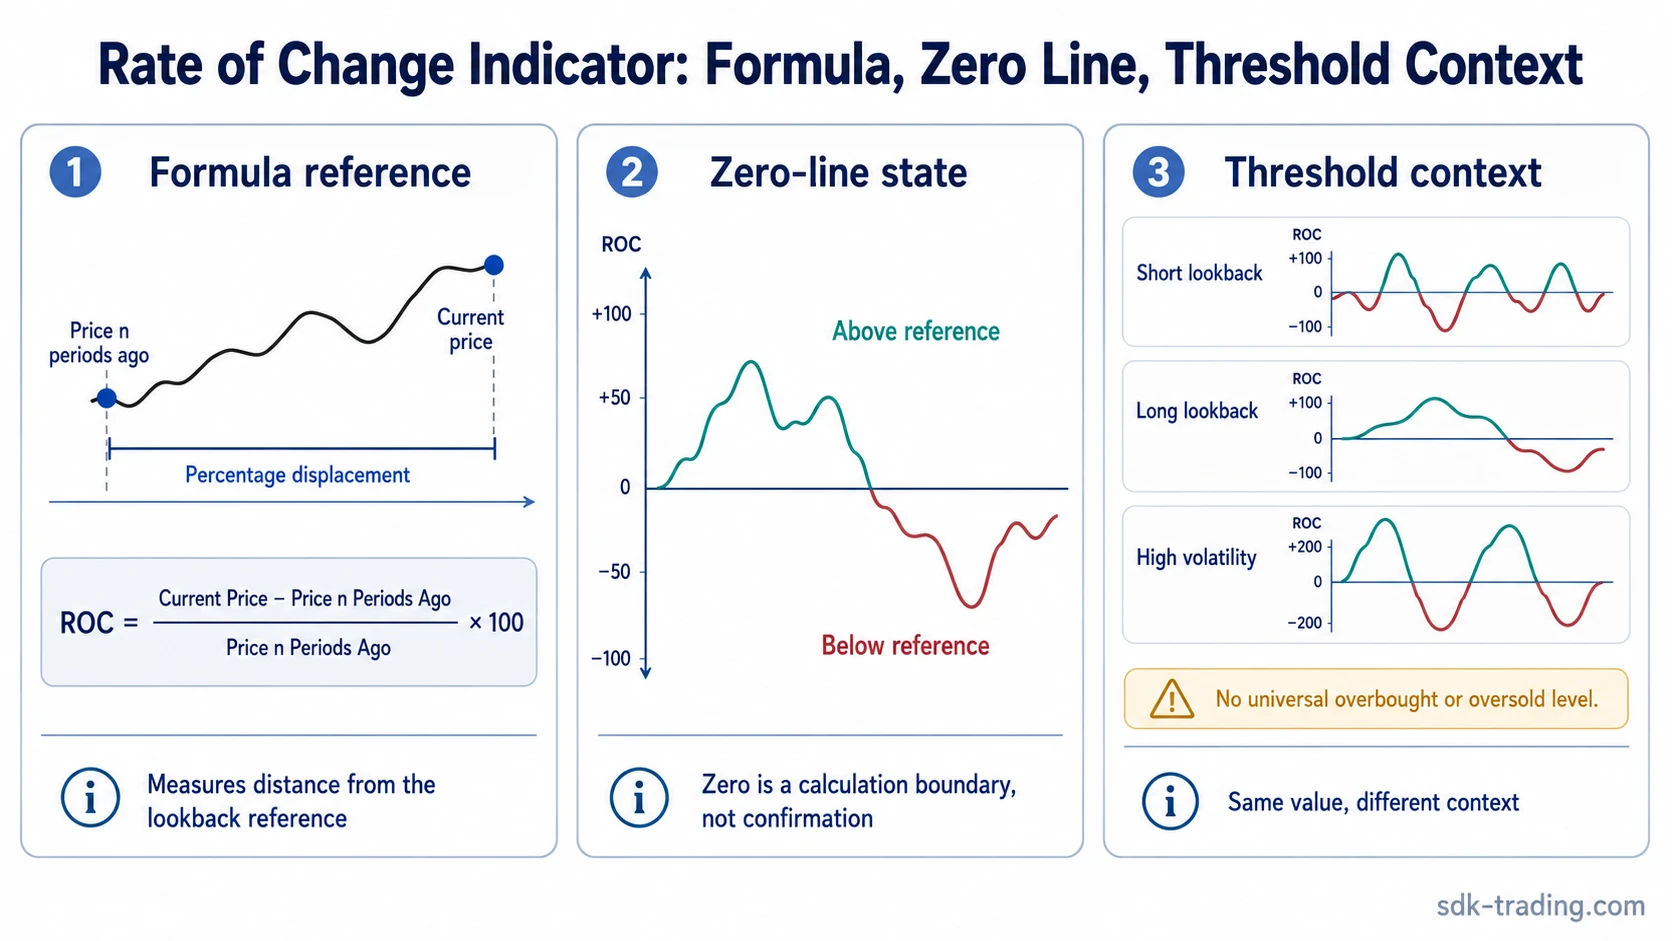
That is why ROC should not be interpreted only by its value. The reading depends on three linked inputs: current price, prior reference price, and selected period length. A short lookback reacts faster but can whipsaw more often. A longer lookback smooths some noise but may respond later to a change in pressure.
How to Read the ROC Zero Line
The ROC zero line is the point where current price equals the price from the selected lookback period. It is not a fixed support or resistance level. It is a calculation boundary.
| ROC position | What it means mechanically | What it does not prove |
|---|---|---|
| Above zero | Current price is above the price from n periods ago. | It does not prove that direction will continue. |
| Near zero | Current price is close to the lookback reference price. | It does not prove that momentum has disappeared. |
| Below zero | Current price is below the price from n periods ago. | It does not prove that price must keep declining. |
A move above zero can show that price has regained the selected lookback reference. A move below zero can show that price has lost it. The stronger question is what happens after that state appears.
Zero-line behavior can whipsaw when price is rotating around the prior reference price. In that environment, ROC may cross above and below zero without producing a stable interpretation. The cross is a state change inside the calculation, not a complete conclusion about market direction.
Why ROC Thresholds Are Not Fixed
ROC does not have a natural 0-100 range. Because the scale is unbounded, one market’s high ROC reading may be normal during a volatile expansion, while the same reading may be unusual in a slower market.
The common mistake is treating a large positive ROC reading as automatic exhaustion or a large negative ROC reading as automatic recovery potential. ROC only says that price is far from its lookback reference. It does not say whether that distance is being accepted or rejected.
| Condition | How the ROC reading can change meaning | Safer interpretation |
|---|---|---|
| Short lookback | ROC reacts quickly to recent price bursts. | Useful for sensitivity, but more exposed to whipsaw. |
| Long lookback | ROC changes more slowly because the reference point is farther back. | Useful for broader displacement, but slower to reflect a new shift. |
| High volatility | Large ROC values can appear more often. | Compare the reading with recent volatility, not a universal level. |
| Low volatility | Smaller ROC values may still stand out. | Ask whether the move is large relative to that market’s recent behavior. |
| Persistent extreme | ROC may stay elevated or depressed while price continues to accept the move. | Do not assume an extreme reading is a reversal by itself. |
Clean, Weak, and False-Positive ROC Readings
A ROC reading becomes more useful when the indicator state and the surrounding price behavior are not contradicting each other. It becomes weaker when the reading is large but price does not confirm acceptance, or when the reading comes mainly from a volatile reference-point effect.
| Reading type | ROC behavior | Price behavior to compare | Main risk |
|---|---|---|---|
| Clean ROC reading | ROC moves away from zero in a controlled way and remains consistent with the selected lookback. | Price continues to accept the move rather than immediately rotating back through the prior area. | The reading can still become stretched if volatility expands too quickly. |
| Weak ROC reading | ROC crosses or spikes, but the move is brief and quickly returns toward zero. | Price fails to hold the area that created the displacement. | The indicator may be reacting to noise rather than a durable shift. |
| False-positive ROC reading | ROC appears extreme or divergent, but the market keeps accepting the existing pressure path. | Price does not reject the move, even though the oscillator looks stretched. | Reading the extreme as a reversal condition can misclassify continuation pressure. |
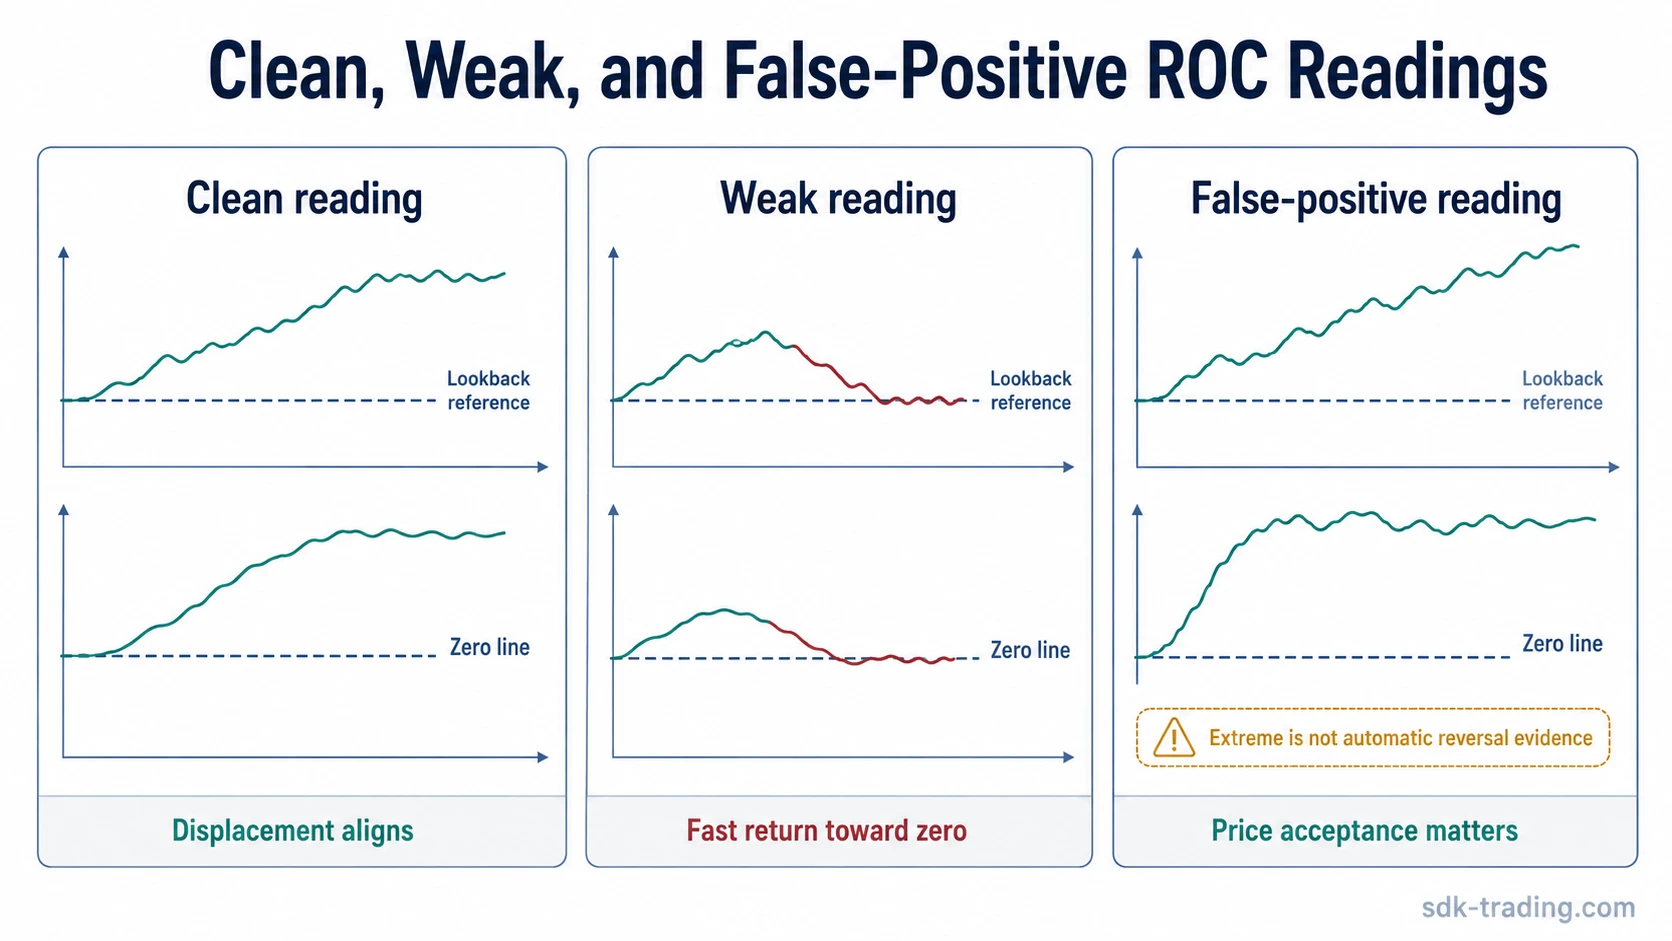
The clean, weak, and false-positive distinction is not a trading rule. It is a way to avoid asking ROC to answer more than its formula can measure. ROC can show the distance between current price and a prior reference price. It cannot show, on its own, whether the market has accepted that distance, rejected it, or only paused inside the same pressure path.
ROC vs RSI and MFI
ROC can sit near other oscillators on a chart, but its calculation is different. The distinction matters because two indicators can look similar while measuring different inputs and scales.
| Indicator | Core input | Scale behavior | Main distinction |
|---|---|---|---|
| ROC | Current price versus price n periods ago | Unbounded around a zero line | Measures percentage price displacement from a lookback reference. |
| RSI | Average gains versus average losses | Bounded 0-100 | Measures relative gain/loss pressure inside a fixed oscillator range. |
| MFI | Price and volume-based money flow | Bounded 0-100 | Adds volume sensitivity to the oscillator reading. |
This is why ROC thresholds should not be imported mechanically from bounded oscillators. RSI-style bands are tied to a 0-100 scale. ROC has no fixed ceiling or floor, so its extreme readings need to be judged against the instrument, timeframe, lookback, volatility, and price acceptance around the move.
ROC Compared With Other Momentum Oscillators
CCI, stochastic oscillator, and Awesome Oscillator can also appear in nearby momentum discussions, but they do not measure the same thing. CCI compares price against deviation from a typical price average. Stochastic compares close location inside a recent range. Awesome Oscillator compares moving-average momentum.
ROC remains narrower: current price versus a prior price, expressed as percentage change. That narrowness is useful because the calculation is transparent. It is also a limitation because ROC does not include volume, range position, trend structure, or participation quality.
Limitations of the Rate of Change Indicator
ROC can be clear mechanically and still difficult to interpret in live chart conditions. The main limitation is that the formula is simple: it compares two prices. That simplicity makes the reading transparent, but it also means the indicator can miss information that is not inside those two points.
Common limitation: ROC can show that price is far from its lookback reference, but it does not show why the move happened, whether participation is broad, whether liquidity is changing, or whether later price behavior accepts the displacement.
Whipsaw is common when price rotates around the lookback reference. In that condition, the zero line can be crossed repeatedly without a stable reading. The indicator may appear active, but the calculation is mostly reflecting price moving back and forth around the same reference area.
Divergence can also mislead. A lower ROC high while price makes a higher high can show that the rate of change has slowed. It does not prove that price must reverse. A market can keep advancing with weaker rate-of-change readings if price continues to accept higher levels.
Parameter Sensitivity and Lookback Choice
ROC changes materially when the lookback period changes. A shorter period can make the indicator more sensitive to recent movement, but it can also turn normal rotation into repeated oscillator noise. A longer period can reduce some short-term noise, but it may respond more slowly when market pressure changes.
The useful question is not which ROC setting is best in isolation. The useful question is what type of displacement the setting is meant to observe. A trader comparing short bursts may use a shorter reference. A reader studying broader momentum displacement may use a longer one. In both cases, the setting changes what the indicator is measuring.
How to Read ROC as a Measurement Tool
ROC should be read as a measurement of price displacement around a selected lookback reference. It can show whether price is stretched above or below a prior reference, whether momentum is expanding or fading, and whether the selected lookback window is showing acceleration or contraction.
A cleaner reading asks three questions:
- What is the selected lookback reference?
- Is price above, below, or near that reference?
- Is price accepting the displacement or rotating back toward the reference?
When those questions are separated, the ROC indicator stays tied to what its formula can measure. The reading can support analysis, but it does not replace confirmation, invalidation, or broader market context.
FAQ
What does the Rate of Change indicator measure?
The Rate of Change indicator measures the percentage difference between the current price and the price from a selected number of periods ago. It shows price displacement over a lookback window.
Is ROC a bounded oscillator?
No. ROC is unbounded and moves around a zero line. It does not have a fixed 0-100 range, so overbought and oversold levels are not universal.
What does the zero line mean in ROC?
The zero line means the current price is equal to the price from the selected lookback period. Above zero means current price is higher than that reference. Below zero means current price is lower.
Can ROC stay overbought or oversold?
Yes. Because ROC is unbounded, it can remain elevated or depressed while price continues to accept the move. Extreme readings should not be treated as automatic reversal evidence.
How is ROC different from RSI?
ROC compares current price with a prior price and expresses the difference as a percentage. RSI compares average gains with average losses inside a bounded 0-100 oscillator scale.