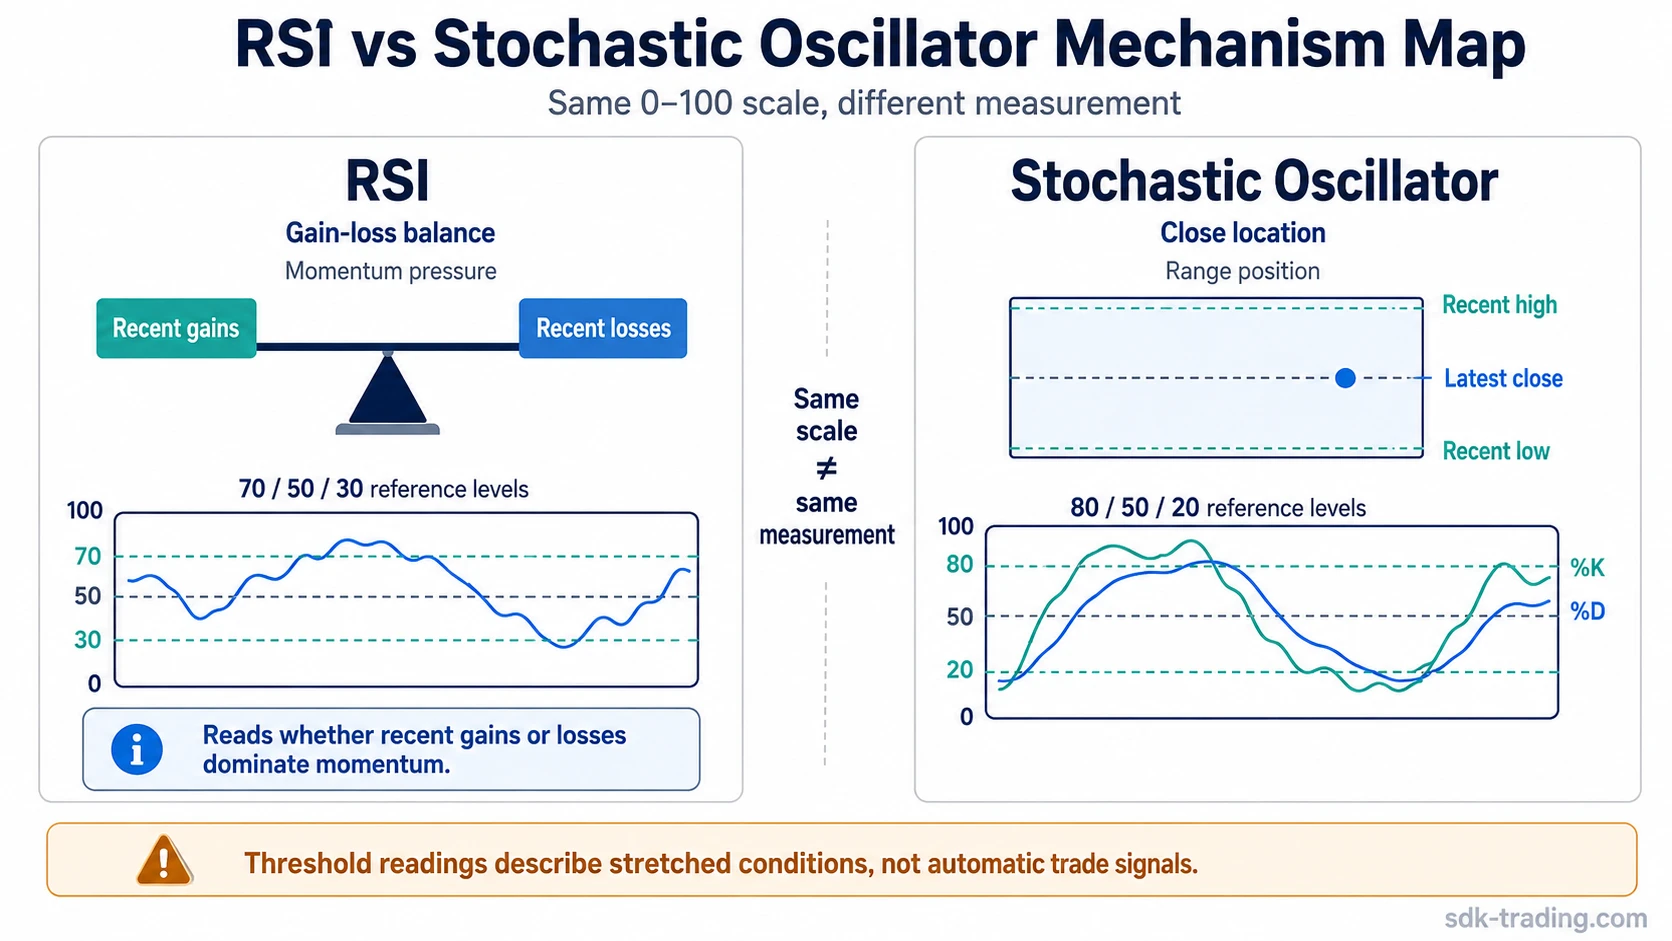
RSI and the Stochastic Oscillator can both appear as 0-100 momentum readings, but they do not measure the same pressure. RSI compares recent gains with recent losses to show momentum balance. The Stochastic Oscillator compares the latest close with the recent high-low range to show where price is closing inside that range.
Definition: RSI vs Stochastic Oscillator is a comparison between a gain-loss momentum oscillator and a close-location oscillator. RSI reads the balance of recent upward and downward movement, while the Stochastic Oscillator reads where the latest close sits inside a recent price range.
That difference changes the whole interpretation. A high RSI reading can reflect persistent upside pressure after repeated gains. A high Stochastic reading can reflect price closing near the top of its recent range. The two readings may look similar on the screen, but the reason behind each reading is different.
The common mistake is treating both indicators as interchangeable overbought and oversold tools. The same chart can make RSI look persistent while Stochastic reacts quickly to short-term range position.
Key Points
- RSI compares recent gains with recent losses to read momentum balance.
- The Stochastic Oscillator compares the latest close with a recent high-low range.
- RSI commonly uses 70 and 30 as reference levels, while Stochastic commonly uses 80 and 20.
- RSI is usually smoother; Stochastic is usually more reactive.
- Stochastic usually has %K and %D lines, while RSI is usually displayed as one oscillator line.
- Neither indicator should be treated as an automatic reversal or trading signal.
RSI vs Stochastic Oscillator: Core Difference
The main difference between RSI and the Stochastic Oscillator is the input each indicator reads. RSI is built around the relationship between recent upward and downward price movement. The Stochastic Oscillator is built around close location inside a recent price range.
That makes RSI more useful when the question is about broader momentum pressure. It makes the Stochastic Oscillator more useful when the question is about where recent closes are occurring inside a defined high-low window.
Boundary: RSI and Stochastic can both show stretched conditions, but a stretched reading is not the same thing as confirmation. The market context around the reading decides whether it carries useful weight.
RSI vs Stochastic Oscillator Comparison Table
| Comparison point | RSI | Stochastic Oscillator | Why it matters |
|---|---|---|---|
| Core measurement | Recent gains compared with recent losses. | Latest close compared with a recent high-low range. | RSI reads momentum balance, while Stochastic reads close location. |
| Main question | Are gains or losses dominating recent movement? | Is price closing near the top, middle, or bottom of its recent range? | The indicators answer different chart questions. |
| Common thresholds | 70 and 30 are common reference levels. | 80 and 20 are common reference levels. | Both threshold sets describe stretched states, not automatic decisions. |
| Display style | Usually one oscillator line. | Usually %K and %D lines. | Stochastic often looks more active because it uses a fast and slower line. |
| Sensitivity | Usually smoother. | Usually more reactive. | RSI may filter some short-term movement, while Stochastic reacts faster to close-location shifts. |
| Better lens for | Momentum persistence and pressure balance. | Short-term range rotation and close-location changes. | The cleaner choice depends on the market question. |
| Main false-signal risk | Reading a stretched value as a guaranteed reversal. | Reacting too quickly to frequent threshold movement. | Both can mislead when used without price context. |
How RSI Measures Momentum
RSI measures the balance between recent upward and downward price movement. It converts that balance into a bounded 0-100 reading, which makes it useful for judging whether momentum pressure is becoming stretched, weak, persistent, or centered.
A rising RSI reading usually means recent gains are becoming stronger relative to recent losses. A falling RSI reading usually means recent losses are becoming stronger relative to recent gains. The exact interpretation still depends on price structure and market condition.
RSI is often smoother than the Stochastic Oscillator because it is not simply asking where the close sits inside a recent range. It is reading the relationship between recent gains and losses. That smoothing can help when the trader wants to avoid reacting to every small shift in close location.
Interpretation note: RSI above an upper threshold does not automatically mean price must reverse. In a strong trend, it can show that momentum pressure remains persistent.
How the Stochastic Oscillator Measures Close Location
Stochastic Oscillator measures where the latest close sits relative to a recent high-low range. When price closes near the top of that range, the oscillator tends to move higher. When price closes near the bottom of that range, the oscillator tends to move lower.
This makes the Stochastic Oscillator more sensitive to range-position changes. It can react quickly when price starts closing away from an upper boundary or recovering from a lower boundary. That responsiveness can be useful in range-bound markets, but it can also create more noise.
The indicator is usually displayed with %K and %D lines. %K is the faster line, while %D is commonly used as a smoother comparison line. This structure gives more visual information than a single-line oscillator, but it also creates more opportunities to overread minor movement.
Interpretation note: A high Stochastic reading often means price is closing near the upper side of its recent range. It does not prove that price must reverse or that upside pressure has already failed.
Same Chart, Different Meaning
The same market can create different RSI and Stochastic messages because the indicators are measuring different things. A market can keep pushing higher, with RSI showing persistent momentum, while Stochastic begins turning lower because closes are no longer staying near the top of the recent range.
In that situation, RSI is still reading the balance of recent gains and losses. Stochastic is reading the position of the close inside the selected range. The chart is the same, but the measurement question is different.
For example, price may rise for several sessions, then begin closing slightly below the recent highs while still holding most of the move. RSI may remain firm because the gain-loss balance is still positive. Stochastic may turn down faster because the close is no longer staying at the top of the recent range.
The opposite can also happen. In a choppy range, Stochastic may rotate quickly between upper and lower zones as closes move inside the range. RSI may remain more centered because the gain-loss balance is not changing as sharply.
Thresholds: RSI 70/30 vs Stochastic 80/20
RSI commonly uses 70 and 30 as upper and lower reference areas. The Stochastic Oscillator commonly uses 80 and 20. These thresholds help describe stretched oscillator states, but they do not carry the same meaning in every market environment.
| Reading | RSI interpretation | Stochastic interpretation | What it does not confirm |
|---|---|---|---|
| Upper threshold | Recent gains are strong relative to recent losses. | Price is closing near the upper side of its recent range. | A bearish reversal by itself. |
| Lower threshold | Recent losses are strong relative to recent gains. | Price is closing near the lower side of its recent range. | A bullish reversal by itself. |
| Mid-range reading | Momentum balance is less stretched. | Close location is not near the range extreme. | A clear directional decision by itself. |
The threshold difference is not only about the numbers. RSI thresholds describe momentum stretch based on gains and losses. Stochastic thresholds describe close-location stretch inside a selected range.
Range vs Trend Behavior
Market condition changes how both oscillators should be read. In a range-bound market, Stochastic can rotate quickly as price moves from one side of the range to the other. RSI may move more slowly if the broader gain-loss balance remains mixed.
In a strong trend, both indicators can stay stretched longer than a simple overbought or oversold reading might suggest. RSI can remain elevated while momentum pressure persists. Stochastic can remain near an upper zone if price keeps closing near the top of its recent range.
Limitation: A stretched oscillator reading is a state, not a complete conclusion. The reading becomes more useful when it is checked against trend structure, range boundaries, volatility, and the behavior of price around the same area.
Which Indicator Fits Which Question?
The better choice depends on the chart question. RSI is usually better suited to broader momentum pressure. Stochastic is usually better suited to close-location behavior inside a recent range.
RSI is better suited when the main question is whether recent gains or losses are dominating the move. Stochastic is often more useful when the main question is whether price is closing near the high, middle, or low of its recent range.
| Question | Cleaner lens | Reason |
|---|---|---|
| Are gains or losses dominating recent movement? | RSI | It reads gain-loss momentum balance. |
| Where is price closing inside the recent range? | Stochastic Oscillator | It reads close location relative to the high-low window. |
| Is trend pressure persisting? | RSI often gives the cleaner first read. | Its smoother behavior can help separate broader pressure from minor rotation. |
| Is a range rotating from one side to the other? | Stochastic Oscillator often gives the cleaner first read. | Its range-position logic reacts quickly to shifting closes. |
| Is a threshold reading enough by itself? | Neither. | A stretched oscillator reading still needs price context and confirmation. |
A disciplined comparison does not ask which indicator is always better. It asks whether the current chart problem is about momentum balance, close location, trend persistence, range rotation, or confirmation quality.
Stochastic Oscillator vs Stochastic RSI
The Stochastic Oscillator and Stochastic RSI are not the same indicator. The standard Stochastic Oscillator compares the latest price close with a recent high-low price range. Stochastic RSI applies stochastic logic to RSI values instead of directly comparing the close with the price range.
That distinction matters because Stochastic RSI is a derived oscillator built from another oscillator. It can be more sensitive than standard RSI and is not the same comparison as RSI versus the standard Stochastic Oscillator.
Boundary: RSI should be compared with the standard Stochastic Oscillator as a gain-loss momentum oscillator versus a close-location oscillator. Stochastic RSI is a separate derived oscillator and should not be treated as another name for the Stochastic Oscillator.
Common Mistakes When Comparing RSI and Stochastic
The most common mistake is treating RSI and Stochastic as interchangeable because both use a bounded scale. The scale looks similar, but the calculation logic is different.
Common mistake: Reading both indicators as simple overbought and oversold signals ignores the difference between momentum balance and close-location behavior.
Another mistake is assuming that a faster indicator is automatically better. Stochastic can react faster than RSI, but that speed can also produce more false movement in noisy markets. RSI can be smoother, but that smoothness can also respond later to short-term changes.
A third mistake is ignoring market condition. In a range, Stochastic movement near range boundaries may be useful. In a strong trend, the same stretched reading may only show that price continues to close near one side of its recent range.
Limitation: Neither RSI nor Stochastic measures volume, liquidity, order flow, news, positioning, or future price direction. Both are price-based tools that need market context.
RSI vs Stochastic Oscillator: Final Distinction
RSI vs Stochastic Oscillator is not a question of which indicator is always better. RSI reads momentum balance through recent gains and losses. Stochastic reads close location inside a recent high-low range.
The cleaner choice depends on the question being asked. Use RSI when the focus is broader momentum pressure. Use Stochastic when the focus is closing behavior inside a recent range. Use neither as a standalone trading decision.
FAQ
What is the main difference between RSI and Stochastic Oscillator?
RSI compares recent gains with recent losses to show momentum balance. The Stochastic Oscillator compares the latest close with a recent high-low range to show close location inside that range.
Is Stochastic faster than RSI?
Stochastic is usually more reactive than RSI because it focuses on close location inside a recent range. That can make it useful in range rotation, but it can also create more noise.
Is RSI better than Stochastic Oscillator?
RSI is not universally better than Stochastic, and Stochastic is not universally better than RSI. RSI is usually better for broader momentum pressure, while Stochastic is usually better for close-location behavior inside a recent range.
Can RSI and Stochastic give different signals?
Yes. RSI and Stochastic can differ because RSI reads gain-loss momentum balance, while Stochastic reads where price closes inside a recent high-low range. The same chart can therefore produce different oscillator behavior.
Is Stochastic RSI the same as the Stochastic Oscillator?
No. The standard Stochastic Oscillator compares the latest close with a recent price range. Stochastic RSI applies stochastic logic to RSI values, so it is a separate derived oscillator.