An RSI strategy is a conditional framework for reading Relative Strength Index behavior inside price structure, trend context, confirmation quality, and invalidation. It should not treat an overbought reading, an oversold reading, or a divergence reading as an automatic trading decision.
Definition: An RSI strategy uses RSI readings as momentum conditions, then checks whether market environment, price behavior, and confirmation support or reject the interpretation.
The RSI measures the speed and magnitude of recent price changes on a bounded 0-100 scale. In a strategy framework, that reading is only the first condition. The next question is whether price behavior confirms, weakens, or contradicts the RSI state.
A useful RSI strategy separates four things: the RSI condition, the market environment, the price response, and the failure point. Without those layers, the same RSI reading can be interpreted too aggressively. A reading above an upper threshold can appear during exhaustion, but it can also appear during strong trend persistence. A reading below a lower threshold can appear near a range low, but it can also appear while downside pressure is still being accepted.
Key Points
- RSI strategy is a framework for interpreting momentum conditions, not a fixed signal rule.
- RSI threshold readings change meaning in ranges, trends, transitions, and noisy conditions.
- Overbought and oversold readings need price-structure confirmation before they carry strong weight.
- RSI divergence can support a scenario, but it does not prove that a reversal has started.
- False-positive RSI readings become more likely when price accepts continuation while RSI stays extreme.
- Risk boundaries should come from the scenario and price structure, not from a fixed RSI number alone.
What Is an RSI Strategy?
An RSI strategy is a structured way to interpret RSI readings in context. It usually starts with a momentum condition, such as RSI reaching an upper threshold, falling into a lower threshold, crossing the midpoint, diverging from price, or shifting into a different operating range.
The strategy part begins after the reading appears. A trader still has to ask whether the market is ranging, trending, transitioning, or producing noise. The same RSI value can mean different things in each environment.
For example, RSI above 70 during a range can show that upside momentum is stretched near the upper side of the range. RSI above 70 during a persistent uptrend can show that upside momentum remains strong. The number is similar, but the interpretation is different because price behavior is different.
Boundary: RSI can describe momentum pressure, but it cannot confirm a full market decision by itself. The reading needs price behavior, context, and failure conditions around it.
How an RSI Strategy Reads Market Context
The first context question is whether price is rotating, trending, transitioning, or moving without clean structure. RSI behaves differently in each environment.
| Market context | How RSI often behaves | Safer interpretation |
|---|---|---|
| Range-bound market | RSI may rotate between upper and lower reference zones as price moves between range boundaries. | Threshold readings carry more context when they align with price reaction near range support or resistance. |
| Strong uptrend | RSI can remain elevated and hold above the midpoint during pullbacks. | An overbought reading may describe trend strength rather than immediate exhaustion. |
| Strong downtrend | RSI can remain depressed and fail near the midpoint during bounces. | An oversold reading may describe persistent downside pressure rather than immediate recovery. |
| Transition phase | RSI may begin disagreeing with price while the prior move loses quality. | The reading matters more if price later confirms a change in acceptance or rejection behavior. |
| Choppy market | RSI may cross back and forth around 50 without a clean threshold sequence. | The oscillator may be describing noise rather than a useful momentum condition. |
In a range, an RSI stretch near a price boundary can be useful because the oscillator and structure are testing the same idea. In a strong trend, the same stretch can persist. The difference is not the RSI number alone; it is whether price accepts or rejects the area while RSI is stretched.
RSI Strategy Scenario Tree
The scenario tree is the core of the framework. It prevents the RSI reading from becoming a standalone conclusion.
| Scenario label | Question to ask | Safer interpretation |
|---|---|---|
| Primary scenario | Is RSI stretched, recovering, diverging, crossing 50, or shifting range while price begins to support the same read? | Treat the reading as a working scenario only when market environment and price behavior support it. |
| Alternative scenario | Is price accepting continuation while RSI remains stretched or elevated? | The same RSI state may describe trend persistence instead of exhaustion. |
| Failed / invalidated scenario | What would make the RSI interpretation wrong? | A failed reading appears when the expected price response never develops or price contradicts the oscillator state. |
| Risk boundary | Where does the scenario stop making sense conceptually? | Risk belongs to the structure and scenario, not to RSI alone. |
| No clear read | Are RSI, price behavior, and market environment giving mixed information? | The safer interpretation is incomplete evidence rather than forced confirmation. |
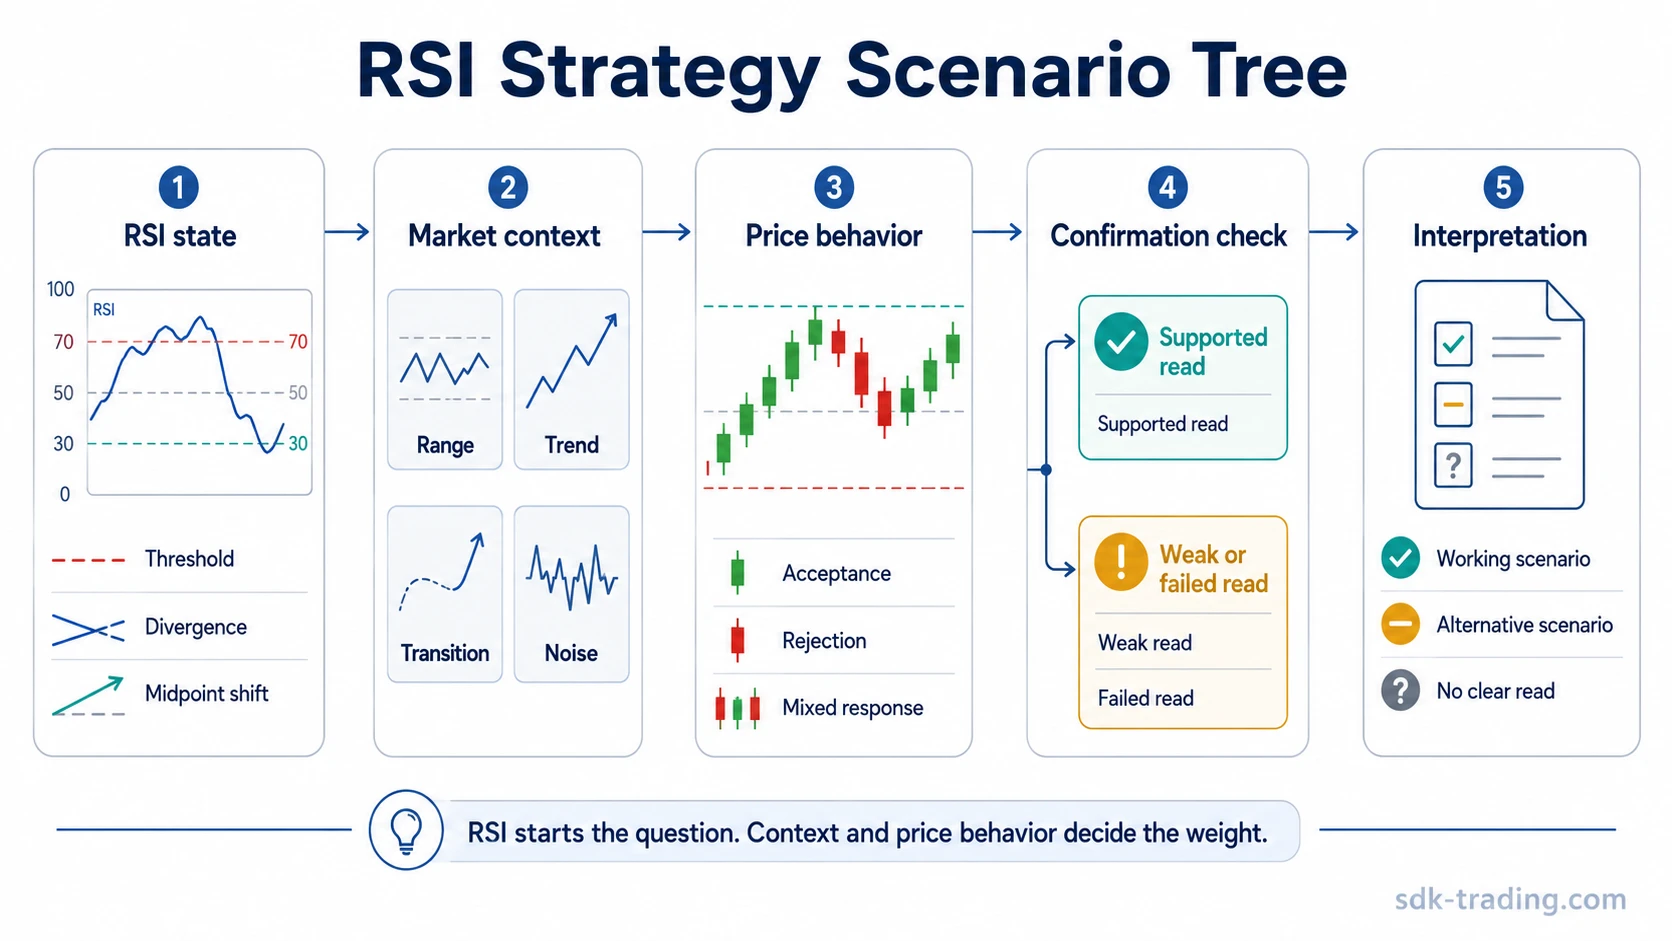
A primary RSI scenario might begin when RSI reaches an upper threshold while price is near a prior resistance area and begins to lose follow-through. That does not mean reversal is confirmed. It only creates a possible weakening scenario.
An alternative scenario appears if price accepts higher levels while RSI remains elevated. In that case, the high RSI reading may reflect trend persistence rather than exhaustion.
The failed scenario appears when the expected price response never develops. If price continues to accept direction while RSI stays stretched, the threshold reading has not produced useful rejection evidence.
A no-clear-read outcome is valid when the RSI condition is visible but price behavior remains mixed. In that case, the framework should preserve uncertainty instead of forcing a bullish or bearish label.
Clean, Weak, and False-Positive RSI Readings
A useful RSI reading separates the oscillator state from the market response. The number starts the question; price structure, trend context, and follow-through decide whether the reading deserves weight.
| Reading type | RSI behavior | Price behavior | Safer interpretation |
|---|---|---|---|
| Clean RSI reading | RSI reaches a meaningful threshold, divergence, or range shift. | Price confirms with rejection, failed continuation, reclaim, breakdown, or structural shift. | The oscillator supports the broader read, but it still does not act alone. |
| Weak RSI reading | RSI reaches a notable state. | Price response is mixed, delayed, or unclear. | The reading needs more evidence before it deserves strong weight. |
| False-positive RSI reading | RSI appears stretched or divergent. | Price accepts continuation anyway. | The RSI reading failed to describe the stronger market force. |
| Noisy RSI reading | RSI crosses repeatedly around 50. | Price remains choppy and structure does not clarify direction. | Momentum is unclear and the oscillator may be reflecting noise. |
| Late RSI reading | RSI confirms after the main price move has already occurred. | Price has already extended before the reading becomes obvious. | The oscillator may be lagging rather than leading. |
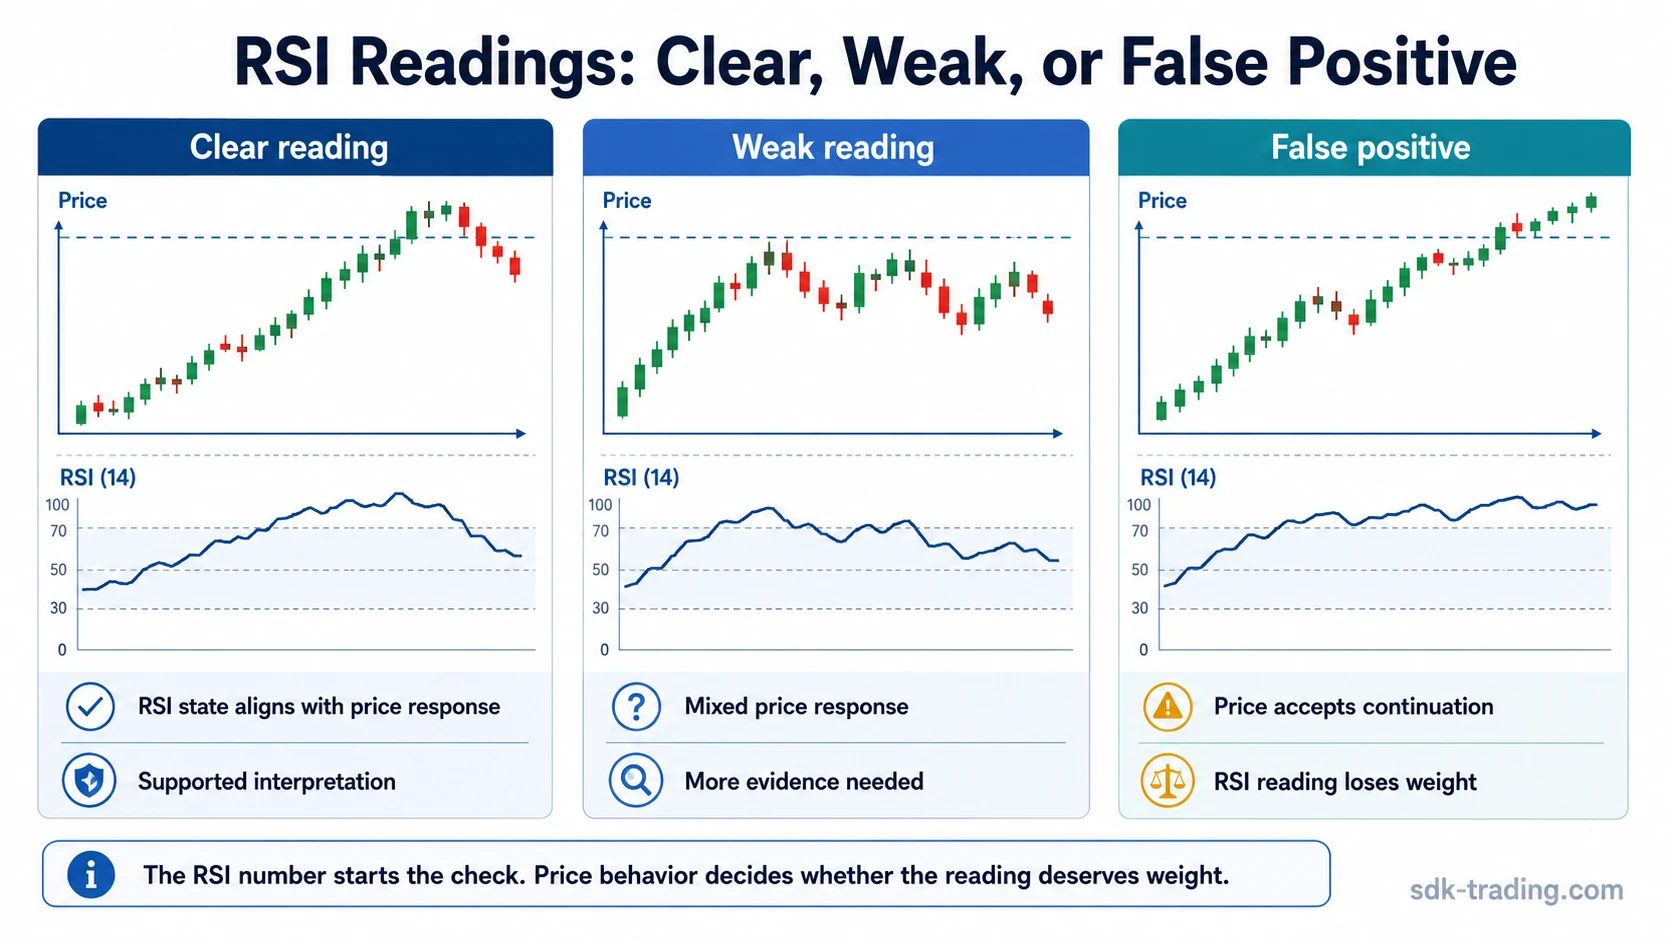
Clean RSI readings usually have alignment. A bullish interpretation is stronger when downside momentum weakens, price stops accepting lower levels, and RSI begins reclaiming important internal levels. A bearish interpretation is stronger when upside momentum weakens, price stops accepting higher levels, and RSI begins breaking its own sequence.
Using RSI Thresholds Without Treating Them as Signals
RSI thresholds are states inside the indicator, not trading commands. The common 70 and 30 reference areas can help describe stretched momentum, but they do not carry the same meaning in every market condition.
| RSI observation | What it can show | What it does not confirm | What strengthens the reading | What weakens it |
|---|---|---|---|---|
| RSI moves above 70 | Upside momentum is stretched or strong. | A bearish reversal. | Price rejection, failed continuation, bearish divergence, or loss of structure near a relevant area. | Price keeps accepting higher levels while RSI remains elevated. |
| RSI drops below 30 | Downside momentum is stretched or strong. | A bullish reversal. | Price rejection of lower levels, bullish divergence, reclaim, or structural improvement. | Price keeps accepting lower levels while RSI remains depressed. |
| RSI crosses above 50 | Momentum may be shifting toward the upside. | A complete bullish scenario. | Price holds structure and pullbacks stop accepting lower levels. | Price fails to hold above prior structure or RSI quickly loses 50 again. |
| RSI crosses below 50 | Momentum may be shifting toward the downside. | A complete bearish scenario. | Price fails to reclaim prior structure and rallies lose quality. | Price quickly reclaims structure or RSI whipsaws around the midpoint. |
Threshold readings become more useful when they appear at a meaningful price location. A stretched RSI reading in the middle of a noisy range is weaker than the same reading near a tested boundary, failed breakout area, or prior reaction zone.
RSI Divergence in a Strategy Framework
RSI divergence appears when price and RSI stop moving in the same way. Bullish divergence can appear when price makes a lower low while RSI makes a higher low. Bearish divergence can appear when price makes a higher high while RSI makes a lower high.
Divergence can be useful because it shows a possible loss of momentum quality. It is still not enough by itself. Price can keep extending after divergence appears, especially in strong trends.
| Divergence condition | Possible message | Needed context | Common failure mode |
|---|---|---|---|
| Bullish divergence | Downside momentum may be weakening. | Price rejects lower levels, reclaims structure, or stops accepting continuation. | Price keeps accepting lower levels despite the divergence. |
| Bearish divergence | Upside momentum may be weakening. | Price rejects higher levels, loses structure, or fails to continue. | Price keeps accepting higher levels despite the divergence. |
| Hidden divergence | Momentum may support continuation within an existing trend. | The trend structure remains intact and price behavior supports continuation. | The trend structure breaks before the divergence becomes useful. |
Divergence is strongest when it agrees with location and later price behavior. It is weaker when it appears in isolation or when price keeps accepting the direction that divergence was supposed to question.
RSI Strategy and Confirmation
Confirmation does not mean that a trade outcome is known. It means the market is beginning to support the interpretation that RSI suggested.
Confirmation can come from price rejecting a level, reclaiming a lost area, failing to continue, breaking a local structure, or accepting a new range. The exact form depends on the scenario. The key point is that the evidence must come from price behavior, not from repeating the RSI reading in different words.
Confirmation rule: A stronger RSI strategy waits for the oscillator state, the market environment, and the price response to point toward the same interpretation.
Risk Boundaries in an RSI Strategy
RSI does not define risk by itself. A risk boundary should come from the scenario that the trader is testing. If the interpretation is based on price rejecting a higher area, the boundary is tied to whether that rejection remains valid. If the interpretation is based on price reclaiming structure, the boundary is tied to whether that reclaim holds.
This distinction matters because an RSI number can remain stretched longer than expected. A fixed RSI threshold does not tell where the market has invalidated a scenario. The invalidation point belongs to price structure, acceptance, rejection, and the broader context.
Limitation: An RSI reading can support a scenario, but it should not replace the scenario. When RSI and price behavior disagree, the disagreement is information, not a reason to force the original read.
How RSI Fits With Other Oscillators
RSI is one oscillator lens. It is often compared with Stochastic RSI, which applies a stochastic calculation to RSI itself and can become more sensitive to short-term changes.
CCI reads price deviation from a statistical average rather than using the same bounded RSI construction.
MFI adds volume into a money-flow style oscillator, which changes how pressure is interpreted.
ROC measures percentage change from a prior price reference and is not bounded the same way RSI is.
These differences matter because a strategy should not treat every oscillator output as the same kind of signal. RSI has its own scale, smoothing, and threshold behavior. Other oscillators can confirm, challenge, or complicate the interpretation, but they should not be blended mechanically.
Common RSI Strategy Mistakes
| Mistake | Why it is risky | Cleaner approach |
|---|---|---|
| Treating overbought as automatic bearish evidence | Strong trends can keep RSI elevated for long periods. | Check whether price rejects or accepts higher levels. |
| Treating oversold as automatic bullish evidence | Downtrends can keep RSI depressed while downside pressure continues. | Look for rejection of lower levels, reclaim, or weakening downside acceptance. |
| Using divergence without price confirmation | Divergence can appear early and remain unresolved. | Wait for price behavior to support the divergence scenario. |
| Ignoring market environment | The same RSI value behaves differently in ranges, trends, transitions, and noise. | Classify context before weighting the RSI reading. |
| Forcing a scenario when evidence is mixed | Mixed information can lead to overreading a weak oscillator state. | Allow a no-clear-read outcome when RSI and price behavior do not align. |
When an RSI Strategy Becomes Less Useful
An RSI strategy becomes less useful when the market produces repeated whipsaws, when price structure is unclear, or when the indicator reading is being used to override stronger price evidence.
It also becomes weaker when the trader treats the same threshold number as equally meaningful in every environment. RSI above 70 near a range boundary, RSI above 70 during a strong trend, and RSI above 70 after a late acceleration are not the same condition.
The strategy remains more disciplined when RSI is treated as one input inside a broader interpretation process. The oscillator starts the question; market context and price behavior decide whether the answer is strong, weak, false-positive, or unclear.
FAQ
What is an RSI strategy?
An RSI strategy is a framework for interpreting Relative Strength Index readings with market context, price behavior, confirmation, and invalidation. It does not treat RSI as a standalone trading signal.
Is RSI overbought a sell signal?
No. An overbought RSI reading can show stretched upside momentum, but in a strong trend it may also show persistence. Price behavior and market context decide whether the reading carries bearish weight.
Is RSI oversold a buy signal?
No. An oversold RSI reading can show stretched downside momentum, but it does not confirm recovery by itself. It needs evidence such as rejection of lower prices, reclaim, or weakening downside acceptance.
How reliable is RSI divergence?
RSI divergence can support a scenario when price later confirms the loss of momentum quality. It is weaker when price keeps accepting continuation in the same direction.
What makes an RSI reading false positive?
An RSI reading becomes false positive when the oscillator appears stretched, divergent, or supportive, but price behavior continues in the opposite way and contradicts the expected interpretation.