CCI vs RSI compares two trading oscillators that can react to the same price move but answer different questions. RSI reads the balance between average gains and losses inside a bounded 0-100 scale. CCI reads how far typical price has moved away from a moving average of typical price.
Core distinction: RSI is mainly a strength-balance oscillator, while CCI is mainly a deviation oscillator. The confusion comes from the fact that both use reference zones, yet those zones do not measure the same thing.
Key Points
- RSI is bounded from 0 to 100, while CCI is centered around zero and can expand beyond its common reference zones.
- RSI compares average gains with average losses; CCI compares typical price with a moving average baseline.
- RSI 70/30 and CCI +100/-100 are reference zones, not automatic reversal points.
- The useful lens depends on the question: internal strength balance or price deviation from a baseline.
CCI vs RSI: The Core Difference
RSI and CCI often appear in the same chart area, but they do not describe the same market condition. RSI compresses recent upward and downward price movement into a bounded strength reading. CCI measures whether typical price is stretched above or below its average baseline.
A high RSI reading says that recent gains have been strong relative to recent losses. A high CCI reading says that price is extended above its typical-price average. Those can happen together, but they can also separate when price behavior changes.
The full mechanics of RSI matter most when the question is whether recent internal strength is improving, weakening, or staying balanced inside its range.
CCI vs RSI Comparison Table
| Criterion | RSI lens | CCI lens | Why it matters |
|---|---|---|---|
| Core reading | Are average gains stronger or weaker than average losses? | Is typical price stretched away from its average baseline? | The same price move can show strength balance in one tool and deviation in the other. |
| Scale | Bounded from 0 to 100 | Centered around zero and not bounded like RSI | RSI extremes are compressed, while CCI can keep expanding when deviation grows. |
| Common reference zones | 70 and 30, with 50 often used as a midpoint reference | +100 and -100, with zero as the center reference | The numbers look similar in purpose, but they are not measuring the same condition. |
| Most useful diagnostic use | Reading whether recent directional pressure is gaining or losing internal balance | Reading whether price is stretched relative to its recent average behavior | Choosing the wrong lens can make normal extension look like trend weakness or make fading strength look like healthy deviation. |
| Common misread | Treating a high RSI reading as an automatic reversal warning | Treating a move above +100 as an automatic exhaustion reading | Reference zones describe conditions. Price structure and later acceptance still shape interpretation. |
How RSI Reads the Market
RSI converts recent average gains and average losses into a bounded oscillator. The 0-100 range makes it easier to compare readings across charts, because RSI cannot keep expanding indefinitely.
The 70 and 30 zones are common references for stretched upside or downside conditions, while the 50 area is often used as a midpoint between stronger and weaker internal balance. These references do not prove that price must reverse. They describe how recent upward and downward pressure has behaved inside the RSI calculation window.
RSI is often cleaner when the chart question is whether internal strength is improving, fading, or holding near a balanced midpoint. It is less useful when the main issue is how far price has stretched from its average path.
How CCI Reads the Market
CCI measures how far typical price is from an average-price baseline. Instead of compressing the reading into a fixed 0-100 range, CCI moves around a zero line and can extend beyond common positive or negative reference levels.
More precisely, CCI compares typical price with a moving average of typical price and normalizes that distance by mean deviation, which is why the reading can expand beyond its common reference zones.
The +100 and -100 levels are widely used as reference zones, but they are not hard boundaries. A strong deviation can push CCI far beyond those areas, especially when price moves sharply away from its recent average.
The full mechanics of CCI matter most when the question is whether price is stretched, normalized, or returning toward its average behavior.
Same Chart, Different Meaning
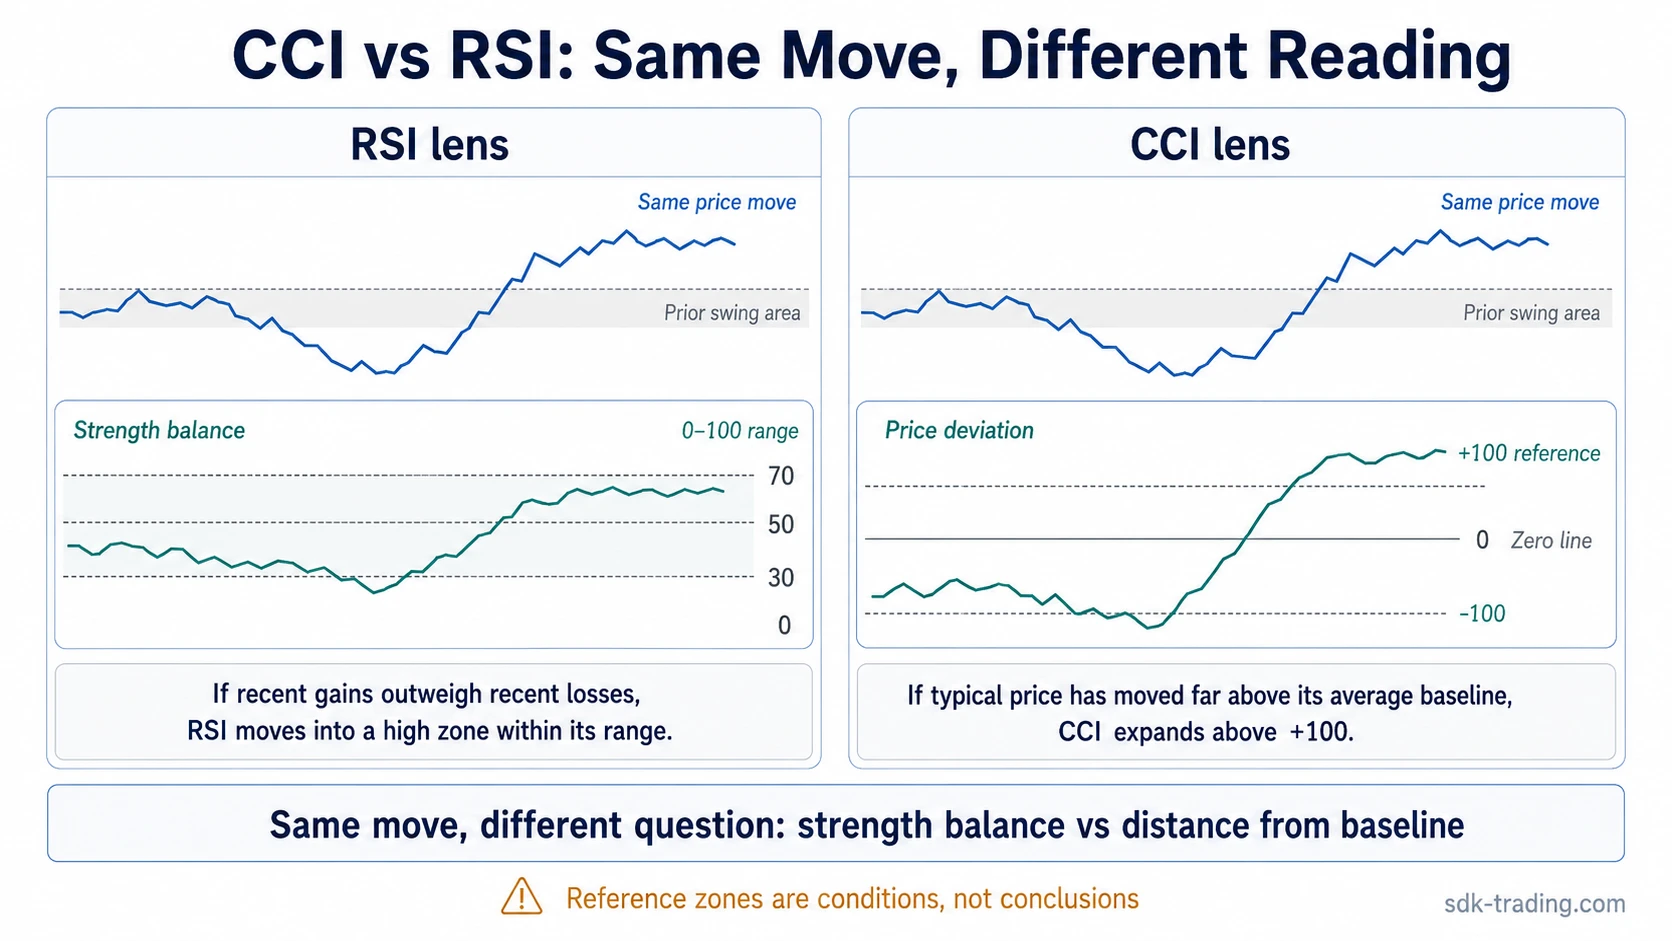
Price advances above a prior swing area and keeps pressing higher for several candles. RSI moves into a high zone because recent gains outweigh recent losses. CCI also rises, but its reading expands because typical price has moved far above its average baseline.
The RSI reading describes internal strength balance. The CCI reading describes distance from the baseline. If price holds above the prior swing area and RSI remains firm, the chart is showing strength persistence more clearly than immediate exhaustion. If price fails to accept the higher area while CCI spikes and then contracts, the same move looks more like temporary extension than clean continuation.
The useful distinction is not which oscillator is right. The distinction is whether the chart question is about strength balance, price deviation, or a mismatch between the two.
Which Lens Fits Which Question?
| Chart question | Primary lens | Reason | Misread risk |
|---|---|---|---|
| Is recent upside pressure stronger than recent downside pressure? | RSI | RSI directly compares average gains and losses. | A high reading can persist during strong trends. |
| Is price stretched away from its recent average path? | CCI | CCI is built around deviation from a typical-price baseline. | A move beyond +100 or -100 can reflect extension, not an immediate turning point. |
| Are both indicators extreme at the same time? | Compare both | RSI may describe strength while CCI describes stretch. | Interpreting both as the same overbought or oversold message removes the difference between balance and deviation. |
| Is the reading isolated from price structure? | Neither mechanically | Oscillator readings need the surrounding price behavior to define what the condition means. | An isolated oscillator extreme can be mistaken for a complete trading thesis. |
Common Misreads
Treating RSI and CCI as interchangeable: RSI and CCI can both look like overbought or oversold tools, but their calculations are different. RSI compresses strength balance into a bounded range. CCI measures deviation from an average-price baseline. Similar-looking extremes can describe different conditions.
Reading every high oscillator value as reversal risk: A high oscillator value can reflect pressure, extension, momentum, or persistence depending on the chart context. Price can remain stretched while a trend continues, and a high reading can stay elevated longer than expected.
Ranking one oscillator as universally better: CCI is not automatically better because it expands further, and RSI is not automatically safer because it is bounded. The more useful question is whether the chart needs a strength-balance reading or a deviation reading.
What the Comparison Cannot Decide
CCI vs RSI can clarify what each oscillator is measuring, but the comparison cannot decide trend quality, reversal probability, or trade validity by itself. Thresholds such as RSI 70/30 and CCI +100/-100 are reference zones. They do not replace price structure, acceptance, rejection, volume context, or broader market conditions.
A stronger reading comes from matching the oscillator question to the market behavior being studied. RSI is usually the cleaner lens when the question is internal strength balance. CCI is usually the cleaner lens when the question is price deviation from a baseline. When both are used together, the main value is the contrast between strength and stretch, not a duplicated confirmation label.
FAQ
Is CCI better than RSI?
CCI is not universally better than RSI. CCI is more focused on price deviation from an average baseline, while RSI is more focused on internal strength balance between average gains and losses.
Why can CCI and RSI give different readings on the same chart?
They use different calculations. RSI compares average gains and losses inside a bounded 0-100 scale, while CCI measures how far typical price has moved from an average-price baseline.
Do RSI 70/30 and CCI +100/-100 mean the same thing?
No. RSI 70/30 are bounded oscillator reference zones, while CCI +100/-100 describe common deviation reference areas around the zero line. Both require chart context before interpretation.
Can RSI and CCI be used together?
They can be compared together when the goal is to separate strength balance from price deviation. Treating both as identical overbought or oversold labels weakens the comparison.