Momentum indicators read price movement through different calculations, scales, and lookback assumptions, so the same market move can produce different oscillator outputs. A strong response on one tool may reflect recent gains, distance from an average, range position, or price-plus-volume behavior rather than one universal form of momentum.
Definition: Momentum indicators in trading measure the rate, strength, or direction of price movement over a selected lookback period. Their output depends on the input used, the calculation method, the scale, and whether smoothing is applied.
A threshold reading is an interpretation input, not a trading instruction. A market can remain extended while price continues moving, and a threshold touch can become misleading when structure, volatility, or follow-through do not support the measurement.
Key Points
- Momentum indicators do not all measure the same input. Some use price only, while others include range position, typical price, smoothing, or volume.
- Bounded tools, zero-line tools, and centered or unbounded tools cannot be read with one shared threshold rule.
- A high or low oscillator reading can persist during a strong trend and does not prove that reversal pressure has taken control.
- The useful question is not whether momentum is “high” or “low,” but what the calculation is measuring and what would weaken that output.
What Momentum Indicators Explain in Trading
Momentum indicators explain how current price behavior compares with earlier price behavior. They can help separate a market that is accelerating from one that is slowing, stalling, or moving without much follow-through.
The useful scope is the shared interpretation problem across the indicator family, not a ranking of which oscillator is best or a full tutorial for each tool.
The category is broad. RSI, rate-of-change tools, stochastic-style range tools, CCI, MFI, Williams %R, and MACD-style momentum tools all approach movement from different angles. Treating them as interchangeable creates a common error: the same threshold or visual shape is applied to tools that are built differently.
Momentum is also not the same as trend. A market can trend higher while momentum slows, move sideways while an oscillator swings sharply, or print a strong oscillator reading during a move that has not yet gained structural acceptance. The indicator describes a measurement lens, not the entire market condition.
How Momentum Indicators Calculate Movement
Most momentum indicators begin with a comparison between current price behavior and prior price behavior. The calculation may compare the current close with a close several periods ago, measure the size of recent gains and losses, compare typical price with an average baseline, or evaluate where price sits inside a recent high-low range.
The lookback period controls the window being measured. A shorter lookback usually reacts faster, but it can also create more noise. A longer lookback often smooths the output, but it may respond after the move is already well developed.
Input choice changes the reading. A price-only oscillator may rise because recent closes are stronger than earlier closes. Money Flow Index uses price and volume-derived money flow, so the same price advance can look different when participation expands or contracts.
Calculation lens: Before interpreting a momentum reading, identify what the tool is measuring: price change, average distance, range position, smoothing behavior, or price-plus-volume participation.
Why Different Momentum Indicators Can Disagree
Disagreement between momentum indicators is not automatically a problem. It often means each tool is describing a different part of the same move. One oscillator may focus on recent gains and losses, another may measure distance from an average, and another may describe where the close sits inside a recent range.
Commodity Channel Index is often read around a centered baseline, with +100 and -100 used as common reference areas rather than universal reversal points. That differs from a 0-100 oscillator, where the reading is constrained inside a fixed scale.
Williams %R also uses a bounded scale, but its logic is tied to where the close sits relative to the recent high-low range. A market can therefore show strong range-position momentum while another oscillator gives a less aggressive reading from a different calculation base.
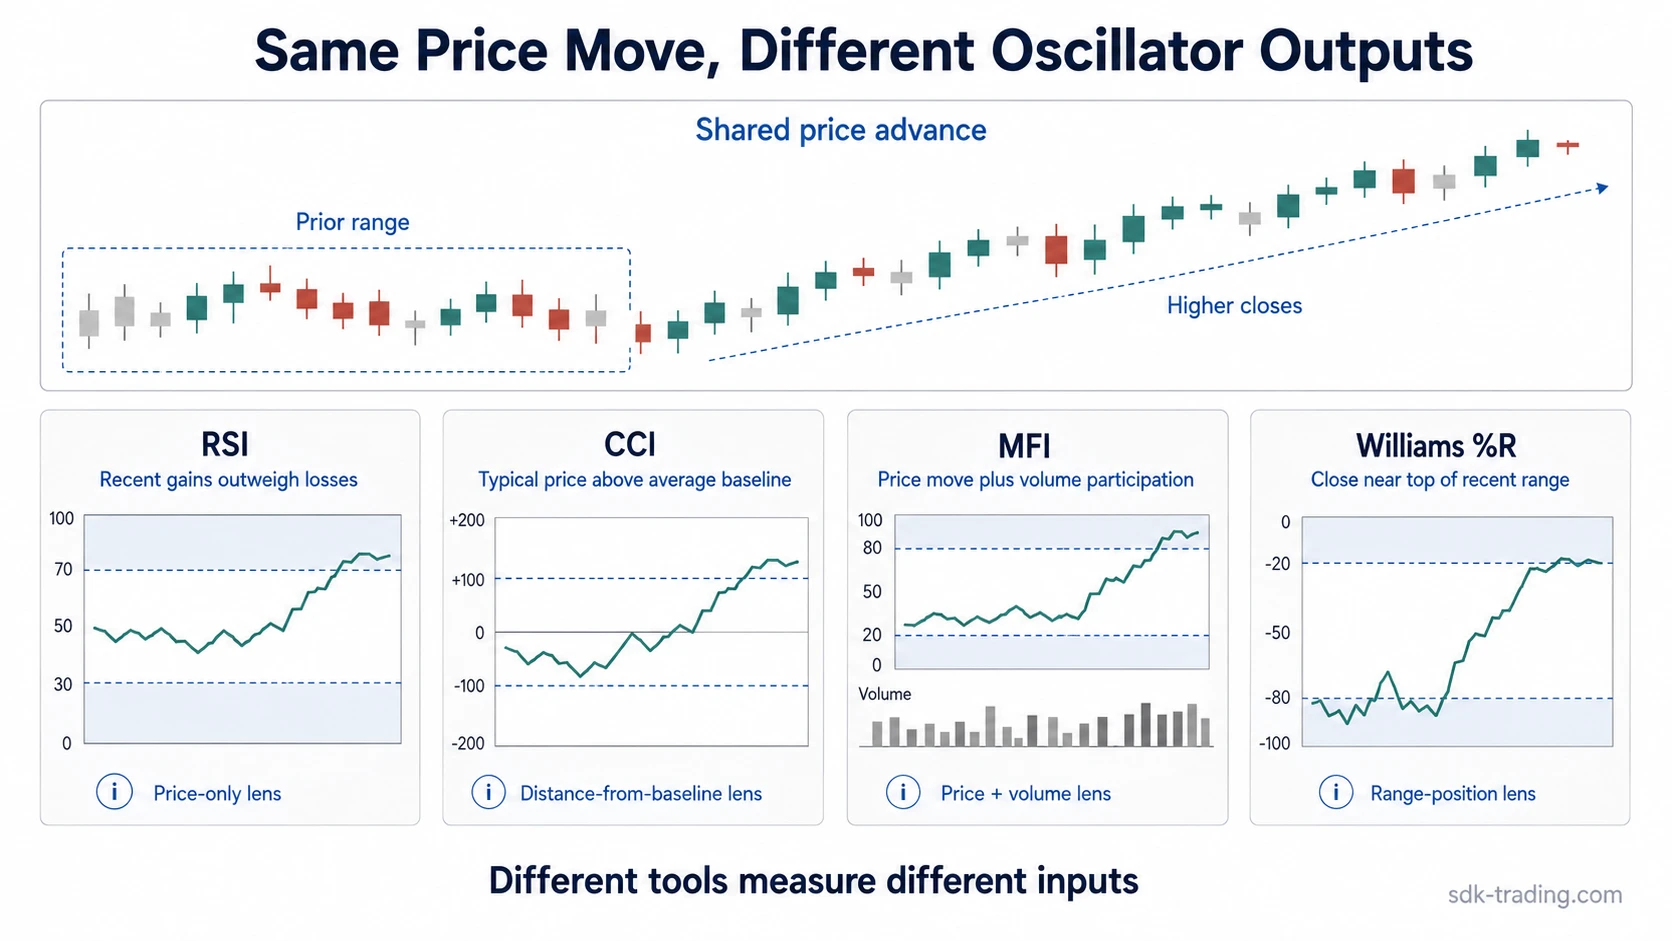
Same move, different lens: A price advance can lift RSI because recent gains outweigh losses, push CCI higher because typical price moves far above its average baseline, strengthen MFI if volume participation expands, and move Williams %R toward an extreme because price closes near the upper part of its recent range.
Threshold Behavior and Scale Limits
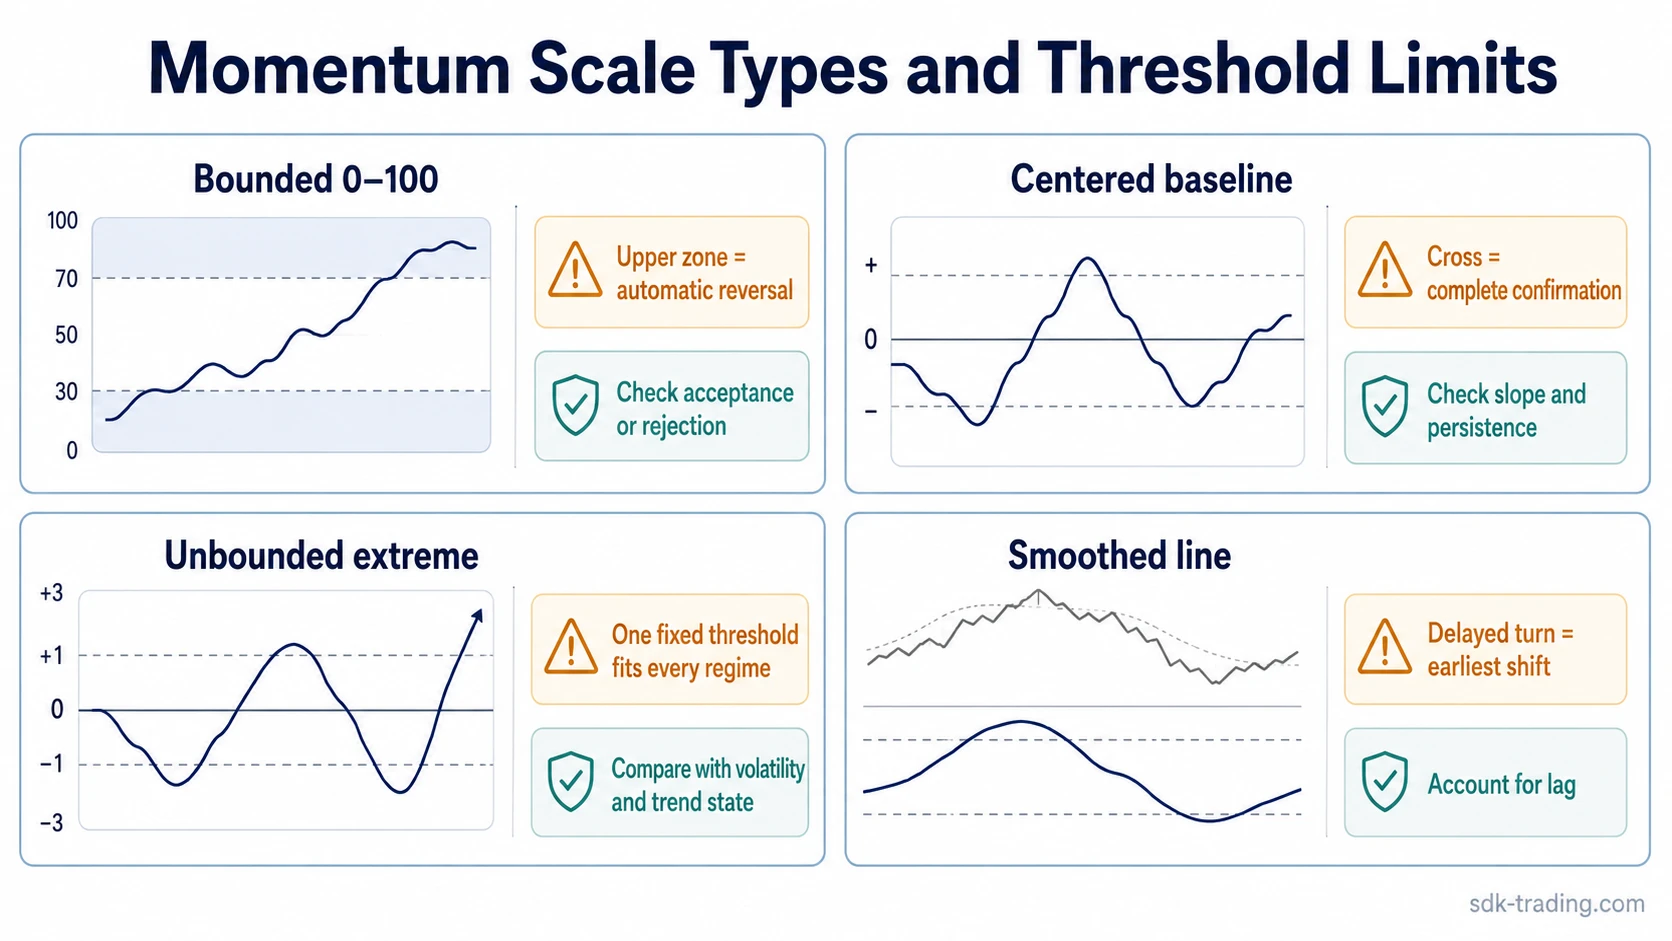
Thresholds help organize interpretation, but they do not mean the same thing across all momentum tools. A fixed upper band on one oscillator is not equivalent to a zero-line cross or a subjective extreme on another oscillator.
| Scale type | Common output behavior | Common misread | Safer interpretation |
|---|---|---|---|
| Bounded 0-100 scale | The indicator stays inside a fixed range, often with upper and lower reference zones. | Assuming every upper-zone reading means reversal pressure has started. | Check whether price is still being accepted higher or whether follow-through is failing. |
| Centered or zero-line scale | The measurement is judged relative to a baseline, often above or below zero. | Treating a baseline cross as complete confirmation. | Compare the cross with slope, persistence, and the price structure around the move. |
| Unbounded or subjective extreme | The reading can expand beyond common reference zones in strong conditions. | Using one fixed threshold as if it applies in every market regime. | Read the extreme against volatility, trend persistence, and whether the move is still accepted. |
| Smoothed momentum line | The indicator reduces noise but may respond later than raw price behavior. | Assuming a delayed turn captures the start of the change. | Recognize smoothing lag and compare it with current price behavior before drawing conclusions. |
Common Misreads and Misleading Readings
A common mistake is reading an extended oscillator as proof that price must soon reverse. Strong momentum can remain extended while a trend keeps moving, especially when buyers or sellers continue accepting new prices rather than rejecting them.
Another mistake is treating a threshold touch as a complete reading. A move into an upper or lower zone may only show that the selected calculation has reached a reference area. It says less about market quality unless the surrounding structure supports the interpretation.
| Observation | Possible interpretation | What can weaken it |
|---|---|---|
| Momentum expands while price advances. | Recent movement is stronger than the selected comparison window. | The move fails to hold accepted prices and quickly returns into the prior range. |
| The oscillator reaches an upper reference zone. | The measured input is extended relative to that indicator’s design. | Trend persistence makes the upper-zone reading last longer than expected. |
| Different oscillators disagree. | Each tool is measuring a different input, scale, or smoothing method. | The disagreement is ignored and one threshold rule is applied to all tools. |
| A smoothed line turns after price has already moved. | The indicator is filtering noise but lagging the latest behavior. | The delayed turn is treated as if it captured the earliest shift in control. |
Noisy ranges create another problem. When price alternates quickly between small advances and declines, momentum tools can flip readings without a meaningful change in structure. Parameter sensitivity can magnify that effect because shorter settings react faster and longer settings absorb more movement before changing direction.
Momentum Indicator Example in Context
Price advances for several bars after a small consolidation and closes near the upper part of the recent range. RSI may rise because recent gains now outweigh recent losses. CCI may expand because typical price has moved far above its average baseline. MFI may react more strongly if volume expands during the advance. Williams %R may move toward an extreme because price is closing near the top of the lookback range.
The readings do not need to agree perfectly. The useful distinction is whether each output is describing the same underlying behavior or a different part of the move. A stronger case requires price acceptance beyond the prior area and continued participation. A weaker or unresolved case appears when price briefly stretches above the range, then closes back inside it while oscillator strength fades or becomes inconsistent.
How to Use Momentum Readings Inside Analysis
A momentum reading becomes more useful when it is tied to the market condition being tested. A rising oscillator during a clean advance says something different from a rising oscillator inside a choppy range. The first may reflect directional pressure; the second may reflect short lookback noise.
The quality of the reading improves when the indicator, price structure, and participation tell a compatible story. It weakens when the indicator is extended but price cannot hold the tested area, when the reading depends only on a very short setting, or when different tools disagree for reasons that the analysis has not identified.
Momentum indicators are best treated as measurement tools. They can help frame acceleration, exhaustion risk, range position, and participation, but they do not replace structure, volatility, trend state, or the question of whether the market is accepting or rejecting new prices.
FAQ
What do momentum indicators measure?
Momentum indicators measure how current price behavior compares with earlier price behavior over a selected lookback period. Depending on the tool, the reading may reflect price change, recent gains and losses, range position, smoothing, or price-plus-volume input.
Why can two momentum indicators give different readings?
Two momentum indicators can disagree because they use different formulas, scales, inputs, and lookback assumptions. The same price move can look different when one tool measures recent gains, another measures distance from an average, and another measures range position.
Does an overbought momentum reading mean price must reverse?
No. An extended reading means the indicator has reached a reference area under its own calculation. Price can remain extended during a persistent trend, so the reading needs to be compared with structure, volatility, and later acceptance or rejection.
Are momentum indicators the same as trend indicators?
No. Momentum indicators measure the strength or rate of movement over a lookback period, while trend analysis focuses on the broader direction and structure of price movement. Momentum can slow while a trend continues, or rise briefly inside a range.