Oscillator readings are easiest to misread when a stretched value is treated as confirmation instead of a conditional reading. A safer interpretation separates what the oscillator measures, which boundary it uses, and whether the market condition supports that reading.
Definition: An oscillator in trading is a technical indicator that moves around a defined boundary, such as a fixed range or centerline, to show momentum behavior, volume flow, displacement, or range position.
Reading Boundaries
- Oscillators show relative momentum, displacement, volume-flow behavior, or range position inside a defined reading structure.
- A threshold reading is not the same as a completed reversal or a complete trading decision.
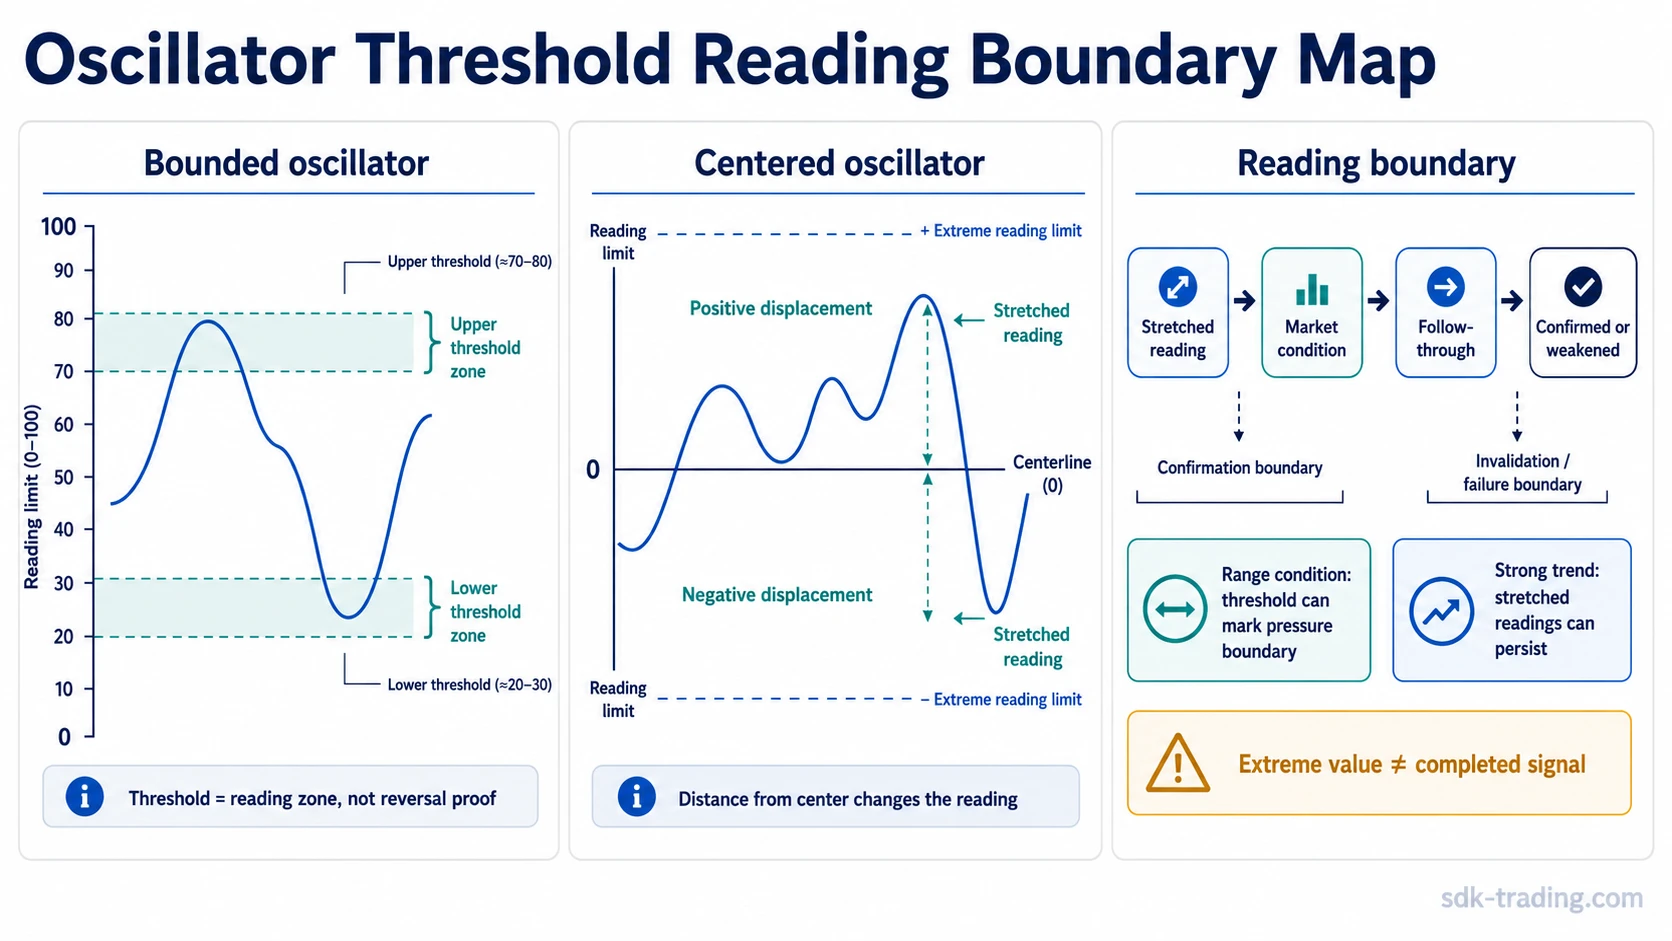
- Bounded oscillators, such as RSI, Stochastic, MFI, and Williams %R, behave differently from centered oscillators such as CCI or MACD-style oscillator readings.
- Overbought and oversold zones can persist during strong trends.
- False signals often appear when the trader reads the number but ignores trend condition, lag, parameter sensitivity, or calculation input.
What Oscillator Readings Actually Measure
For threshold reading, the important point is the oscillator’s boundary. A 0-100 scale, a zero line, and a displacement reading do not carry the same message, even when each looks stretched on a chart.
A bounded oscillator can show that a reading is near an upper or lower zone. A centered oscillator can show whether the reading is above or below a midpoint and how far it has moved from that middle area. Both can be useful, but they answer different interpretation questions.
The Common Mistake: Treating Extremes as Confirmation
The most common oscillator mistake is reading an extreme value as a finished message. A high reading can show strong upside momentum, but it can also appear during a trend that keeps extending. A low reading can show downside weakness, but it can also remain low while sellers still control the move.
The mistake is not using thresholds. Thresholds are useful. The mistake is letting the threshold replace interpretation.
| Mistaken reading | Safer reading |
|---|---|
| A high oscillator reading means the move must reverse. | A high reading shows a stretched or strong upside condition; the next read depends on trend condition and follow-through. |
| A low oscillator reading means price must bounce. | A low reading shows stretched or weak behavior; it can stay low during persistent selling. |
| A centerline cross proves a new trend. | A centerline cross shows a change in oscillator position; price structure still decides whether the change has weight. |
| Divergence means reversal. | Divergence shows disagreement between price and oscillator behavior; it can fail or persist. |
| One oscillator reading is enough. | The reading becomes more useful when the trader knows what the oscillator measures and what would weaken the interpretation. |
Bounded Oscillators vs Centered Oscillators
Bounded oscillators have fixed upper and lower limits. RSI, Stochastic, MFI, and Williams %R are common examples. Because they have a fixed scale, traders often use threshold zones to describe stretched readings.
Centered oscillators move around a midpoint. CCI and MACD-style oscillator readings are examples. These readings are usually interpreted by their relationship to a centerline and by the distance from that middle area, rather than by a fixed 0-100 boundary.
| Oscillator type | Typical boundary | What the reading usually helps show | Main risk |
|---|---|---|---|
| Bounded oscillator | Fixed range such as 0-100 | Whether a reading is near an upper or lower zone. | Thresholds can be mistaken for automatic reversal points. |
| Centered oscillator | Midline such as zero | Whether momentum or displacement is above or below a reference level. | Centerline moves can be overread without price structure. |
| Volume-weighted oscillator | Fixed or bounded scale, depending on design | Whether price behavior is supported by volume flow. | Volume input can change the meaning of a similar-looking reading. |
| Momentum oscillator | Usually bounded or centered | Whether momentum is stretching, fading, or crossing a reference level. | Fast settings can create noisy signals; slow settings can lag. |
The practical difference is simple: a bounded oscillator makes threshold zones easy to see, while a centered oscillator makes displacement from a midpoint easier to compare.
How Thresholds Should Be Read
Thresholds are reading zones, not instructions. They help identify where the oscillator has moved relative to its normal scale, but they do not decide whether price must reverse, continue, pause, or fail.
A threshold reading usually needs three checks: the oscillator boundary, the current market condition, and the behavior after the reading. A trader should ask whether the oscillator is bounded, centered, or volume-weighted; whether price is ranging, trending, accelerating, or compressing; and whether the reading stalls, resets, diverges, crosses back, or keeps pressing into the same zone.
A range-bound market can make upper and lower oscillator zones more useful as pressure boundaries. A strong trend can make those same zones less useful as reversal warnings because extended readings may remain extended.
Oscillator Examples and Common Misreads
Different oscillators can show similar surface readings while measuring different inputs. A high, low, or centerline reading should not be interpreted the same way across every indicator.
| Oscillator | Boundary style | Main reading focus | Common misread | Safer interpretation |
|---|---|---|---|---|
| RSI | Bounded, usually 0-100 | Momentum strength and weakness. | A high or low zone means reversal is complete. | Read the threshold with trend condition and whether momentum is holding or fading. |
| Stochastic | Bounded, usually 0-100 | Closing price position within a recent range. | A stretched range reading must immediately turn. | Useful for range behavior, but it can stay stretched during directional movement. |
| MFI | Bounded, usually 0-100 | Price movement adjusted by volume flow. | A stretched value means price must reverse. | A stretched Money Flow Index reading means more when volume-backed pressure is part of the question. |
| CCI | Centered around zero | Price displacement from an average. | A high or low reading equals the same overbought or oversold box as a 0-100 oscillator. | A Commodity Channel Index reading is usually about displacement from an average and possible return toward the mean. |
| Williams %R | Bounded, usually -100 to 0 | Closing position within a recent high-low range. | A reading near the edge of the range means the next move is already decided. | Extreme readings can show range-edge pressure, but trend persistence can keep the reading stretched. |
| MACD histogram / oscillator-style reading | Centered around zero | Difference between moving-average relationships. | A move above or below zero confirms a complete trend change. | Useful for momentum change, but delayed because it is built from moving averages. |
The point is not to choose one oscillator as universally better. The point is to know which boundary the oscillator uses before assigning meaning to the number.
Market Condition Changes the Reading
Oscillators tend to be easier to read in balanced or range-bound markets because upper and lower zones can reflect repeated boundary behavior. In a strong trend, the same oscillator may stay stretched for longer than expected.
A rising market with repeated high oscillator readings is not automatically exhausted. It may be showing persistent upside momentum. A falling market with repeated low oscillator readings is not automatically near a durable bounce. It may be showing persistent downside momentum.
Strong-trend caveat: A repeated extreme reading can show trend persistence rather than reversal risk. The reading becomes more useful only when the trend begins to lose acceptance, momentum changes behavior, or price fails to hold the area that created the extreme.
Simple Oscillator Reading Example
Imagine a market has moved sideways for several sessions, then pushes into the upper part of its range while a bounded oscillator reaches a high threshold. The tempting read is that the market is too high and must turn.
That read is incomplete. The oscillator is only showing that the reading is stretched relative to its own scale. If price rejects the range edge, momentum fades, and the oscillator falls back below the threshold, the stretched reading becomes more meaningful as a failed pressure attempt.
If price accepts above the range, holds the breakout area, and the oscillator remains elevated without immediate failure, the same threshold reading has a different meaning. It may reflect persistence rather than exhaustion.
A weaker case appears when the oscillator touches a threshold briefly, price does not reach a meaningful boundary, and the reading reverses without any clear change in structure. That is usually a noisy reading, not a strong message.
Lag, Settings, and False Signals
Oscillators are calculations. They do not see the future. They process price, volume, averages, ranges, or rate-of-change inputs according to their formula and settings.
Shorter settings usually react faster but create more noise. Longer settings usually reduce noise but react later. Neither setting removes false signals. It only changes the balance between sensitivity and delay.
| Problem | What happens | Safer check |
|---|---|---|
| Reading the threshold alone | The oscillator reaches a zone and the trader treats the number as complete. | Check whether price behavior supports or rejects the reading. |
| Ignoring trend persistence | The oscillator stays extended longer than expected. | Separate stretched behavior from exhaustion. |
| Using the wrong oscillator for the question | A volume question is answered with a pure price oscillator, or a displacement question is answered with a bounded momentum tool. | Match the oscillator input to the interpretation needed. |
| Overreacting to divergence | Price and oscillator disagree, but price structure has not changed. | Treat divergence as a warning, not a finished reversal. |
| Changing parameters to fit a view | Settings are adjusted until the oscillator supports the preferred interpretation. | Keep the settings logic stable before reading the signal. |
When an Oscillator Reading Becomes More Useful
An oscillator reading becomes more useful when it answers a specific diagnostic question instead of replacing the whole analysis.
- Is the reading stretched or weak relative to this oscillator’s boundary?
- Is the reading happening in a range, trend, breakout attempt, pullback, or compression?
- Is the oscillator built from price, volume, average displacement, or range position?
- Is the reading early, late, noisy, or persistent?
- What would make the interpretation fail?
That last question matters because oscillator readings are conditional. A stretched reading can lose meaning if price keeps accepting higher or lower levels. A divergence can lose meaning if price continues in the same direction and the oscillator resets. A centerline cross can lose meaning if price immediately returns to the prior range.
How to Use Oscillators Without Overreading Them
A clean oscillator workflow starts with the market condition, then reads the oscillator inside that condition.
| Step | Question to answer | Why it matters |
|---|---|---|
| 1 | Is price ranging, trending, breaking out, compressing, or reversing? | The same oscillator reading has different meaning in different conditions. |
| 2 | What does the oscillator actually measure? | Momentum, volume flow, range position, and displacement are not the same input. |
| 3 | Where is the reading relative to its boundary? | Upper zone, lower zone, centerline, and displacement readings need separate interpretation. |
| 4 | Does price behavior support or reject the reading? | The oscillator becomes more useful when price behavior confirms the pressure change. |
| 5 | Does the reading persist, reject, reset, or diverge? | The follow-through after the reading often matters more than the first threshold touch. |
| 6 | What would make the oscillator read fail? | Failure conditions prevent the indicator from being treated as a complete decision. |
This keeps oscillator interpretation useful without turning the indicator into a shortcut. The oscillator remains a reading tool, not a complete trading system.
FAQ
What is an oscillator in trading?
An oscillator in trading is a technical indicator that moves around a defined boundary, such as a fixed range or centerline, to show momentum behavior, volume flow, displacement, or range position.
Are overbought and oversold readings reversal signals?
Overbought and oversold readings are threshold zones. They can show stretched conditions, but they do not prove that price must reverse.
Why do oscillator signals fail?
Oscillator signals often fail when thresholds are read without market condition, when the indicator lags, when settings are too sensitive, or when the oscillator measures the wrong input for the question being asked.
What is the difference between bounded and centered oscillators?
Bounded oscillators move inside a fixed scale, such as 0-100. Centered oscillators move around a midpoint, such as zero, and are usually read by displacement above or below that reference.
Which oscillator should traders use?
The better question is what the trader wants to measure. Momentum, volume-weighted pressure, range position, and displacement are different questions, so the oscillator should match the reading needed.