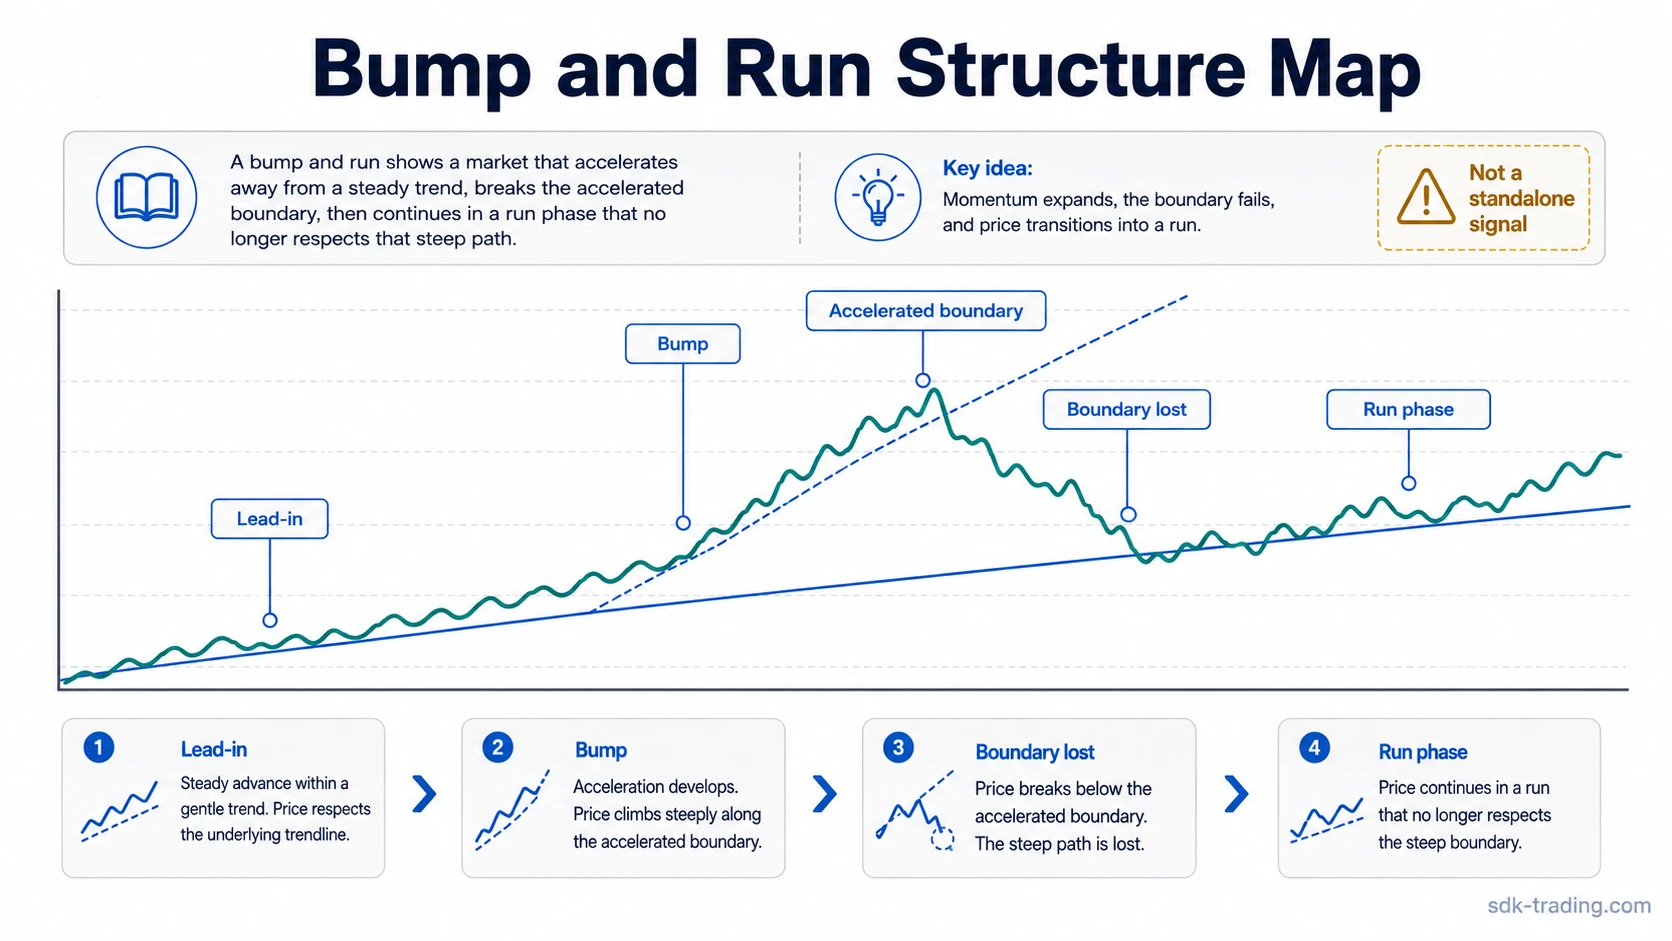
A bump and run chart pattern is a trading chart pattern where a steady trend accelerates into a steeper move, then loses the structure that was guiding the move. The pattern is usually discussed through three parts: the lead-in, the bump, and the run.
The lead-in shows the earlier trend path. The bump shows a sharper extension away from that path. The run begins only when price stops respecting the accelerated structure and starts changing the reading of the prior move.
A fast move alone is not enough; the reading needs a visible lead-in, a steeper bump, and later loss of the accelerated structure.
Definition: A bump and run chart pattern, also called a bump-and-run reversal or BARR pattern, is a slope-acceleration structure where the market first follows a more orderly trend, then stretches into a steeper phase, and later breaks away from that stretched path.
The pattern is a structural reading that depends on whether the accelerated path actually loses control. Its quality depends on whether the lead-in is clear, whether the bump is visibly steeper, and whether the next candles show failed continuation rather than a brief pause inside the same trend.
Key Points
- The lead-in defines the original trend path before the acceleration.
- The bump is the steeper, stretched portion of the move.
- The run depends on acceptance away from the guiding trendline or boundary.
- Weak readings usually come from forced trendlines, small slope differences, or unclear follow-through.
What Is a Bump and Run Chart Pattern?
A bump and run chart pattern describes a market structure where trend speed changes noticeably before the structure gives way. In a bullish reversal reading, the pattern may appear after a decline that accelerates downward before price breaks back above the steepest pressure line. In a bearish reversal reading, the same logic can appear after an advance that accelerates upward before the stretched trend fails.
The important feature is not direction by itself. The important feature is the contrast between the original trend slope and the later accelerated slope. Without that contrast, the pattern becomes difficult to separate from an ordinary trendline break, a pullback, or a generic reversal attempt.
Volume can add context when participation expands during the bump or changes around the later break, but volume alone does not make the pattern valid. The structure needs to remain coherent first; volume only helps describe the pressure behind that structure.
How the Lead-In, Bump, and Run Phases Work
The three phases separate a readable bump-and-run structure from a fast move that only looks dramatic. Each phase has a different job.
| Phase | Structure | What It Shows | What Weakens the Reading |
|---|---|---|---|
| Lead-in | A more orderly trendline or channel develops before acceleration. | The original trend path that later price action will be compared against. | The line is forced, too short, or based on only one obvious touch. |
| Bump | Price moves away from the lead-in path at a visibly steeper angle. | A stretched or accelerated phase where participation becomes less balanced. | The slope difference is small, or the move is only a normal continuation. |
| Run | Later candles lose the accelerated line and begin moving back toward the earlier structure. | The market stops respecting the steepest phase and begins a structural transition. | The break is brief, immediately reclaimed, or unsupported by follow-through. |
The run phase should be read as a change in structure, not as a completed reversal by itself. A sharp break that immediately returns to the prior path can leave the pattern unresolved or invalid.
How to Identify a Bump and Run Structure
A useful bump-and-run reading starts with geometry. The market should show an earlier trend path, then a sharper extension, then a failed ability to maintain the sharper path. The cleaner the contrast between these parts, the easier the pattern is to classify.
- Start with the lead-in: look for a trendline or channel that describes the earlier, less extreme portion of the move.
- Compare the slope: the bump should be noticeably steeper than the lead-in, not just a slightly faster continuation.
- Check the distance from the original path: the bump should create visible separation from the earlier trend structure.
- Watch the steepest boundary: the reading changes when the market stops respecting the accelerated line.
- Use volume as context: rising participation can support the idea of pressure or exhaustion, but it should not replace structure.
- Check follow-through: acceptance, rejection, or a failed reclaim of the steepest boundary affects whether the reading remains clean.
Diagnostic note: A steep move alone is not enough. The pattern needs a readable lead-in, a clear bump, and price behavior that changes how the accelerated phase is classified.
Clean, Weak, and Invalid Bump and Run Readings
The strongest information gain in a bump-and-run reading comes from separating clean structure from forced structure. A chart can contain a fast move without producing a useful bump-and-run pattern.
| Reading Type | Typical Structure | Diagnostic Boundary | Safer Classification |
|---|---|---|---|
| Clean reading | A stable lead-in appears first, followed by a clearly steeper bump and a later loss of the accelerated line. | The market stops respecting the steepest phase and does not immediately restore it. | Readable bump-and-run structure. |
| Weak reading | The lead-in exists, but the slope difference is modest or the trendline placement feels selective. | Follow-through is mixed, with no clear acceptance away from the accelerated path. | Possible structure, but uncertain classification. |
| Invalid reading | The chart has a fast move, but no stable lead-in or no meaningful difference between the original and accelerated slopes. | The supposed break is quickly reclaimed, or the pattern depends on a forced line. | Not a defensible bump-and-run classification. |
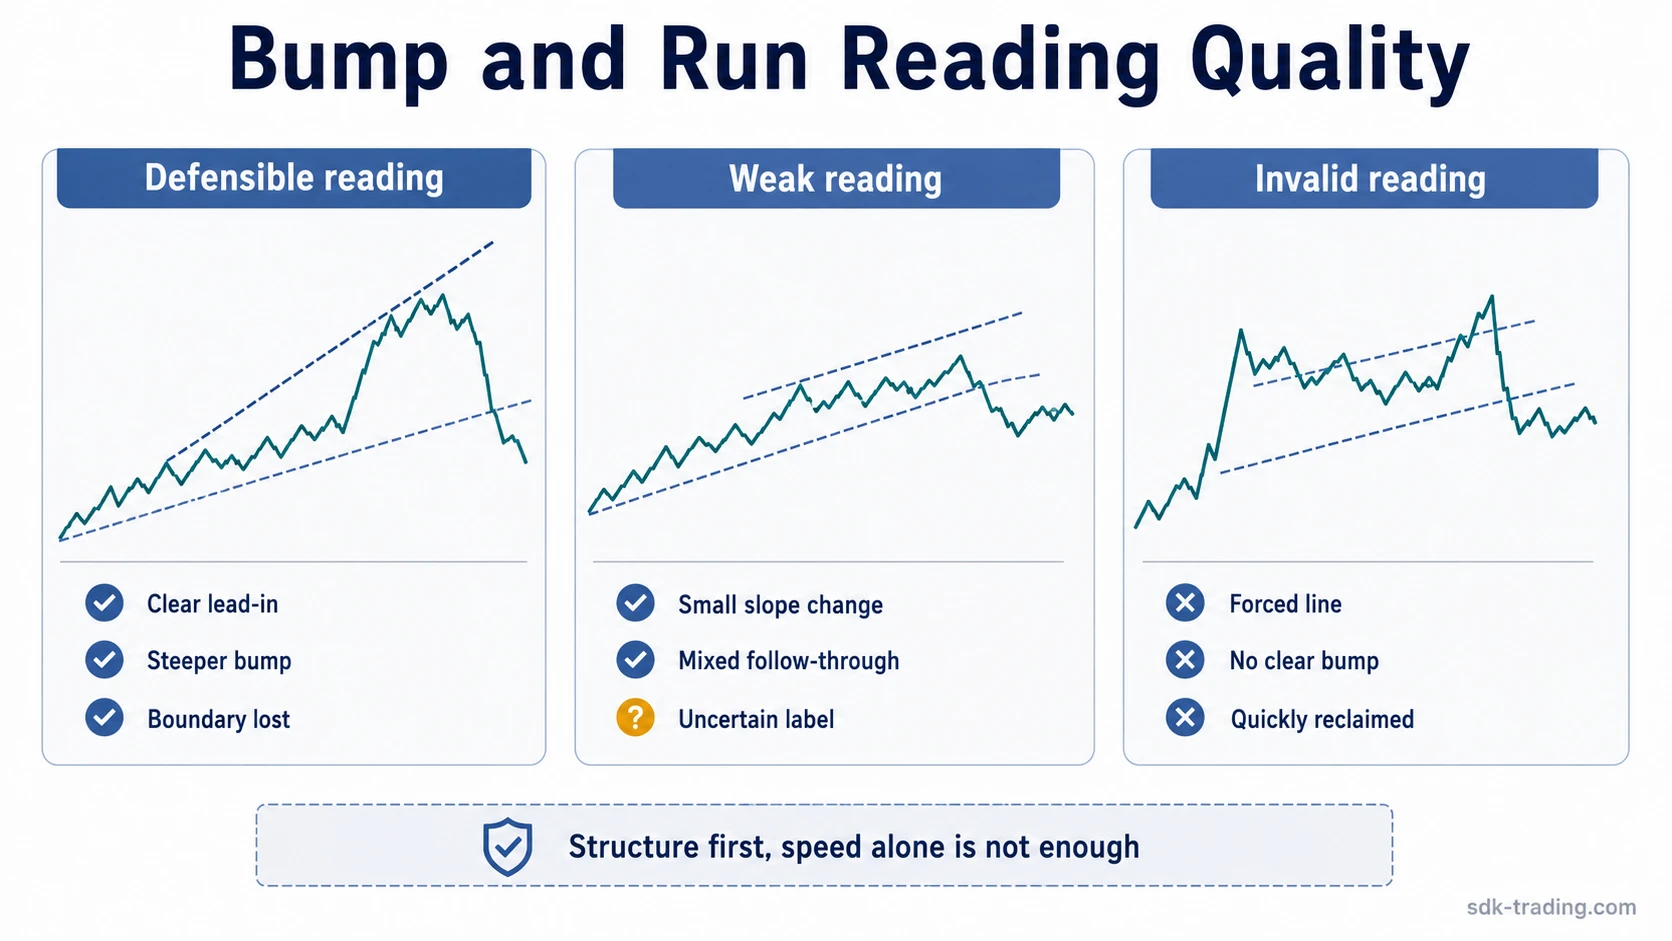
The boundary is not whether price moved quickly. The boundary is whether the earlier trend, the accelerated phase, and the later loss of that acceleration are all visible without forcing the lines.
Bump and Run Reversal vs Nearby Reversal Patterns
A bump and run reversal is slope-based. It focuses on acceleration away from an earlier trend path and the later failure of that accelerated path. Nearby reversal patterns often use different evidence.
| Pattern | Main Structure | What Separates It |
|---|---|---|
| Bump and run | Lead-in trend, steeper bump, later loss of the accelerated boundary. | The key evidence is slope acceleration and structural failure of the steepest phase. |
| Double bottom | Two tests of a lower area with later behavior around the intervening high. | A double bottom is built around base and level retest behavior rather than slope acceleration. |
| Head and shoulders | Left shoulder, head, right shoulder, and neckline behavior. | The structure depends on swing symmetry and neckline behavior more than a lead-in-to-bump slope change. |
| Generic reversal | Any change from one directional bias to another. | The label is broader and does not require the lead-in, bump, and run sequence. |
The bump-and-run reading stays tied to trend geometry: the earlier path, the steeper acceleration, and the later loss of that accelerated boundary. If the chart is mainly testing a horizontal base, the better label may be a level-based reversal structure rather than a bump-and-run pattern.
Common Mistakes With Bump and Run Patterns
Common mistake: Calling any fast move a bump-and-run pattern before the lead-in and later trendline behavior are visible.
Another mistake is treating the first break of the steepest line as automatic confirmation. A break can start the classification question, but the next candles decide whether the market accepts the structural change or quickly returns to the prior path.
Volume can also be misread. A large volume increase during the bump may show active participation, but it does not prove exhaustion by itself. The more useful question is whether the chart later fails to maintain the accelerated structure.
Forced trendlines create the most fragile readings. If the lead-in line can only be drawn after the outcome is already visible, the pattern may be a retrospective label rather than a useful chart-reading structure.
Bump and Run Chart Pattern Example in Context
Price advances along a steady rising trendline, then begins moving higher at a much sharper angle. The accelerated phase pushes well above the earlier path, but later candles stop holding the steepest line. The next recovery attempt reaches near that broken line, fails to reclaim the accelerated boundary, and cannot restore the prior steep slope.
That sequence creates a cleaner bump-and-run reading because the lead-in, bump, and loss of acceleration are all visible. The reading stays weaker if the original trendline is unclear, the steeper phase is only slightly different, or price quickly reclaims the accelerated boundary after the break.
The same logic can be inverted in a declining structure. The direction changes, but the diagnostic question stays the same: was there an orderly lead-in, a stretched bump, and price behavior that changed the meaning of the accelerated phase?
Limitations of the Bump and Run Pattern
Limitation: The pattern depends heavily on trendline placement and slope comparison. Small changes in how the lines are drawn can change the classification.
Bump-and-run structures can also fail when the market breaks the accelerated line but immediately accepts the old direction again. That behavior can turn a possible transition into a failed break or a continuation pause.
Timeframe matters as well. A structure that looks stretched on a short-term chart may be minor noise inside a larger trend. A cleaner reading compares the pattern with the broader chart context instead of isolating one steep segment.
The pattern is most useful as a classification tool. It can help describe when a trend has become stretched and when that stretched phase is no longer being respected, but it does not define a complete trading decision by itself.
FAQ
What is a bump and run chart pattern?
A bump and run chart pattern is a trading chart pattern where an orderly trend accelerates into a steeper move, then later loses the structure that guided the accelerated phase.
What are the three phases of a bump and run pattern?
The three phases are the lead-in, the bump, and the run. The lead-in shows the earlier trend path, the bump shows acceleration, and the run describes behavior after the accelerated structure is lost.
Is a bump and run pattern a trade signal?
No. It is a chart-reading structure, not a standalone trade signal. The reading still depends on context, trendline quality, follow-through, and whether the pattern remains valid after the accelerated phase breaks.
When is a bump and run reading weak or invalid?
The reading is weak when the slope difference is small, the trendline is forced, or follow-through is mixed. It becomes invalid when the chart lacks a clear lead-in, lacks a real bump, or immediately restores the supposed broken structure.