An inverse head and shoulders is a reversal chart pattern built from three troughs after a decline: a left shoulder, a deeper head, and a right shoulder that forms below a neckline. It is the bottoming version of the broader shoulder-head-shoulder structure, and the label becomes more defensible when price behavior around the neckline shows acceptance rather than an immediate return into the base.
Definition: An inverse head and shoulders pattern is a bottoming structure where the middle trough is the deepest point, the two shoulders form higher lows on either side, and the neckline connects the reaction highs between those lows.
The pattern is best read as structure first, not as an automatic bullish signal. A clean label depends on the prior decline, the relationship between the three troughs, the relevance of the neckline, and whether later price action can hold above that neckline after testing it.
Key Points
- The inverse head and shoulders pattern needs three distinct troughs, with the head lower than both shoulders.
- The neckline connects reaction highs and acts as the main boundary for completion, failure, or unresolved behavior.
- A prior decline or correction matters because the pattern is a reversal structure, not a random three-low sequence.
- A clean reading requires structure plus neckline acceptance; weak or invalid readings appear when the market cannot hold the boundary.
What Is an Inverse Head and Shoulders?
An inverse head and shoulders is the bullish mirror of a topping head-and-shoulders structure. In the inverse version, the market first makes a low, then a deeper low, then a higher low. The neckline is drawn through the reaction highs that separate those troughs.
The label is more defensible when the pattern follows a meaningful decline and the right shoulder shows that sellers failed to push price back below the head. That failure does not prove a reversal, but it changes the reading from a simple downtrend continuation into a possible base-building structure.
The neckline is the most important boundary. A brief move above it is not enough by itself. A stronger reading develops when price can trade above the neckline, avoid immediate rejection back into the base, or retest the area without losing the structure.
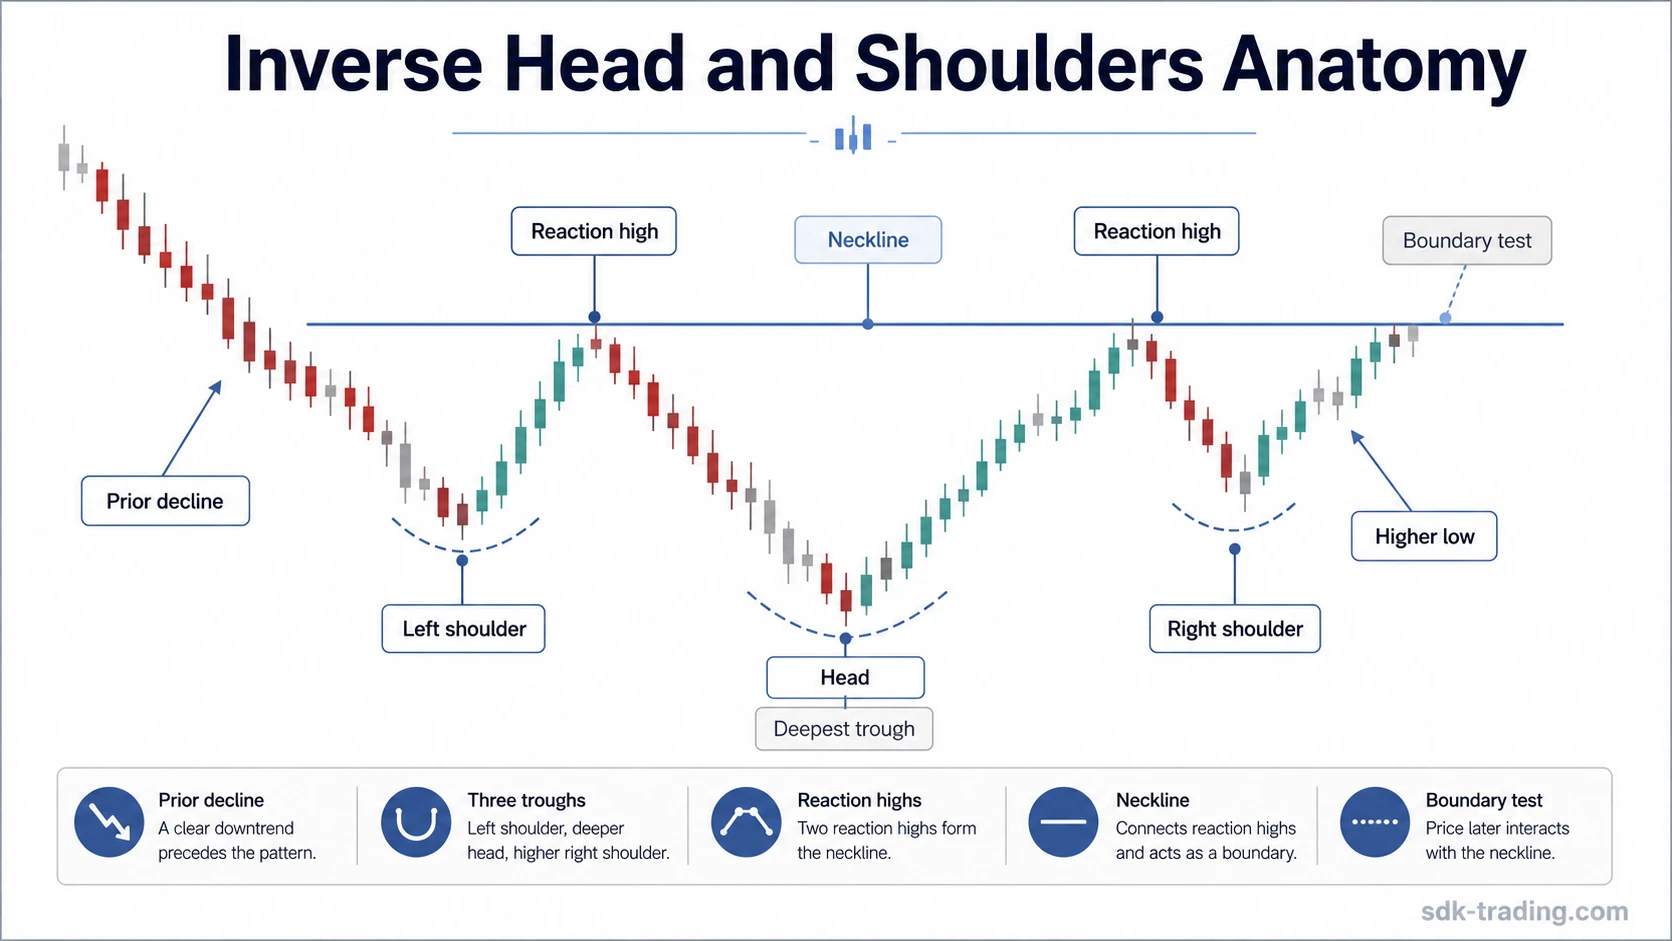
Inverse Head and Shoulders Anatomy
The pattern has four main parts. Each part should be visible enough to affect interpretation; a vague dip or a minor pause should not be forced into the structure just to complete the shape.
| Component | What it represents | What weakens the reading |
|---|---|---|
| Prior decline | The market enters the structure from downward pressure or a correction. | No meaningful decline exists before the three-trough shape. |
| Left shoulder | The first trough forms after sellers push price lower and buyers react. | The first trough is too minor to define a real reaction area. |
| Head | The middle trough reaches the deepest low in the structure. | The middle low is not clearly deeper than the shoulders. |
| Right shoulder | The market forms a higher low after failing to extend below the head. | The right shoulder breaks down or remains incomplete. |
| Neckline | The reaction highs between the troughs create the main completion boundary. | The neckline is unclear, ignored by price, or broken only by a wick. |
How the Pattern Forms
The structure begins when a declining market forms a first reaction low. A recovery attempt follows, but selling pressure returns and drives price to a deeper low. That deeper low becomes the head if the market later rebounds and fails to make another low of similar depth.
The right shoulder is the first important change in behavior. Sellers still test the lower area, but they cannot extend the decline as far as they did at the head. That higher low can suggest that downside pressure is losing force, but the structure remains unfinished while price is still below the neckline.
The neckline test separates a possible pattern from a completed structure. If price moves above the neckline and then holds that area on later testing, the inverse head and shoulders label has stronger structural support. If price breaks above the neckline and quickly falls back into the base, the structure remains weak or failed.
Volume note: Volume can support the interpretation when activity expands near the neckline or contracts during the right-shoulder pullback, but volume does not prove the pattern. Structure and acceptance still matter more than one volume reading.
How to Identify an Inverse Head and Shoulders
A useful identification process starts with the market structure, not with the name of the pattern. The three troughs should be separated by meaningful reaction highs, and the middle trough should be visibly lower than the two shoulders.
- Look for a prior decline or correction before the structure begins.
- Check that the left shoulder forms a real reaction low, not only a minor intrabar dip.
- Confirm that the head is the deepest trough in the structure.
- Check whether the right shoulder forms a higher low rather than another deep breakdown.
- Draw the neckline through the reaction highs between the troughs.
- Evaluate whether price accepts the neckline area or fails back below it.
The shoulders do not need to be perfectly symmetrical. Live market structures are often uneven. The stronger question is whether the market created a clear low, a deeper low, a higher low, and a neckline that later affects price behavior.
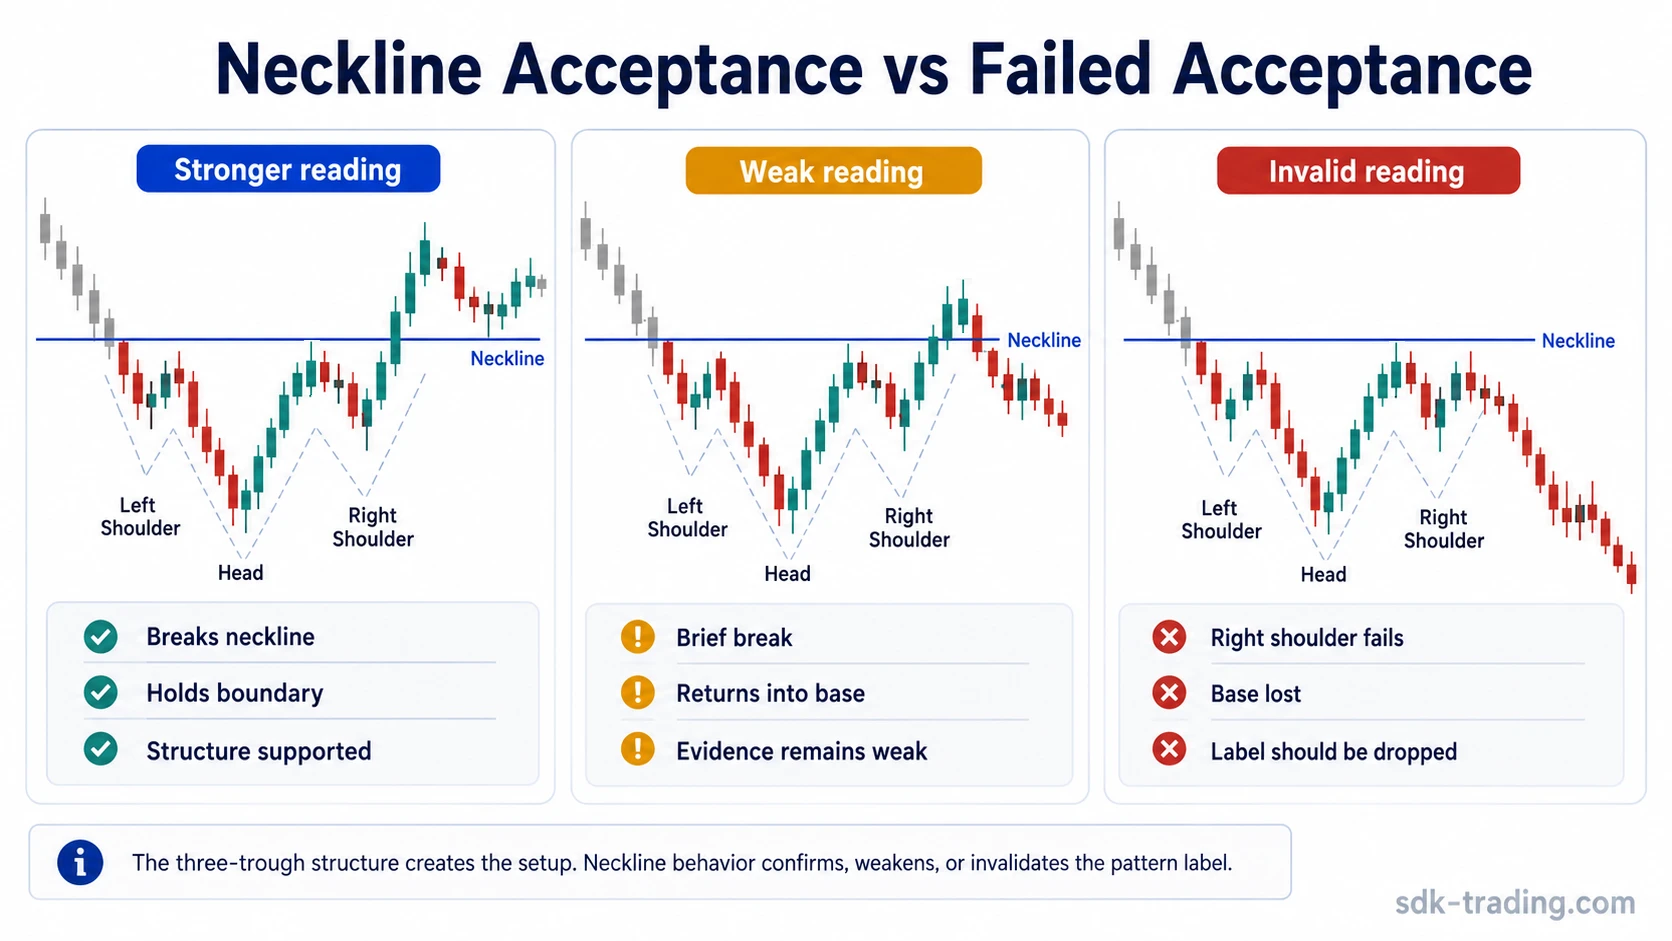
Clean, Weak, or Invalid Inverse Head and Shoulders Reading
The same rough shape can carry different meanings depending on neckline behavior and later acceptance. A clean reading has structure and follow-through. A weak reading has shape but poor boundary behavior. An invalid reading loses the structural logic that made the label useful.
| Reading | Structure | Neckline behavior | Diagnostic interpretation |
|---|---|---|---|
| Clean | Prior decline, clear left shoulder, deeper head, and higher right shoulder. | Price breaks and holds above the neckline or retests it without collapsing. | The pattern label is more defensible because structure and acceptance point in the same direction. |
| Weak | The three-trough shape is visible, but the shoulders are uneven or the neckline is poorly defined. | Price briefly moves above the neckline but shows little ability to hold the area. | The structure may still be monitored as a base, but the evidence remains vulnerable to failure or range behavior. |
| Invalid | No prior decline exists, the head is not the deepest trough, or the right shoulder breaks down. | The neckline has little relevance, or price immediately falls back below it and loses the base. | The pattern label should be dropped because the market no longer supports the required structure. |
Simple Inverse Head and Shoulders Example
Price declines into a prior support area and forms a first trough. A rebound stalls, sellers push price to a deeper low, and the market then recovers again. On the next pullback, price holds above the head and forms a higher right shoulder below the neckline.
The structure is still incomplete while price remains under the neckline. The label improves if the market later trades above that boundary and does not immediately fall back into the base. If the next recovery attempt stalls at the neckline and price returns into the base, the structure remains unresolved rather than cleanly completed.
Common Mistakes
The most common mistake is labeling any three lows as an inverse head and shoulders. The pattern needs a deeper middle trough, meaningful reaction highs, and a neckline that matters to later price behavior.
| Mistake | Why it creates a weak reading | Safer diagnostic check |
|---|---|---|
| Ignoring the prior decline | A sideways range with three dips can be misread as a reversal pattern. | Check whether the market entered the structure from a real decline or correction. |
| Forcing symmetry | Perfect spacing is less important than the relationship between the troughs and neckline. | Focus on lower head, higher right shoulder, and meaningful reaction highs. |
| Completing the pattern too early | An unfinished right shoulder can still break down and remove the structure. | Evaluate the structure only after the right shoulder is visible, then assess neckline behavior. |
| Treating a wick above the neckline as acceptance | A brief test can fail without changing the broader base structure. | Check whether price can hold above the neckline or reclaim it after a retest. |
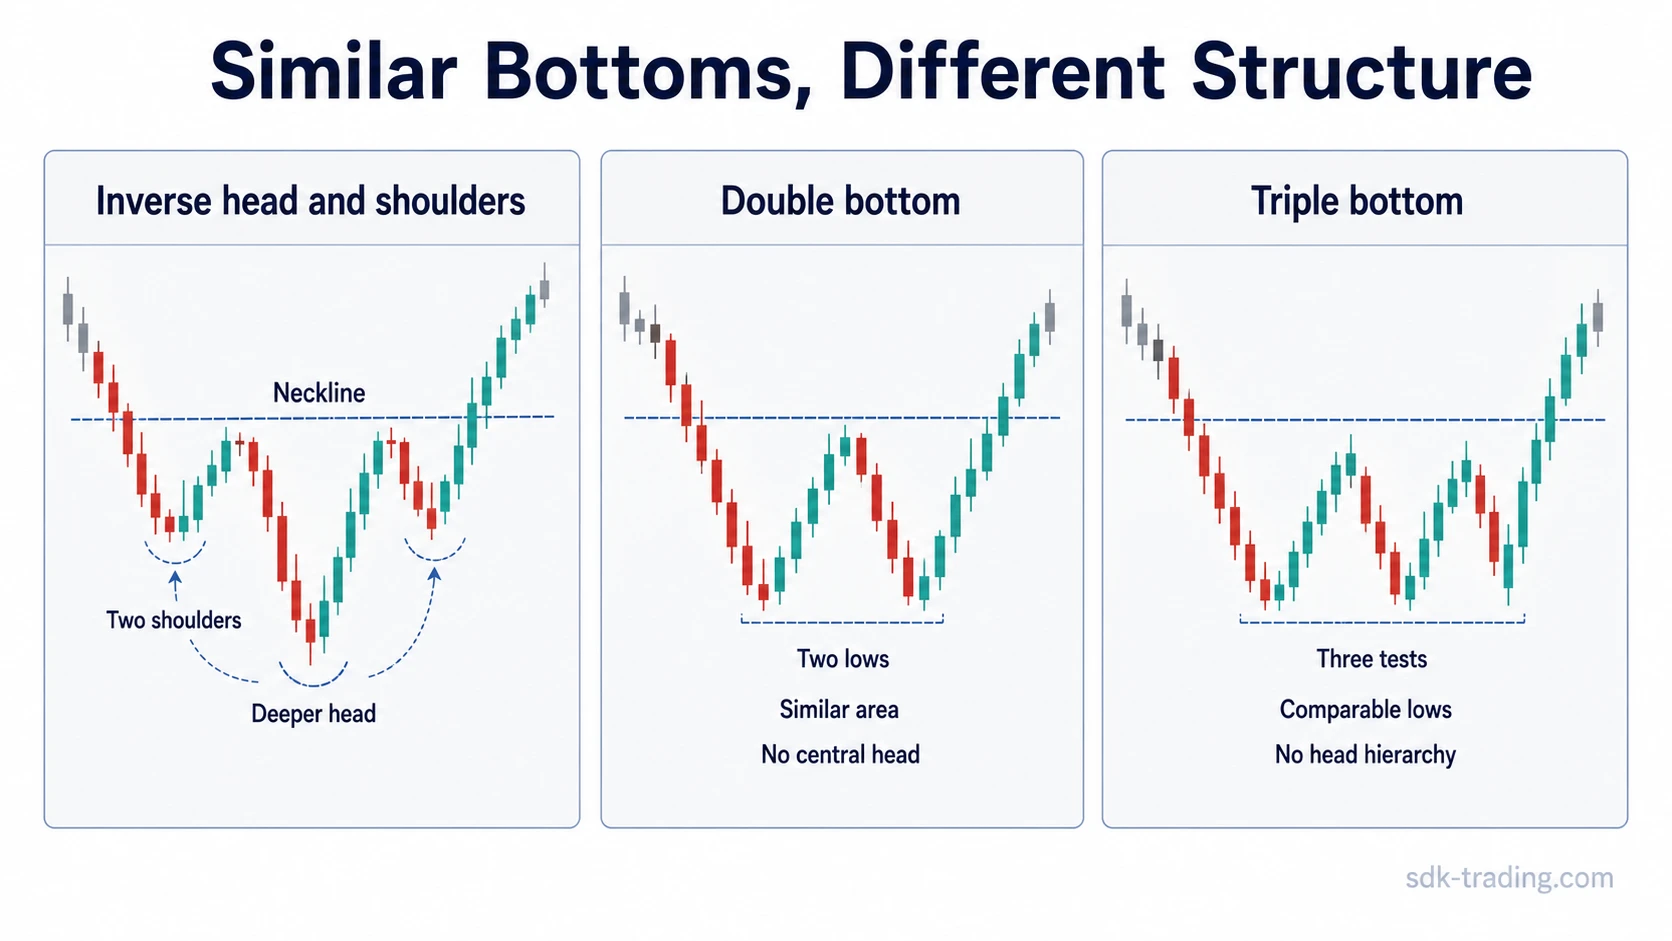
Inverse Head and Shoulders vs Nearby Reversal Patterns
The inverse head and shoulders pattern is often confused with other bottoming structures because several reversal patterns can form after a decline. The difference is the relationship between the troughs and the role of the neckline.
| Pattern | Main structure | Key distinction |
|---|---|---|
| Inverse head and shoulders | Three troughs, with the middle trough as the deepest point. | Shoulder-head-shoulder hierarchy plus neckline behavior defines the reading. |
| Head and shoulders | Three peaks, with the middle peak as the highest point. | It is the mirrored bearish topping version, not the bottoming version. |
| Double bottom | Two major lows near a similar area. | It does not require a deeper central head or two shoulders. |
| Triple bottom | Three comparable tests of a lower area. | The lows are usually closer in depth, so the head hierarchy is missing. |
| Rounding bottom | Gradual basing and transition from decline to recovery. | The structure is smoother and less dependent on three distinct troughs. |
Limitations and Failed Neckline Acceptance
Inverse head and shoulders patterns are subjective. Different traders may draw different necklines, especially when reaction highs are uneven or the structure develops over a long base. A pattern that looks clean on a diagram can be less clear in live market data.
False neckline breaks are another limitation. Price may briefly trade above the neckline, attract attention, and then fall back into the base. When that happens quickly, the neckline break becomes a failed acceptance attempt rather than strong evidence of completion.
Retests should also be read conditionally. A retest that holds near the neckline can support the structure. If price cuts back through the neckline and cannot recover it, the structure loses quality. The point is not that every completed pattern must retest, but that later behavior around the boundary often clarifies whether the market accepted or rejected the structure.
Limitation: The inverse head and shoulders pattern can describe a possible shift in structure, but it does not predict a reversal by itself. The label is strongest when the three-trough structure, neckline behavior, and later acceptance all support the same interpretation.
FAQ
What does an inverse head and shoulders pattern mean?
It means price has formed a three-trough bottoming structure after a decline, with the middle trough as the deepest point and a neckline connecting the reaction highs. The pattern can suggest weakening downside pressure, but the reading depends on neckline behavior and later acceptance.
Is an inverse head and shoulders always bullish?
No. It is commonly classified as a bullish reversal pattern, but the shape alone is not enough. The reading weakens if price cannot hold above the neckline or if the right shoulder breaks down.
Does the neckline have to be perfectly horizontal?
No. A neckline can slope upward or downward if it connects meaningful reaction highs. The important test is whether the neckline acts as a relevant boundary when price returns to it.
How is an inverse head and shoulders different from a triple bottom?
An inverse head and shoulders has one deeper middle trough and two higher shoulders. A triple bottom usually has three comparable tests of a lower area, so the shoulder-head-shoulder hierarchy is not the same.