A head and shoulders chart pattern is a technical-analysis reversal pattern that forms after an advance, with a left shoulder, a higher head, a right shoulder, and a neckline connecting the reaction lows.
The structure matters only when the surrounding chart context supports it. A visible three-peak shape is not enough by itself; the quality of the neckline, the balance between the shoulders, and later behavior around that neckline all affect the reading.
Definition: A head and shoulders chart pattern is a bearish reversal structure where price forms three peaks, the middle peak is the highest, and the neckline acts as the main boundary for judging whether the structure is complete, weak, or invalid.
Key Points
- A head and shoulders chart pattern has three peaks and a neckline.
- The head is higher than both shoulders.
- The pattern is usually read after a mature advance, not in isolation.
- Neckline behavior affects whether the structure is complete or still unresolved.
- Asymmetry does not automatically invalidate the pattern, but failed neckline acceptance can weaken it.
What Is a Head and Shoulders Chart Pattern?
A head and shoulders chart pattern is a reversal chart pattern used in technical analysis to describe a possible transition from upward control to weaker upside behavior. It belongs to the reversal-pattern family because it appears after an advance and shows price failing to extend cleanly after a higher middle peak.
The pattern is not a prediction. It is a structural reading. The main question is whether the market forms a left shoulder, pushes to a higher head, returns toward a neckline, and then fails to rebuild strength on the right shoulder.
A better reading separates the visible outline from the reason the outline matters. The pattern shape is the surface; the surrounding structure and neckline behavior decide whether the shape has useful meaning.
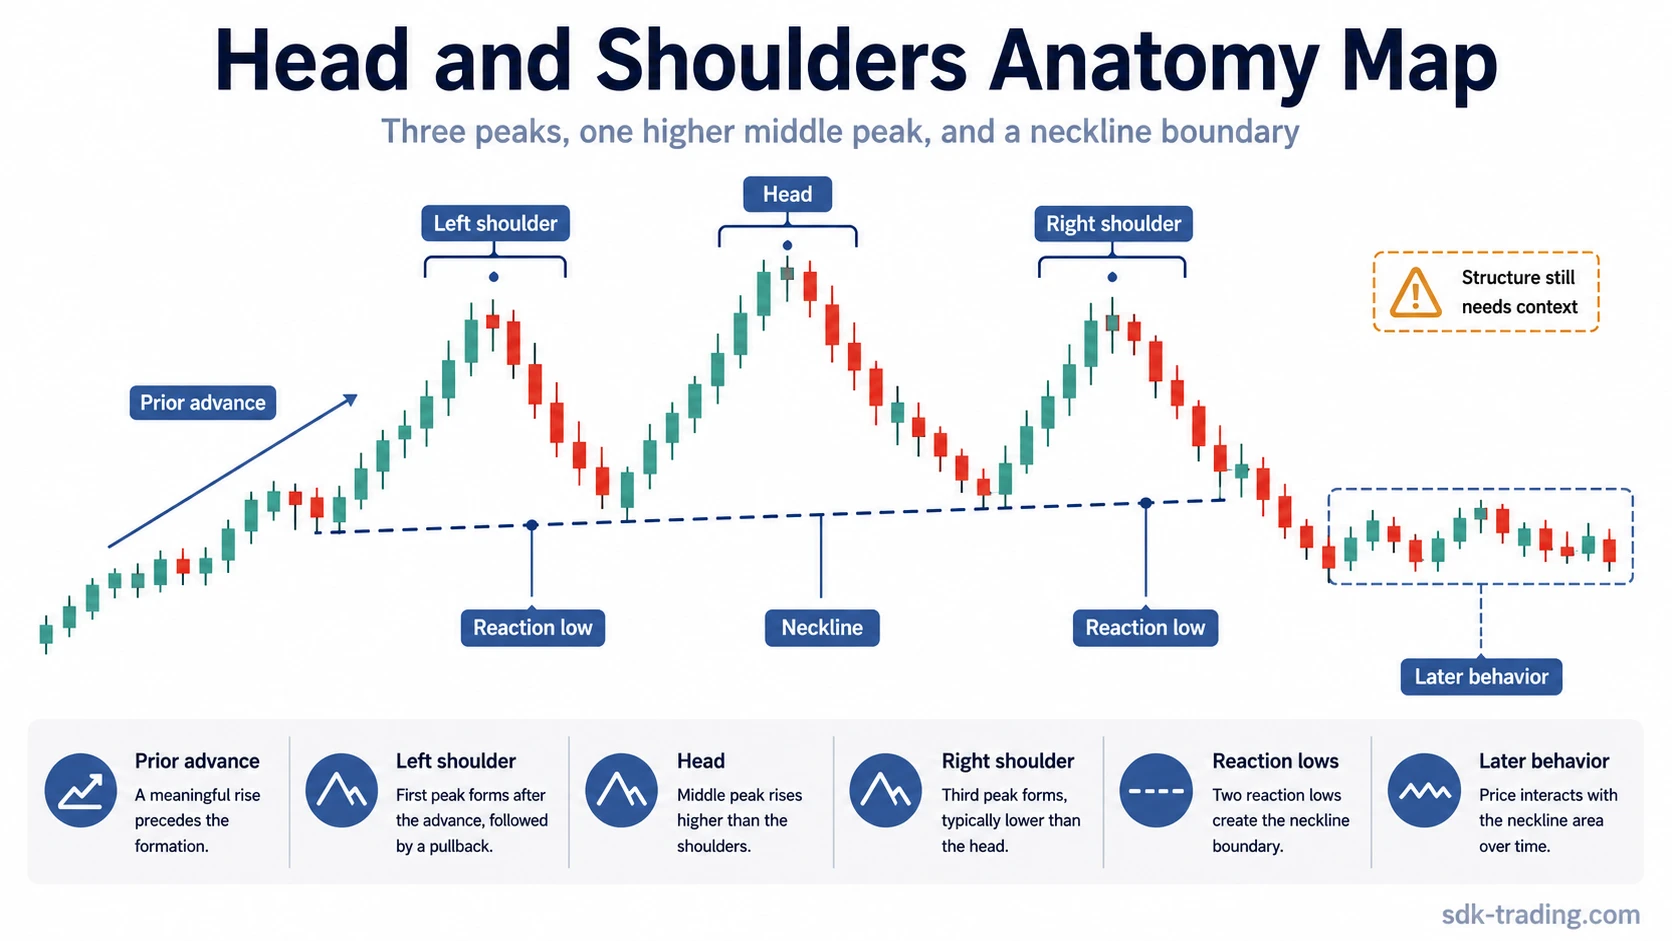
Head and Shoulders Anatomy
The basic anatomy is simple, but each part has a job. The shoulders show repeated attempts to hold the prior advance, the head marks the highest test, and the neckline shows where downside behavior becomes more important.
| Component | What It Means | What to Check |
|---|---|---|
| Prior advance | The pattern is normally read after a meaningful move higher. | Check whether the structure appears after upward pressure, not inside random sideways noise. |
| Left shoulder | The first peak forms after the advance and then pulls back. | Look for a reaction low that can help define the neckline. |
| Head | The middle peak trades above the left shoulder. | Confirm that it is clearly the highest part of the structure. |
| Right shoulder | The next rally attempt stalls below or near the head. | Check whether the market fails to reclaim the higher-peak behavior. |
| Neckline | The line connects the reaction lows between the peaks. | Use it as the main boundary for judging completion, weakness, or failure. |
| Later neckline behavior | Price behavior around the neckline changes the quality of the reading. | Compare a brief wick, a close beyond the line, and later acceptance or rejection. |
How the Pattern Forms
The sequence begins with a prior advance. Price then forms the left shoulder, pulls back, pushes to a higher peak, and reacts again toward a similar lower area. The right shoulder forms when the next rally attempt cannot rebuild the same upside extension as the head.
The neckline connects the reaction lows created between the three peaks. A horizontal neckline is easiest to read, but many real structures slope. A sloping neckline does not automatically reject the pattern; it makes the boundary more judgment-based and increases the need to compare later behavior.
Symmetry can help visual clarity, but perfect symmetry is not required. Uneven shoulders can still be readable if the head is clear, the neckline is coherent, and the right shoulder shows weaker upside behavior than the head.
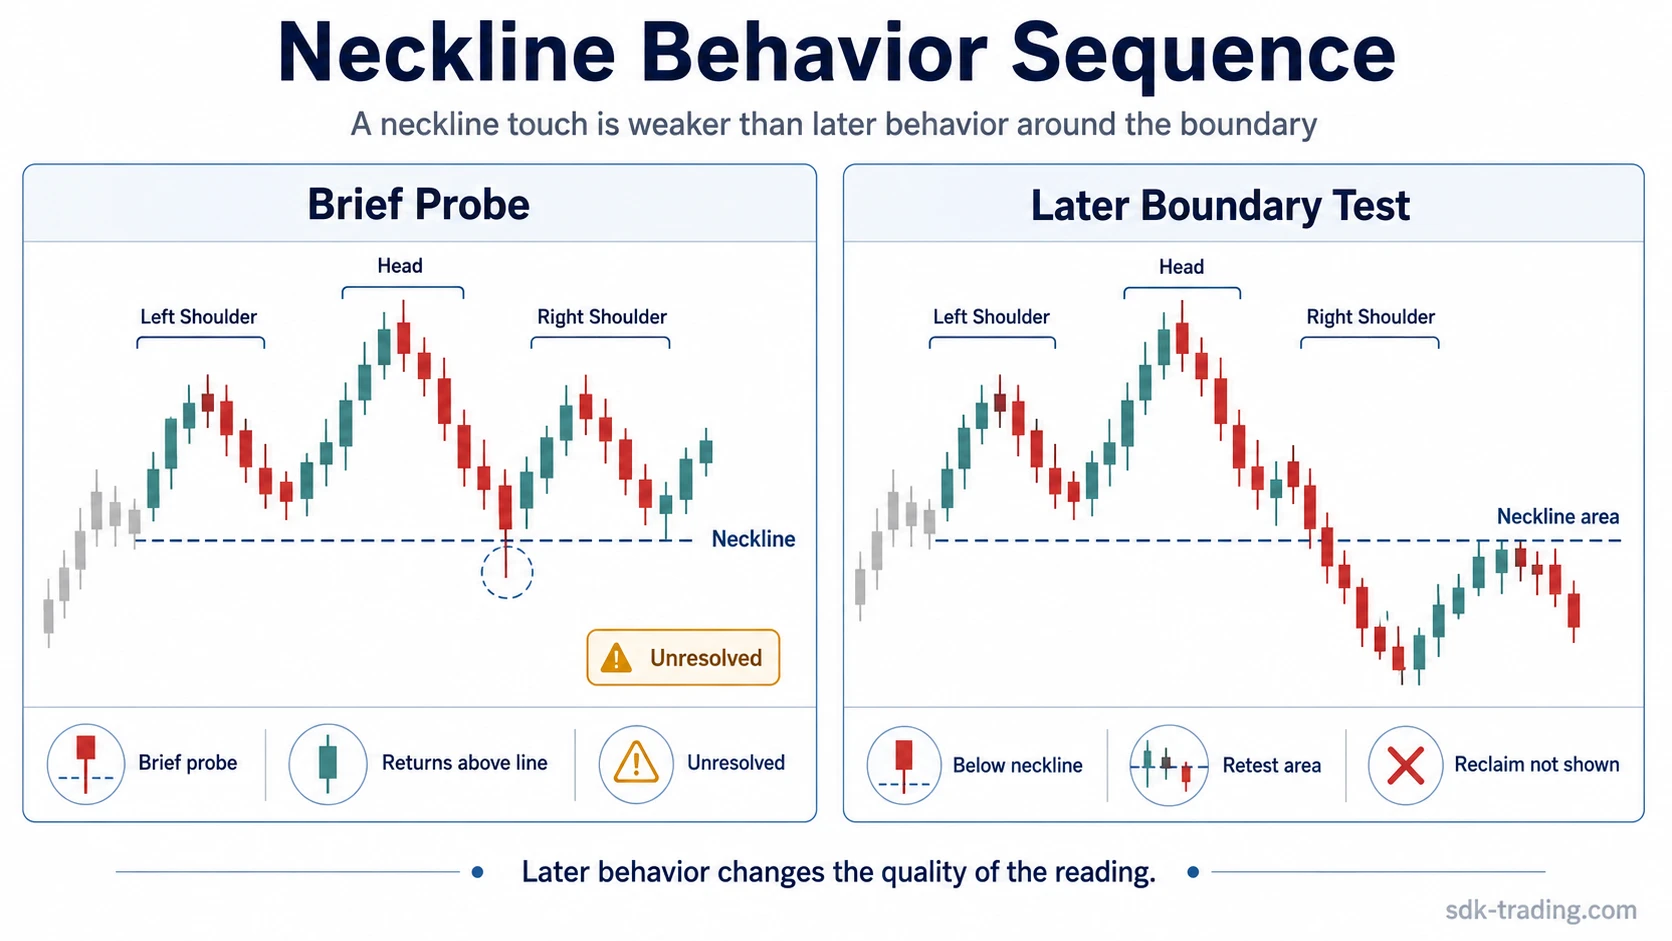
Why the Neckline Matters
The neckline is the main boundary between an unfinished three-peak shape and a more complete reversal structure. A brief move through the neckline can be only a probe. A more meaningful reading needs later behavior that shows whether price is accepted beyond the neckline or quickly returns back into the prior range.
Failed neckline acceptance is one of the most important quality checks. If price moves below the neckline but then recovers above it quickly, the pattern becomes less convincing. If the next recovery attempt stalls near the neckline and price remains unable to reclaim the structure, the head and shoulders reading becomes more defensible.
Many chart pattern failures begin with a shape that looks complete, then lose meaning when later behavior rejects the expected structural boundary. That is why the neckline should be treated as a diagnostic boundary, not as a standalone instruction.
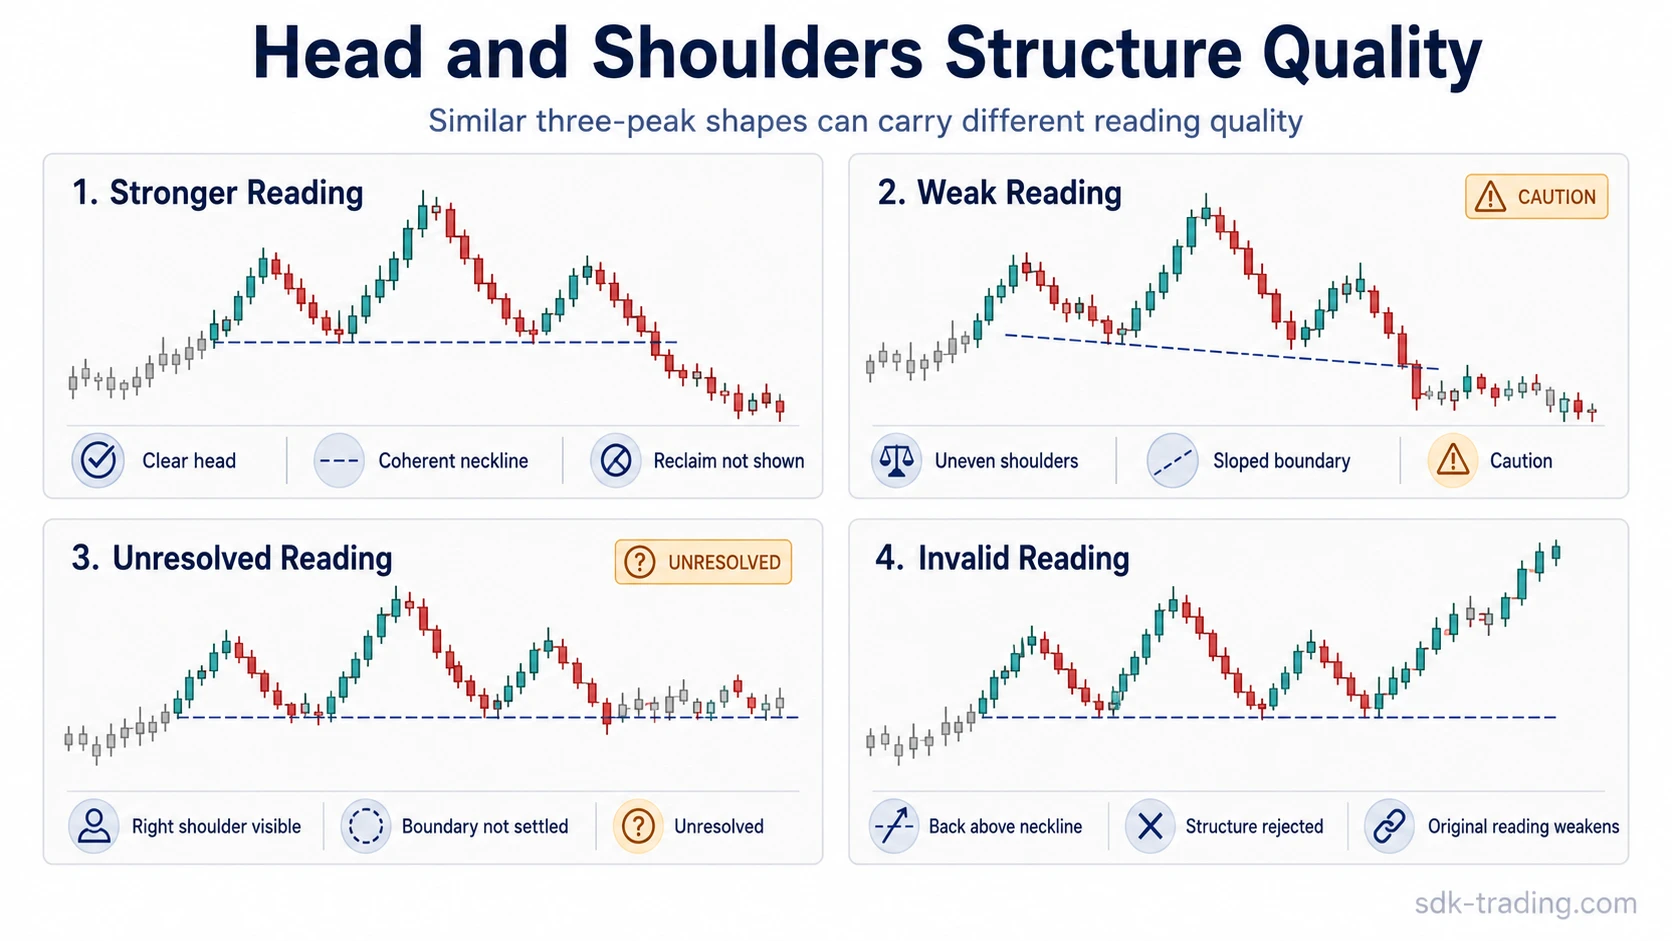
Clean, Weak, and Invalid Head and Shoulders Structures
A more useful reading starts by classifying the quality of the structure instead of naming the shape too early. A head and shoulders pattern can be clean, weak, unresolved, or invalid depending on what happens around the neckline and right shoulder.
| Structure Type | Typical Behavior | Reading Quality |
|---|---|---|
| Clean structure | Price forms a clear left shoulder, higher head, lower right shoulder, and coherent neckline, then later remains unable to reclaim the neckline area. | The reversal reading is structurally stronger, while still conditional on broader context. |
| Weak structure | The shoulders are uneven, the neckline is sloped or poorly defined, or the move beyond the neckline is brief and quickly contested. | The reading remains possible but needs more caution because the boundary is not being respected cleanly. |
| Unresolved structure | The right shoulder is visible, but price has not shown decisive behavior around the neckline. | The pattern is only a developing structure, not a completed reading. |
| Invalid or failed structure | Price returns above the neckline, rebuilds strength, or moves above the right-shoulder area in a way that rejects the reversal structure. | The original head and shoulders interpretation weakens or no longer fits the chart behavior. |
Head and Shoulders Identification Checklist
A useful identification process starts with structure before labels. The pattern should have a prior advance, three visible peaks, a higher middle peak, and a neckline that can be drawn from the reaction lows.
- Check that the pattern appears after a meaningful upward move.
- Confirm that the head is visibly higher than both shoulders.
- Draw the neckline from the reaction lows rather than from random intraday noise.
- Compare the right shoulder with the head to see whether upside pressure is fading.
- Watch whether later price behavior accepts or rejects the neckline area.
- Treat volume as supporting context only, not as mandatory proof.
Simple Head and Shoulders Example in Context
Price advances into a prior resistance area, reacts lower, then makes one higher test that becomes the head. The next recovery reaches a lower high instead of rebuilding the same upside pressure, while the reaction lows create a neckline that can be compared over time.
A quick wick through the neckline does not settle the reading. The structure becomes more coherent only if later candles struggle to reclaim that area and the right-shoulder region remains below the head. If price quickly returns above the neckline and rebuilds strength, the three-peak outline is weaker than it first appeared.
Head and Shoulders vs Double Top
A head and shoulders pattern has three peaks, with the middle peak rising above both shoulders. A double top has two main resistance tests without a higher middle peak. The confusion happens because both patterns can appear after an advance and both can involve a neckline or reaction-low boundary.
The practical distinction is the middle peak. If the chart has two similar resistance tests, the structure is closer to a double top. If it has a left shoulder, a higher head, and a lower right shoulder, the structure fits a head and shoulders reading more closely.
Head and Shoulders vs Inverse Head and Shoulders
The standard head and shoulders pattern is usually read as a topping structure after an advance. The inverse head and shoulders is the bottoming variant: it has three troughs instead of three peaks, with the middle trough lower than both shoulders.
The two patterns use similar anatomy, but the direction of the structure changes the interpretation. The standard version studies fading upside pressure; the inverse version studies whether downside pressure is losing control.
Common Mistakes When Reading the Pattern
A common mistake is naming the pattern as soon as three peaks appear. Shape alone is not enough. The structure needs a clear prior advance, a higher head, a readable neckline, and later behavior that supports the reversal interpretation.
Common mistake: Treating every neckline touch as structural completion. A neckline touch, wick, or brief break can still be a probe if price quickly returns into the prior structure.
- Forcing symmetry when the actual market structure is messy.
- Ignoring a neckline that slopes enough to make the boundary less clear.
- Calling the right shoulder too early before the lower high is established.
- Reading a brief neckline wick as completed behavior.
- Assuming the pattern has the same quality in every market condition.
Limitations and Reliability Boundaries
A head and shoulders chart pattern does not have universal reliability. Its quality depends on context, structure, and later acceptance or rejection around the neckline. A clean structure after an extended advance is different from a shallow three-peak shape inside a choppy range.
Volume can help when it supports the structure, such as weaker participation on the right shoulder or stronger activity near the neckline. It should not be treated as automatic proof. Price behavior around the boundary remains the central diagnostic input.
Among stock chart patterns, head and shoulders is best treated as a classification tool for market structure, not as a complete decision framework by itself.
FAQ
What does a head and shoulders chart pattern mean?
It means price has formed a three-peak reversal structure after an advance, with a higher middle peak and a neckline that helps judge whether upside control is weakening.
Does a head and shoulders pattern need a perfectly horizontal neckline?
No. A neckline can slope, but a strongly sloped or unclear neckline makes the reading more judgment-based and increases the need to compare later behavior around the boundary.
When is a head and shoulders structure weak?
It is weak when the shoulders are poorly defined, the neckline is unclear, or price briefly moves beyond the neckline but quickly returns back into the prior structure.
How is a head and shoulders pattern different from a double top?
A head and shoulders pattern has three peaks with a higher middle peak. A double top has two main resistance tests without a higher head between them.