A chart pattern failure occurs when price behavior after the pattern does not confirm the implication suggested by the pattern shape. The label may still describe the structure, but the reading weakens if price cannot hold the breakout, volume fades, the retest fails, or the market returns back inside the prior range.
Key Points
- A failed chart pattern is not simply a losing trade. It is a condition where the expected pattern reading loses support from later price behavior.
- The pattern can be visually valid but still fail if breakout acceptance, volume, retest behavior, or follow-through does not confirm the reading.
- False breakouts are one common failure mode, but chart pattern failure also includes weak continuation, failed retests, timeframe conflict, and broader context changes.
- The safer interpretation is conditional: the pattern reading becomes weaker, not automatically opposite or predictive.
What Chart Pattern Failure Means
A chart pattern failure means the later market behavior no longer supports the implication that traders often attach to the pattern. A breakout that cannot hold, a retest that fails, or a move that quickly returns inside the prior structure can weaken the original reading even if the pattern shape was drawn correctly.
The important distinction is between a pattern as a visual structure and a pattern as an accepted market reading. The visual structure may still exist on the chart. The failure begins when later behavior does not support the interpretation that the structure was expected to carry.
Working definition: A chart pattern failure is a loss of interpretive validity after a pattern forms, usually because price acceptance, follow-through, volume behavior, retest behavior, or broader market context contradicts the original reading.
This does not mean the pattern “predicts” the opposite move. It means the original pattern reading should be treated as weaker, less confirmed, or no longer usable without new evidence.
Pattern Forming vs Pattern Failing
A chart pattern can form before it becomes useful as an interpretation. The shape is only the first layer. The next layer is whether the market accepts the implication that the shape suggests.
| Stage | What it means | What can go wrong |
|---|---|---|
| Pattern forming | Price creates a recognizable structure, such as compression, a reversal shape, or a continuation structure. | The shape may be forced, unclear, or drawn on noisy movement without enough structure. |
| Pattern trigger | Price moves beyond the pattern boundary or reaches the area where traders expect confirmation. | The move may be a temporary break rather than accepted movement outside the structure. |
| Pattern acceptance | Price holds outside the boundary, follows through, or retests the area without quickly rejecting it. | Weak volume, failed retest, or poor continuation can reduce confidence in the reading. |
| Pattern failure | Later behavior contradicts the original implication and weakens the pattern reading. | Price returns inside the pattern, fails to continue, or context shifts against the original reading. |
When a Chart Pattern Reading Weakens
The edge case is a pattern that looks correct but does not receive acceptance after the expected break. This is where many failed readings begin: the shape is visible, but the next behavior does not support the expected implication.
Boundary condition: A pattern does not fail merely because price hesitates. It weakens when hesitation turns into rejection, failed acceptance, poor follow-through, or a return back into the previous structure.
For example, a breakout beyond a pattern boundary can still be weak if price cannot stay beyond that boundary. A single wick, a small close outside the pattern, or a brief move above the level may not be enough if the market immediately returns to the prior range.
Volume can also change the reading. Rising volume on the break may support the idea that participation expanded, but fading volume after the break can show that follow-through is not developing. The volume reading should stay conditional because volume alone does not prove the pattern will succeed or fail.
Chart Pattern Failure Conditions
Most chart pattern failures come from a mismatch between the pattern shape and the behavior that follows it. The conditions below do not guarantee failure, but they can reduce the quality of the original reading.
| Condition | Implication | Limitation |
|---|---|---|
| Weak or fading volume | The move may lack participation after the pattern boundary breaks. | Volume must be read with price result, not as a standalone verdict. |
| Poor follow-through after breakout | The market does not continue in the direction implied by the pattern. | Short pauses are not automatically failures; the problem is lack of acceptance. |
| Failed retest | The retest does not hold the broken boundary or quickly returns inside the prior structure. | Retest behavior depends on timeframe and volatility, so the boundary must be clear. |
| Return inside the pattern | The breakout or breakdown loses acceptance and the original reading weakens. | A return inside the structure does not automatically create an opposite reading. |
| Timeframe mismatch | A pattern visible on one timeframe may conflict with the structure on a higher or lower timeframe. | The higher timeframe is not always “right,” but conflict should reduce certainty. |
| Forced pattern drawing | The pattern may be a visual fit rather than a meaningful structure. | Ambiguous shapes should be treated as lower-quality readings. |
| Trend or market-regime conflict | The broader environment may not support the implication of the pattern. | Context can weaken a reading without fully invalidating the visible structure. |
| News or sentiment disruption | New information can override the pattern’s prior interpretation. | This should be handled as context change, not as proof that all patterns are unreliable. |
Common Misreads Behind Failed Patterns
A common misread is treating the first boundary break as confirmation by itself. The safer interpretation is that a break starts the confirmation test. It does not complete the reading unless price behavior after the break supports acceptance.
| Common misread | Safer interpretation |
|---|---|
| The pattern is visible, so the implication is active. | The pattern is only a structure until later behavior supports the reading. |
| A breakout means the pattern has worked. | A breakout needs acceptance, follow-through, or a clean retest to carry more weight. |
| A failed pattern predicts the opposite move. | A failed pattern mainly weakens the original interpretation. Any opposite reading needs separate evidence. |
| Failure means the pattern was drawn incorrectly. | A pattern can be drawn correctly and still fail if the market does not confirm it. |
| Low volume always means failure. | Low or fading volume is one warning condition, but it needs price-result context. |
False Breakout vs Chart Pattern Failure
A false breakout is one form of chart pattern failure, but the two terms are not identical. A false breakout focuses on price moving beyond a boundary and then failing to hold that movement. Chart pattern failure is broader because the reading can also weaken through poor follow-through, weak volume, failed retest behavior, timeframe conflict, or a change in market context.
Not every failed pattern begins with an obvious fakeout. Sometimes the break is technically clean, but the market does not continue, volume fades, or the retest does not behave as expected. The issue is not only the breakout; the full confirmation sequence did not develop.
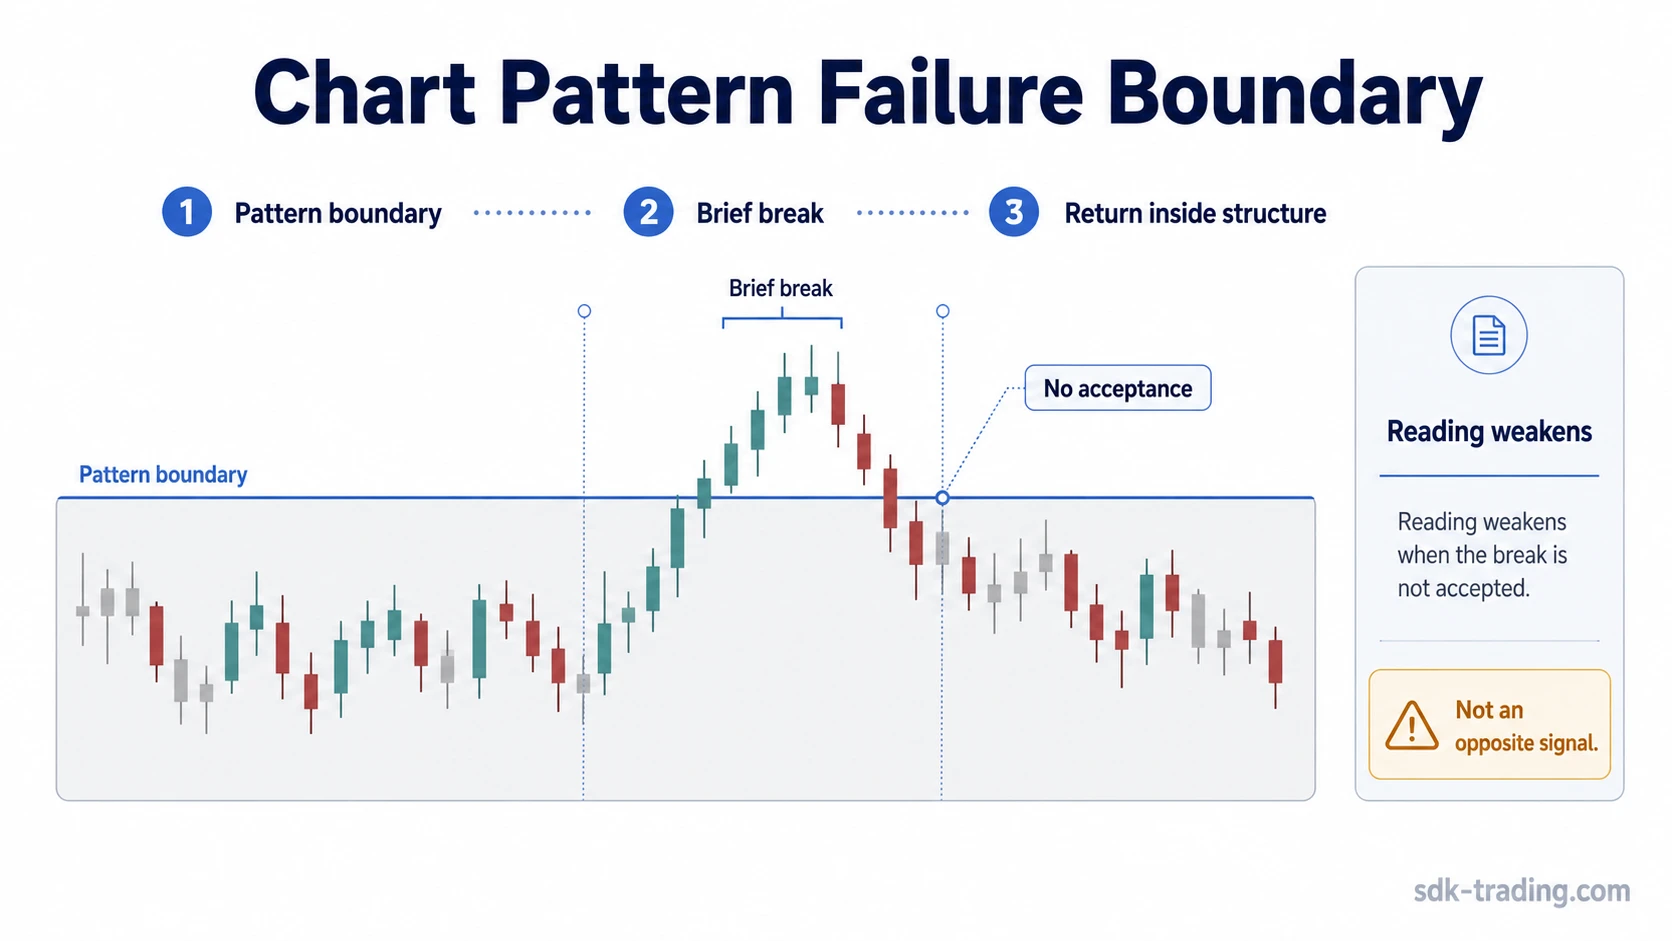
Example: Pattern Boundary Break That Does Not Hold
Consider a generic pattern where price compresses below a clear upper boundary, then closes slightly above it. At first, the structure appears to support a continuation reading. The next few candles, however, fail to extend the move. Volume fades, price returns below the boundary, and the retest does not hold.
In that scenario, the pattern label may still describe what formed on the chart. The reading has changed because the market did not accept the move outside the structure. The safer conclusion is not that the opposite move is guaranteed. The safer conclusion is that the original pattern implication has weakened and needs new evidence before it can be trusted again.
Illustrative takeaway: The failure is not the existence of the pattern. The failure is the lack of acceptance after the pattern boundary is tested.
How Specific Reversal Patterns Can Fail
Failure logic also applies to sharp reversal structures. A V-bottom pattern can lose quality if the rebound cannot hold, if the move stalls immediately after the initial reaction, or if the market returns into the prior decline structure.
A V-top pattern can weaken if the rejection is not accepted, if downside follow-through is poor, or if price quickly recovers back into the prior advance instead of confirming the reversal reading.
These examples do not make V-shaped patterns better or worse than other chart patterns. They show the same boundary principle: the pattern shape is only one layer, while acceptance and follow-through decide whether the reading remains useful.
How to Read a Failed Pattern Without Turning It Into a Signal
A failed chart pattern should be read as a change in evidence quality. It does not automatically create a trade, a reversal forecast, or a reliable opposite reading. The useful question is narrower: what part of the original reading stopped receiving confirmation?
If the problem is weak volume, the issue is participation. If the problem is a failed retest, the issue is acceptance around the boundary. If the problem is timeframe mismatch, the issue is conflict between local structure and broader context. If the problem is forced pattern drawing, the issue may be the original structure itself.
That distinction prevents the failure from becoming a new prediction. The useful reading separates condition, implication, and limitation before deciding whether the pattern still has interpretive value.
FAQ
Can a chart pattern be correct and still fail?
Yes. A pattern can be visually correct but still fail if later price behavior does not confirm the implication suggested by the structure. The failure is in the acceptance or follow-through, not always in the identification.
Is a failed chart pattern the same as a false breakout?
No. A false breakout is one type of failed pattern behavior. Chart pattern failure is broader and can also include weak volume, poor follow-through, failed retest behavior, timeframe conflict, or context changes.
Do failed chart patterns predict the opposite move?
No. A failed pattern weakens the original interpretation. An opposite move requires separate evidence and should not be assumed only because the first pattern reading failed.
When does a chart pattern lose validity?
A chart pattern loses validity when later behavior contradicts the expected reading. Common examples include failure to hold a breakout, fading volume, a failed retest, poor follow-through, or a return back inside the prior structure.