Stock chart patterns are repeated price structures that traders use to classify how a stock is moving across swings, boundaries, compression, and reaction areas. The useful starting point is not the pattern name. It is whether the visible structure is clear enough to group the move as continuation, reversal, compression, or sharp reversal behavior.
What Are Stock Chart Patterns?
Stock chart patterns are broader formations on a price chart, not single-candle events. They develop from swing highs, swing lows, trend boundaries, repeated reactions, failed breaks, and changes in volatility or compression.
A pattern label is only a classification tool. It does not prove what a stock will do next, and it should not be treated as a trading signal by itself. The label becomes useful only when the visible structure is consistent enough to support the classification.
Structure comes before the label:
A stock can look like it is forming a familiar pattern before the structure is clear. Boundaries, swing points, repeated reactions, and compression should be visible before the pattern name carries much weight.
How Stock Chart Patterns Are Grouped
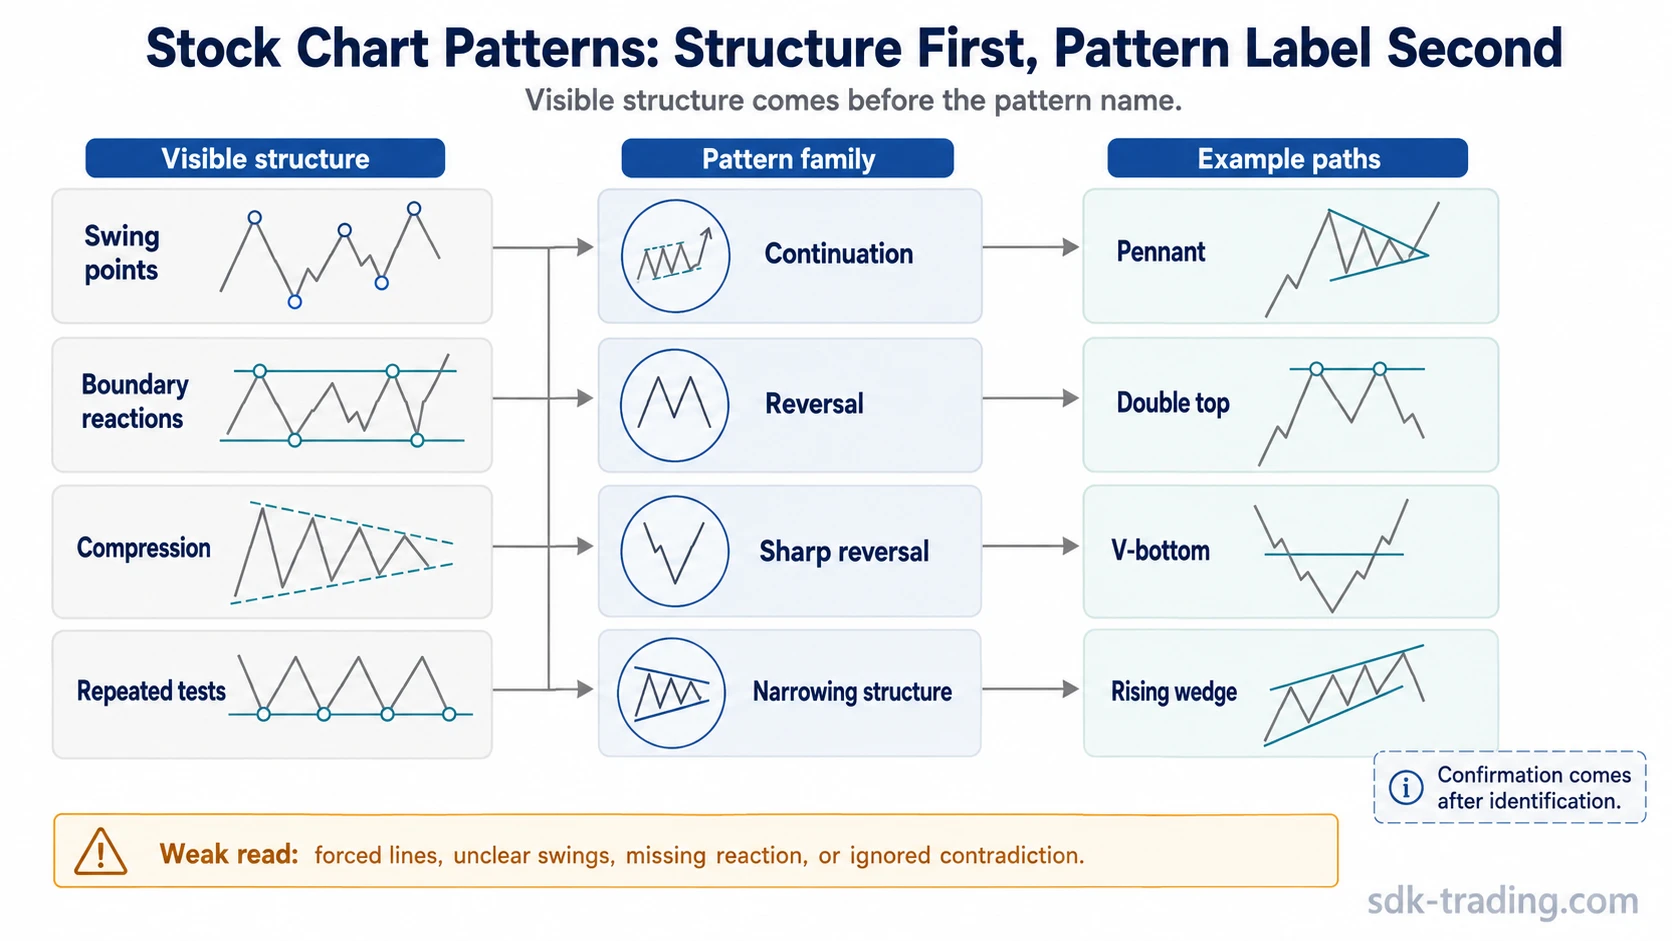
Stock chart patterns are easier to read when they are grouped by visible structure first. The same chart can look different depending on whether the dominant feature is a pause, a repeated rejection, a narrowing range, or a sudden turn after an extended move.
| Pattern family | Visible stock-chart structure | Cleaner classification when | Example path |
|---|---|---|---|
| Continuation | Price pauses after a prior move instead of immediately reversing. | Compression, clean boundaries, and repeated reactions are visible. | Pennant |
| Reversal | Price repeatedly fails around a boundary or reaction area. | Swings show rejection, loss of follow-through, and a clearer change in behavior. | Double top, triple top |
| Sharp reversal | Price changes direction quickly after an extended move. | The reversal structure is visible after the turn, not assumed before it forms. | V-bottom, V-top |
| Wedge or narrowing structure | Boundaries contract while price continues to grind inside the structure. | Repeated reactions respect the narrowing shape and the swings remain readable. | Rising wedge |
What Makes a Pattern Easier to Identify?
A stock chart pattern becomes easier to identify when the structure can be described without forcing the drawing. The clearest patterns usually have visible swing points, repeated reactions near similar areas, and boundaries that price has actually respected.
| Structure input | What to look for | Why it matters |
|---|---|---|
| Swing points | Readable swing highs and swing lows. | They show where the formation is actually developing. |
| Boundary reactions | Repeated reactions near a line, range, or zone. | A boundary with no reaction is usually a drawing, not a structure. |
| Compression | Narrowing movement, smaller swings, or reduced range. | Compression can help distinguish pauses and wedge-like structures. |
| Break behavior | A move outside the structure that is not immediately rejected. | Break behavior belongs to confirmation, not the first label. |
| Retest behavior | Price revisits a boundary after a break or failed break. | A retest can clarify whether the earlier structure is still being respected. |
Common Stock Chart Pattern Examples
Individual chart patterns should not be forced into one master list. It is more useful to connect each pattern name to the structure that supports it.
| Example | Structure to notice first | Useful distinction |
|---|---|---|
| Pennant structure | A prior move followed by short compression. | The shape matters less than whether the pause is readable. |
| Double top behavior | Two failed attempts around a similar resistance area. | The repeated reaction matters more than simply seeing two highs. |
| Triple top behavior | Several tests around a similar resistance boundary. | Extra tests can clarify the boundary, but they can also make the structure crowded. |
| V-bottom behavior | A sharp downside move followed by a fast reversal. | The turn should be visible after it forms, not assumed during the decline. |
| V-top behavior | A fast upside move followed by a sharp downside reversal. | The structure is different from a slow topping range. |
| Rising wedge structure | Higher movement inside narrowing boundaries. | The narrowing shape matters only if the reactions are readable. |
When a Stock Chart Pattern Read Is Weak
A weak pattern read usually starts with the label arriving before the structure. If the line has to be forced, the swings are unclear, or the boundary has not produced repeated reactions, the classification is thin.
| Weak-read condition | Why it weakens the classification |
|---|---|
| Forced line | The pattern depends on a drawing that price has not clearly respected. |
| Unclear swings | The structure does not show reliable swing highs or swing lows. |
| Missing boundary reaction | A line without reactions may be visual decoration rather than useful structure. |
| Contradictory structure | Nearby price behavior conflicts with the pattern label. |
| Confirmation confused with identification | Naming the pattern is not the same as confirming how price is behaving around it. |
Confirmation Is Separate From Identification
Identification means the visible structure is clear enough to classify. Confirmation is a separate step that looks at how price behaves after a boundary, break, failed break, or retest. Keeping those two ideas separate prevents the pattern label from doing too much work.
In stocks, gaps, earnings reactions, thin liquidity, and sudden volatility can distort a clean-looking pattern. Those conditions do not automatically invalidate every structure, but they make the context more important before interpretation.
Stock Chart Patterns FAQ
How do you identify stock chart patterns?
Identify stock chart patterns by looking first for visible swing points, boundaries, repeated reactions, compression, and break behavior. The pattern name should come after the structure is clear enough to classify.
Are stock chart patterns the same as candlestick patterns?
No. Stock chart patterns are broader formations built from multiple price swings and reactions. Candlestick patterns focus on one candle or a small group of candles.
Do stock chart patterns predict price movement?
No. A stock chart pattern does not predict price by itself. It is a way to classify visible structure. Interpretation still depends on confirmation, context, and whether the structure remains readable.
How to Use Pattern Labels Safely
A pattern label is most useful when it helps organize what is already visible: swings, boundaries, compression, reactions, and break behavior. If those parts are missing, the safer reading is to wait for clearer structure instead of forcing a familiar name onto the chart.