The Heikin Ashi formula calculates each candle from a mix of current raw OHLC data and previous Heikin Ashi values. The result is a smoothed candle, so the Heikin Ashi open and close are not the same as the raw period open and close.
Core idea: Heikin Ashi uses a calculated open, close, high and low to represent price movement in a smoother sequence. The formula explains how the candle is constructed; it does not prove trend direction, reversal, continuation, timing or trade quality.
Key Points
- Heikin Ashi close uses the average of the current raw open, high, low and close.
- Heikin Ashi open uses the previous Heikin Ashi open and previous Heikin Ashi close.
- Heikin Ashi high and low compare raw extremes with the calculated Heikin Ashi open and close.
- Heikin Ashi values can differ from actual traded OHLC prices.
- The formula is construction logic, not a trading rule.
Heikin Ashi Formula
The standard Heikin Ashi formulas are:
| Heikin Ashi value | Formula | What it uses |
|---|---|---|
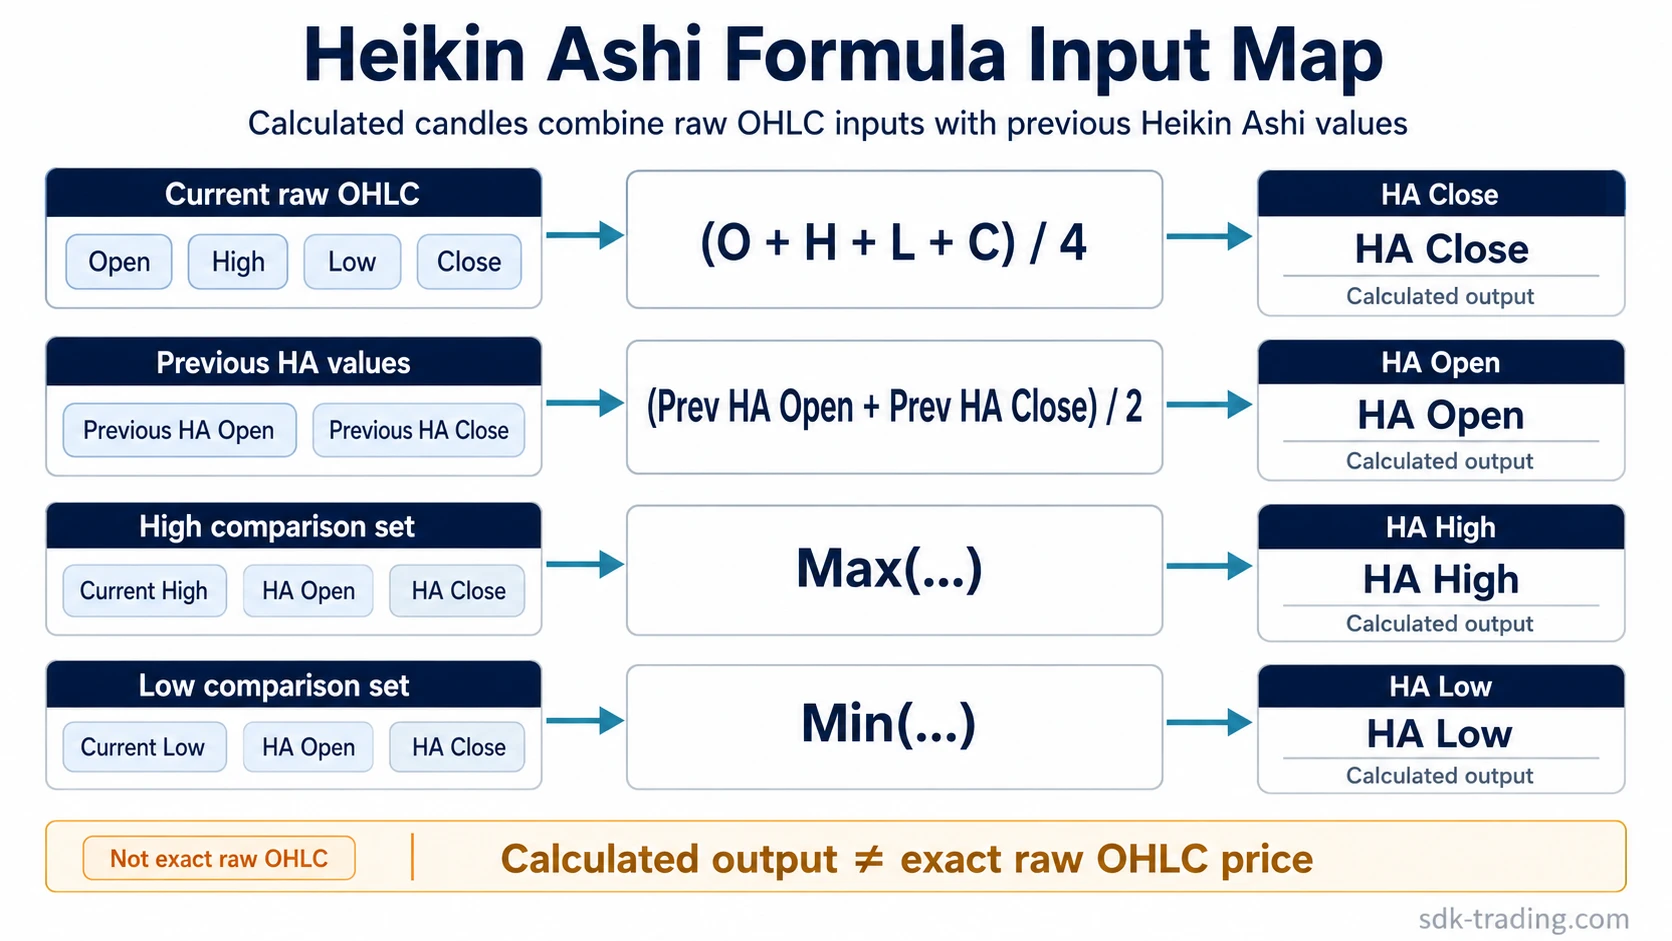
| HA Close | (Open + High + Low + Close) / 4 | Current raw candle OHLC |
| HA Open | (Previous HA Open + Previous HA Close) / 2 | Previous Heikin Ashi candle values |
| HA High | Max(Current High, HA Open, HA Close) | Current raw high plus calculated HA open and close |
| HA Low | Min(Current Low, HA Open, HA Close) | Current raw low plus calculated HA open and close |
These formulas mean that a Heikin Ashi candle is partly based on the current raw candle and partly based on the prior smoothed Heikin Ashi sequence. That is why Heikin Ashi candles can look cleaner than standard candles while still losing some exact raw-price detail.
How the Formula Uses Raw and Previous Candle Inputs
Each formula part uses a different input source. HA close is calculated from the current raw candle. HA open is calculated from the previous Heikin Ashi candle. HA high and HA low then choose the highest or lowest value from a small set that includes both raw and calculated values.
| Formula part | Main input source | Interpretation boundary |
|---|---|---|
| HA Close | Current raw open, high, low and close | It is an average of the current candle, not the exact market close. |
| HA Open | Previous HA open and previous HA close | It carries information from the prior smoothed sequence, not the exact market open. |
| HA High | Current high, HA open and HA close | It may match the raw high, but only after comparison with calculated values. |
| HA Low | Current low, HA open and HA close | It may match the raw low, but only after comparison with calculated values. |
First-candle caveat: the first Heikin Ashi candle needs an initial value because there is no previous Heikin Ashi candle yet. The starting candle is usually initialized from available raw candle data or a platform-specific convention. Because that starting value feeds later HA open calculations, the earliest candles should be treated as initialization context rather than a separate trading signal.
Raw Candle vs Heikin Ashi Candle
A raw candle records the actual open, high, low and close for the selected period. A Heikin Ashi candle transforms that data into a calculated representation. This changes how candle shape should be read.
| Candle type | Open | Close | High and low | Main reading issue |
|---|---|---|---|---|
| Raw candle | Actual period open | Actual period close | Actual period high and low | Shows exact OHLC for the selected period. |
| Heikin Ashi candle | Average of prior HA open and prior HA close | Average of current raw OHLC | Highest or lowest value among raw extremes and calculated HA values | Shows a smoothed representation that can differ from raw traded prices. |
This distinction matters because standard candlestick assumptions do not transfer perfectly to Heikin Ashi. A small Heikin Ashi body, long wick or clean color sequence is still a calculated chart observation, not direct proof of what raw price did inside the period.
Why Heikin Ashi Values Can Differ From Raw OHLC
Heikin Ashi smoothing comes from averaging and carrying prior calculated values forward. This can make chart sequences easier to visually inspect, but it can also obscure gaps, sharp intraperiod changes and the exact raw open or close.
Important boundary: a Heikin Ashi close is not the same as the actual market close. A Heikin Ashi open is not the same as the actual market open. The calculated candle can help organize price movement, but it should not be treated as exact OHLC data.
The broader Heikin Ashi method explains how these calculated candles are used as a charting lens beyond the formula itself.
Small Heikin Ashi Formula Example
Synthetic inputs can show the calculation without implying a real chart event, trade example or historical market case.
Example inputs: current raw candle open = 100, high = 110, low = 95 and close = 105. Previous HA open = 98 and previous HA close = 102.
- HA Close: (100 + 110 + 95 + 105) / 4 = 102.5
- HA Open: (98 + 102) / 2 = 100
- HA High: max(110, 100, 102.5) = 110
- HA Low: min(95, 100, 102.5) = 95
The calculated HA close is 102.5 even though the raw close is 105. That difference is the practical reason Heikin Ashi values should not be read as exact raw candle prices.
Common Heikin Ashi Formula Mistakes
| Mistake | Safer interpretation |
|---|---|
| Reading HA close as the actual market close | HA close is an average of current raw OHLC, so it can differ from the actual close. |
| Reading HA open as the actual market open | HA open comes from previous HA values, so it carries prior sequence information. |
| Treating smoother candles as confirmation | Smoothing can make movement easier to inspect, but it does not confirm direction by itself. |
| Using the formula as a strategy rule | The formula explains candle construction, not entry timing, exit timing or trade validity. |
| Reading body compression as proof of reversal | A compressed calculated body can be a diagnostic clue, but the full Heikin Ashi doji context depends on surrounding structure and follow-through. |
What the Formula Does Not Prove
The Heikin Ashi formula does not prove that price will continue in the same direction. It does not prove that a reversal has started. It does not identify exact entry or exit timing. It also does not measure trade quality, risk, reward or outcome.
Use the formula as a construction rule: it explains why Heikin Ashi candles look different from raw candles. Any interpretation still needs separate context, such as surrounding structure, volatility, trend behavior and confirmation from evidence outside the formula itself.
FAQ
Is Heikin Ashi close the same as the actual close?
No. Heikin Ashi close is calculated as the average of the current raw open, high, low and close. It can differ from the actual market close for that period.
Can the Heikin Ashi formula prove trend direction?
No. The formula defines how the candle is calculated. It can make a sequence look smoother, but it does not prove direction, continuation, reversal or timing.
Why can Heikin Ashi hide gaps?
Because Heikin Ashi values are averaged and partly dependent on prior calculated candles, the visual sequence can smooth over raw price gaps or make them less obvious than they are on standard candles.