Heikin Ashi patterns are candle-like display conditions on a smoothed Heikin Ashi chart, not direct copies of standard candlestick patterns. They can make trend persistence, weakening pressure, and transition easier to see, but the displayed open, close, gaps, and doji-like shapes are not the same as raw market candles.
A Heikin Ashi candle shows a calculated display of price behavior. That display may simplify noisy movement, but it can also hide details that matter when a trader needs exact raw opens, raw closes, gaps, or fast changes in acceptance.
Definition: A Heikin Ashi pattern is a repeated visual condition on a Heikin Ashi chart, such as a long same-color candle sequence, small-bodied transition candle, upper or lower shadow change, or doji-like pause. The pattern describes the smoothed display, not the exact raw candle that occurred in the market.
Key Points
- Heikin Ashi patterns are smoothed display behaviors, not standard candlestick-pattern equivalents.
- Long same-color candles with limited opposite shadow can show persistent displayed pressure.
- Small bodies, two-sided shadows, and doji-like candles can show transition, hesitation, or weakening display pressure.
- Raw OHLC values, gaps, and exact candle closes may be less visible on a Heikin Ashi chart.
What Heikin Ashi Patterns Show
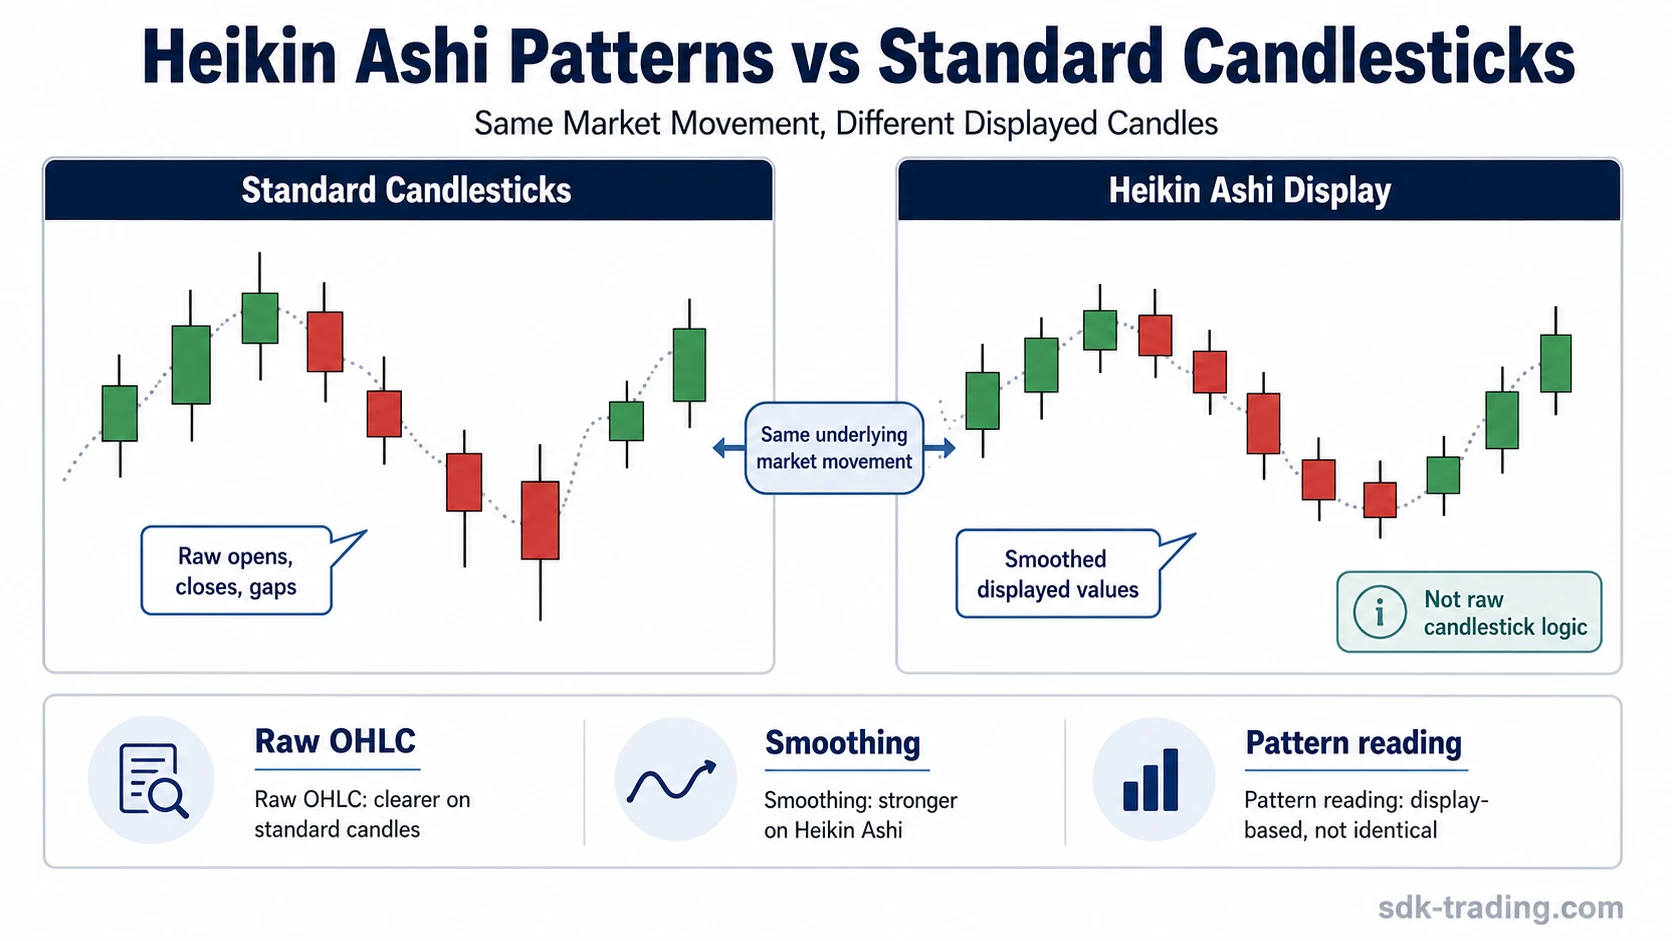
Heikin Ashi patterns show how price behavior looks after the chart applies its smoothing method. A normal candlestick chart prints each candle from raw open, high, low, and close data. A Heikin Ashi chart changes the displayed candle values, so the chart often looks cleaner than the underlying raw sequence.
Heikin Ashi pattern reading should therefore stay focused on display conditions. A long run of same-color candles may show persistent displayed pressure. A smaller body after that run may show that the displayed pressure is no longer as one-sided. A candle with shadows on both sides may show more two-sided movement than the earlier sequence.
Charting boundary: The pattern is the surface behavior. The construction explains why that surface can look smoother, later, or less precise than the raw candle sequence underneath it.
How to Read Common Heikin Ashi Pattern Conditions
The safest way to read Heikin Ashi candle patterns is to separate the condition from the implication and the limitation. The condition describes what appears on the chart. The implication describes what that display may suggest. The limitation keeps the reading from turning into a signal or prediction.
| Displayed condition | Possible implication | Important limitation |
|---|---|---|
| Several same-color candles with relatively strong bodies | Displayed directional pressure may be persistent. | The sequence does not prove continuation because the candles are smoothed and may lag raw price changes. |
| Same-color candles with little or no opposite shadow | The displayed move may look one-sided and cleaner than the raw candle sequence. | The absence of a visible opposite shadow does not mean the market had no two-sided movement inside the period. |
| Smaller bodies after a strong same-color sequence | Displayed pressure may be weakening or entering a transition phase. | A smaller body is not a reversal signal by itself; raw price behavior and later structure still matter. |
| Upper and lower shadows appearing after a clean sequence | The display may be showing more two-sided movement or less directional clarity. | Shadows on a Heikin Ashi chart should not be treated exactly like shadows on raw candlesticks. |
| Doji-like or very small-bodied Heikin Ashi candle | The display may be showing indecision, transition, or pressure balance. | A doji-like Heikin Ashi candle is not identical to a standard doji because the open and close are calculated differently. |
| Frequent color changes in a sideways area | The display may be reflecting unstable or choppy conditions. | Heikin Ashi smoothing can still produce misleading shifts when the underlying market has no clean directional structure. |
Why Standard Candlestick Patterns Do Not Transfer Directly
Standard candlestick patterns depend heavily on raw candle opens, closes, bodies, shadows, gaps, and relationships between one raw candle and the next. Heikin Ashi changes the displayed candle values, so the same visual label can carry a different meaning on a smoothed chart.
Transfer limitation: A pattern name can look familiar, but the data behind the candle is different. Reading Heikin Ashi patterns as if they were raw candlestick patterns can overstate precision and hide the role of smoothing.
Trend Persistence, Weakening Pressure, and Transition
Heikin Ashi patterns are most useful when they are read as a display of persistence or transition. A clean run of same-color candles can make directional movement easier to see. A shift toward smaller bodies, mixed shadows, or color changes can make the displayed movement look less stable.
The reading should remain conditional. A smoother chart can delay visible changes because the displayed candle uses calculated values. That means a clean Heikin Ashi sequence may continue to look orderly even after raw price has started to lose strength.
| Reading focus | Useful question | Safer interpretation |
|---|---|---|
| Persistence | Are same-color candles continuing with strong displayed bodies? | The displayed trend pressure may still be visually intact. |
| Weakening | Are bodies shrinking or shadows becoming more balanced? | The displayed move may be losing one-sided clarity. |
| Transition | Are color changes, small bodies, or doji-like candles appearing more often? | The chart may be showing a shift from persistent display behavior toward uncertainty. |
| Raw-price check | Does the underlying price chart confirm or contradict the smoothed display? | The Heikin Ashi display should not replace raw-price context when precision matters. |
For example, a doji-like Heikin Ashi candle can mark a visible pause in the smoothed display, but it should not be read as the same object as a standard raw-price doji. The deeper treatment belongs to Heikin Ashi Doji, where the focus is specifically on doji-like Heikin Ashi behavior.
Common Misreads and Limitations
A common mistake is treating a Heikin Ashi color change as if it automatically confirms a directional change. Color can help organize the visual sequence, but it does not remove the need to check the raw chart, nearby structure, and whether the market is trending or moving sideways.
Another mistake is assuming that a clean Heikin Ashi chart means the underlying move was clean. Smoothing can reduce visual noise, but that same smoothing can make gaps, abrupt opens, exact closes, and fast reversals less obvious.
Core limitation: Heikin Ashi patterns can clarify displayed pressure, but they can also reduce raw-price visibility. The more a reading depends on exact open, close, gap, or wick behavior, the more important it becomes to compare the smoothed display with raw candles.
Failure-Mode Example
Illustrative scenario: A Heikin Ashi chart shows a long same-color sequence followed by one small-bodied candle. The display looks like pressure is weakening, so the viewer may be tempted to treat the candle as a reversal clue. On the raw candlestick chart, however, price may still be holding above the same structure, or the exact close may not show the same weakness. In that case, the Heikin Ashi pattern is a warning to inspect the raw chart, not a standalone conclusion.
This is the practical boundary: the pattern can highlight a change in displayed behavior, but the raw chart is the check for whether that displayed change is also visible in the actual price sequence. Heikin Ashi can simplify the view, but simplification is not the same as confirmation.
Where Heikin Ashi Pattern Reading Has Limits
Heikin Ashi patterns are most useful when the goal is to observe displayed trend pressure, transition, or loss of smoothness. They are less useful when the decision depends on exact candle construction, gap visibility, raw open and close behavior, or precise intraperiod rejection.
A better reading process is to ask what the smoothed display is showing, then check where that display may be hiding raw-price detail. This keeps the pattern useful without turning it into a trading rule.
Practical reading sequence: identify the displayed condition, describe the possible implication, check the raw-price limitation, and avoid treating the visual pattern as a prediction.
FAQ
Are Heikin Ashi patterns the same as candlestick patterns?
No. Heikin Ashi patterns are based on smoothed displayed candles, while standard candlestick patterns are based on raw open, high, low, and close values. Some labels may look similar, but the construction is different.
What do small Heikin Ashi candles mean?
Small Heikin Ashi candles can show that displayed pressure is weakening or becoming less one-sided. They should not be treated as reversal signals without checking raw price behavior and later structure.
Why can Heikin Ashi hide gaps or exact closes?
Heikin Ashi candles use calculated values, so the displayed candle may not show the exact raw open, raw close, or gap behavior visible on a standard candlestick chart.
Can Heikin Ashi patterns predict trend continuation?
No. They can show persistent displayed pressure or a possible transition, but they do not predict continuation or reversal. The reading remains conditional because the candles are smoothed.