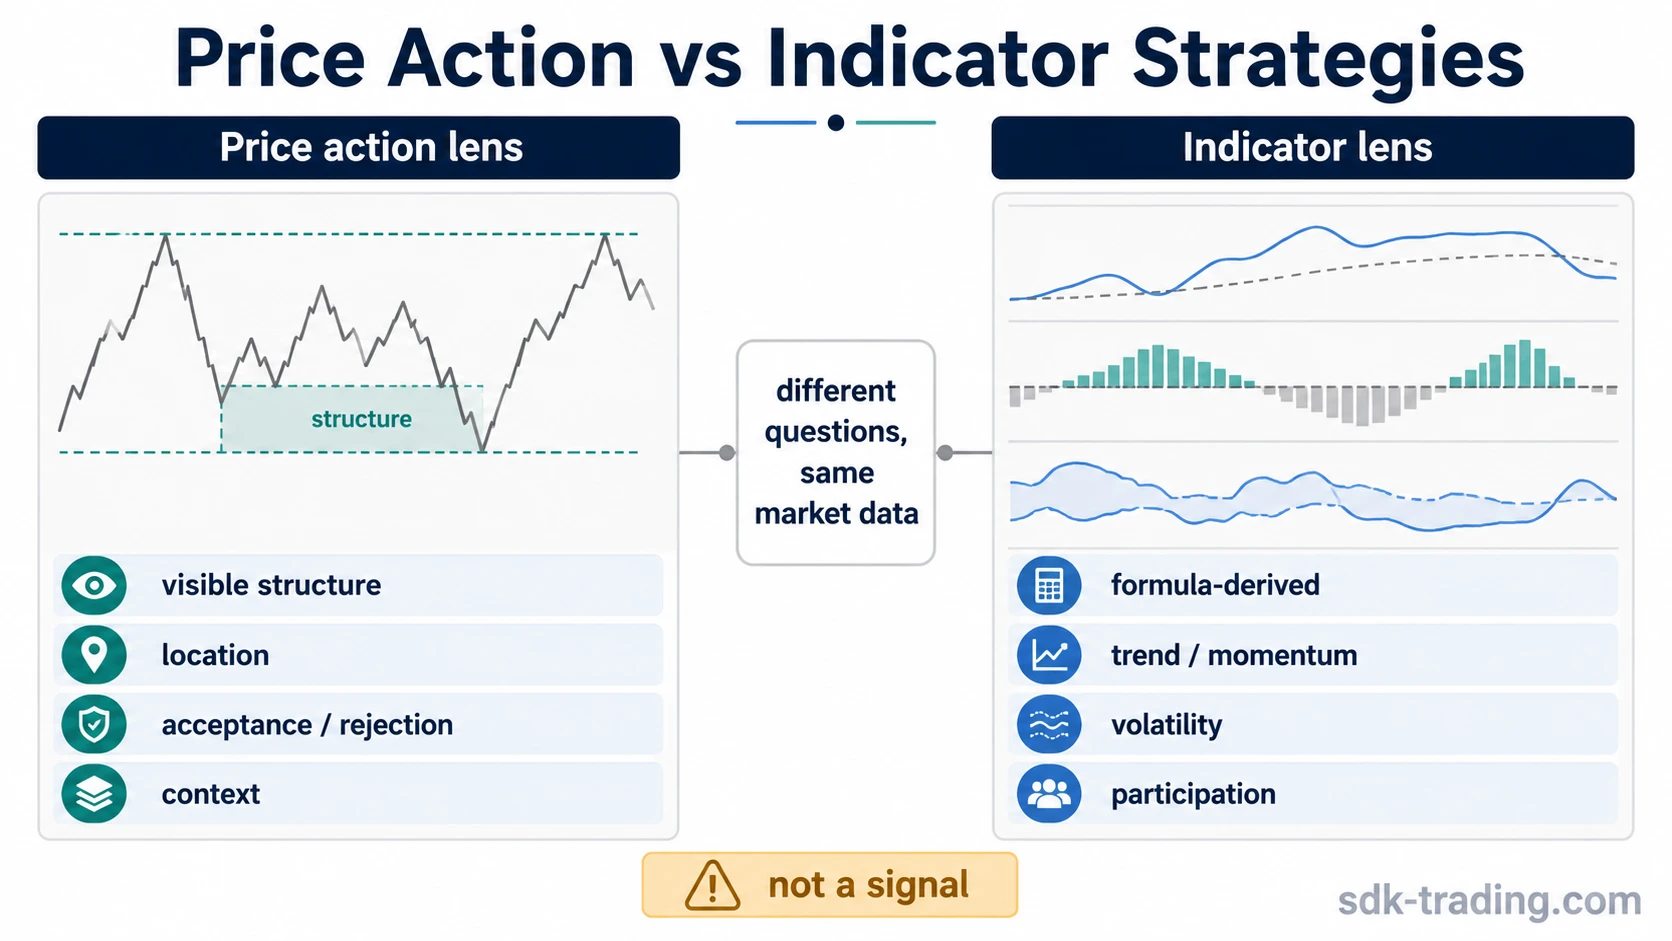
Price action strategies start from visible chart structure, while indicator strategies transform price, volume, volatility, or participation data into formula-based readings. Neither approach is automatically better. The useful distinction is what each one clarifies, where each one weakens, and how both can overlap without becoming a trade signal.
Quick distinction: price action reads market behavior directly through swings, ranges, breakouts, acceptance, rejection, and context. Indicator-based strategies read a calculated version of market behavior through tools that summarize momentum, trend, volatility, or participation. The stronger question is not which method wins, but which approach answers the decision question more clearly.
Price Action vs Indicator Strategies: The Core Difference
Price action strategies interpret what is visible on the chart. The focus is the sequence of movement: where price reacts, whether a level is accepted or rejected, whether a range is holding, whether a breakout attempt is sustained, and whether the current movement fits the surrounding structure.
Indicator-based strategies use formulas to transform market data into a standardized reading. A moving average smooths direction. An oscillator compresses momentum into a bounded range. A volatility band compares current movement with recent expansion or contraction. A volume-derived tool may summarize participation or pressure.
The difference is not raw price versus something unrelated to price. Indicators are usually built from price, volume, or volatility data. The difference is direct interpretation versus transformed interpretation. Price action stays close to chart structure. Indicators reorganize the same market behavior into readings that can be compared more consistently.
How Each Method Reads Market Information
Price action reading
Price action begins with visible behavior. It asks whether price is trending, ranging, compressing, rejecting a boundary, accepting a new area, or failing after an attempted move. The chart is treated as the main evidence source, and the meaning of a candle, swing, or breakout depends on where it appears.
A large candle near a range boundary can carry a different interpretation from a similar candle in the middle of loose consolidation. A breakout attempt can look stronger if price holds above the prior area, and weaker if price immediately returns back inside the range. The same visual feature can change meaning when the surrounding structure changes.
Indicator reading
Indicator-based strategies begin with a calculation. The indicator converts market data into a line, band, histogram, oscillator, or other standardized output. That output may summarize trend direction, momentum shift, volatility expansion, participation, or smoothing.
For example, a tool such as MACD does not create a separate market reality. It can help summarize price-derived momentum and trend behavior in a more standardized format.
Both methods become weak when used without definitions. A price action reading can become subjective if every swing or level is redrawn after the fact. An indicator reading can become mechanical if the formula is treated as meaningful without asking what market condition produced the reading.
Criteria for Comparing Price Action and Indicators
A useful comparison starts with decision criteria, not preference. Price action and indicators differ most clearly by input, processing method, timing sensitivity, repeatability, subjectivity, and the type of condition each one clarifies.
| Criteria | Price action strategies | Indicator-based strategies |
|---|---|---|
| Primary input | Visible chart behavior: swings, ranges, breakouts, rejection, acceptance, candle location, and sequence. | Formula-derived readings from price, volume, volatility, momentum, trend, or participation data. |
| Processing method | Interprets market behavior directly from the chart. | Transforms market behavior into a calculated reading that can be compared over time. |
| Timing sensitivity | Can react quickly to visible changes, but may also overread small or noisy movement. | Can smooth noise, but may respond after the first visible movement has already appeared. |
| Repeatability | Depends on consistent definitions for swings, ranges, levels, acceptance, and rejection. | Often easier to repeat because the formula and settings can be applied consistently. |
| Subjectivity | Higher when traders define structure, levels, or breakout quality differently. | Lower in calculation, but interpretation can still vary by settings, market condition, and context. |
| Where it helps | Location, structure, market context, failed movement, acceptance, rejection, and range behavior. | Momentum, trend smoothing, volatility comparison, participation review, and consistent condition checks. |
| Where it weakens | Choppy structure, vague boundaries, hindsight labeling, and overinterpreting isolated candles or swings. | Parameter sensitivity, delayed readings, duplicate signals, and treating a formula as more important than the market behavior behind it. |
| What it can miss | Subtle momentum or volatility changes that a standardized tool may reveal more clearly. | Precise location, failed acceptance, structural compression, and why a reading matters at that specific area. |
| How it can combine | Can define the structure, area, or behavior being studied. | Can summarize whether momentum, trend, volatility, or participation supports or conflicts with that structure. |
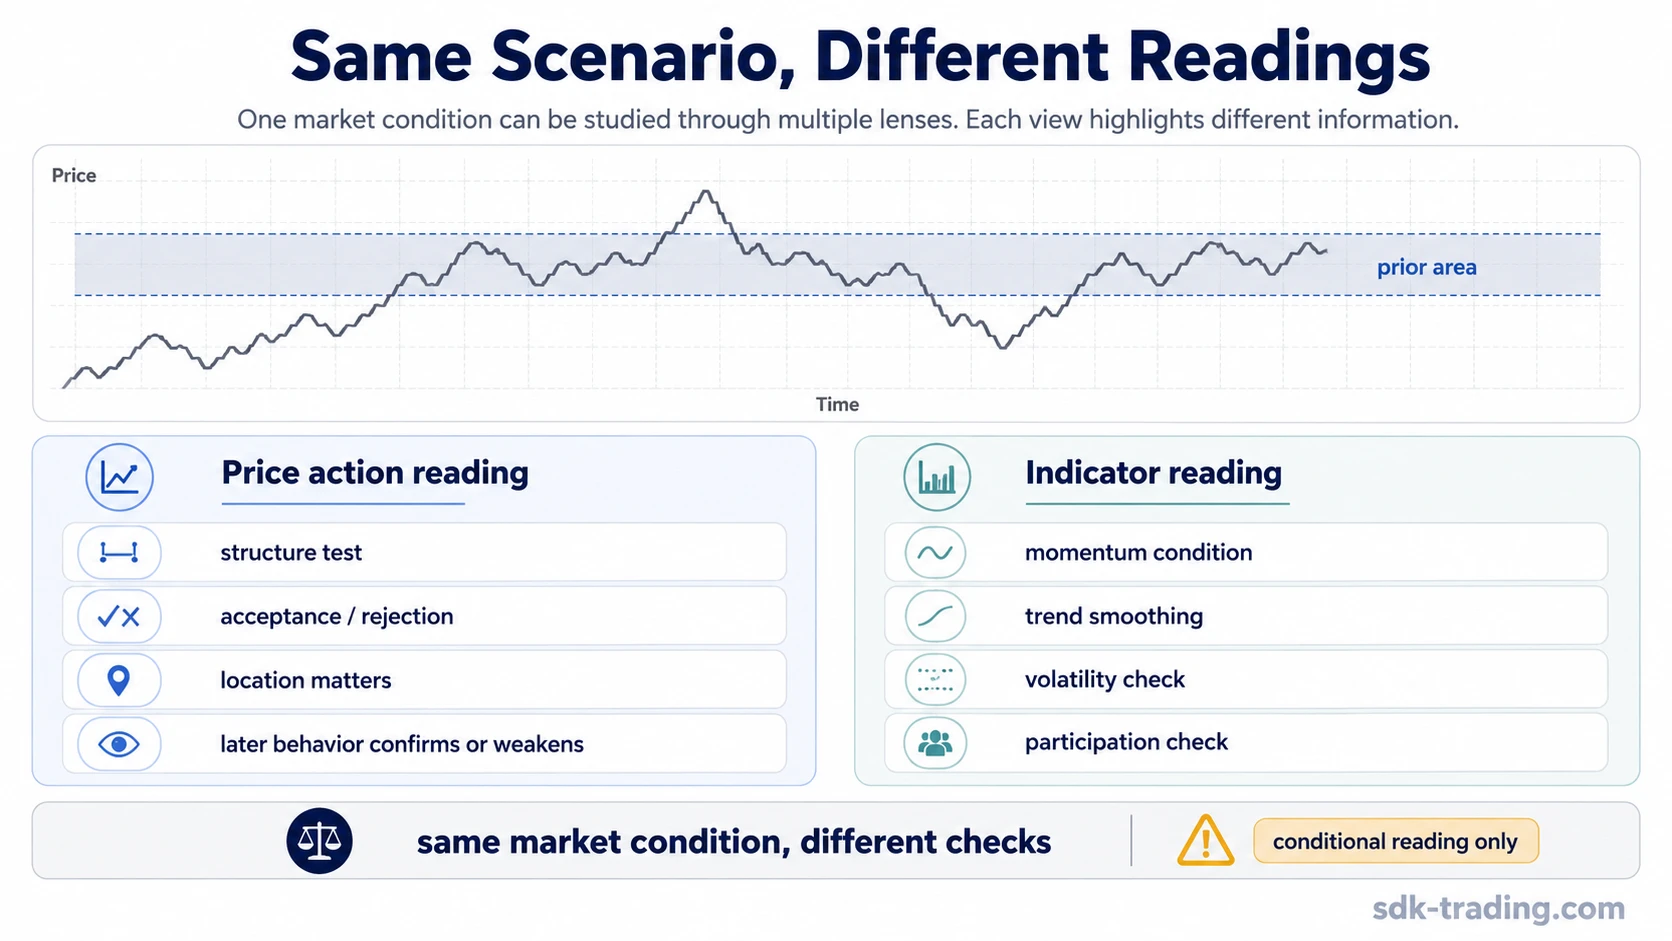
Same Market Scenario, Different Readings
Consider a market moving toward a prior resistance area after several attempts to push higher. The same condition can be studied through both approaches without turning either reading into a trade instruction.
Price action reading
Price action asks how price behaves around the prior area. It may focus on rejection, compression below the boundary, a move through the area that holds, or a move above the area that quickly returns back into the prior range.
If price moves above the area but fails to hold, the structure may show weak acceptance. If price compresses below the area and then begins holding above it, the structure may be changing. Both readings remain conditional because later behavior decides whether the first interpretation stays supported.
Indicator reading
An indicator-based reading asks what the calculated condition shows around the same area. Momentum may be strengthening, flattening, or fading. A smoothing tool may show whether the broader direction is still consistent. A volatility reading may show whether movement is expanding or contracting.
The indicator does not replace the location question. It adds a different check: whether the calculated condition agrees with, conflicts with, or adds nuance to the visible structure.
When Price Action Can Be Clearer
Price action can be clearer when the main question is about location or structure. If the market is testing a prior high, holding inside a range, rejecting a boundary, or returning back inside a failed breakout area, the chart location may be more important than a calculated reading.
Price action is usually clearer when the question is:
- whether a prior area is being accepted or rejected;
- whether a breakout attempt is holding or failing;
- whether price is compressing, ranging, or expanding;
- whether a candle or swing matters because of where it appears;
- whether a move is part of the current structure or just noise.
The weakness is that structure can be redrawn too easily. Without consistent definitions, price action can become hindsight labeling rather than repeatable analysis.
When Indicators Can Be Clearer
Indicators can be clearer when the main question is about a repeatable condition. A trader may want to know whether momentum is rising or falling, whether trend direction is being smoothed, whether volatility is expanding, or whether participation is changing.
Indicators are usually clearer when the question is:
- whether momentum is strengthening or weakening;
- whether a trend reading is smoother than raw swings;
- whether volatility is expanding or contracting;
- whether a condition can be measured the same way each time;
- whether a reading supports or conflicts with visible structure.
The weakness is that a clean formula can still be interpreted badly. Changing settings, stacking similar tools, or ignoring market context can make an indicator look more precise than it really is.
How Holding Period Changes the Comparison
Holding period changes what each method emphasizes. A very short-term reading may care more about immediate structure, reaction speed, and execution friction. A longer swing reading may care more about broader structure, trend context, and whether a condition remains consistent across more than one movement.
This is why the comparison should not be separated from the broader style being studied. A swing trading context may use wider structure and slower condition checks than a same-session approach, even if both use the same general concepts.
Where Price Action and Indicators Can Overlap
Price action and indicators often overlap because most indicators are derived from the same market behavior that appears on the chart. The practical question is whether the combination creates a clearer reading or just repeats the same idea in different forms.
| Combination | Cleaner use | Weaker use |
|---|---|---|
| Structure plus momentum | Price action defines the area being studied; momentum checks whether movement is strengthening or fading. | Momentum is treated as a standalone answer without asking where price is located. |
| Range plus volatility | The range defines the structure; volatility checks whether movement is compressing or expanding. | Volatility expansion is treated as directional by itself. |
| Trend plus moving average | Market structure defines the sequence; a moving average summarizes broader direction. | The moving average is treated as more important than acceptance, rejection, or structure. |
| Breakout attempt plus participation | The chart shows whether the area is being tested; participation checks whether activity supports the move. | Participation is read without checking whether price actually holds the new area. |
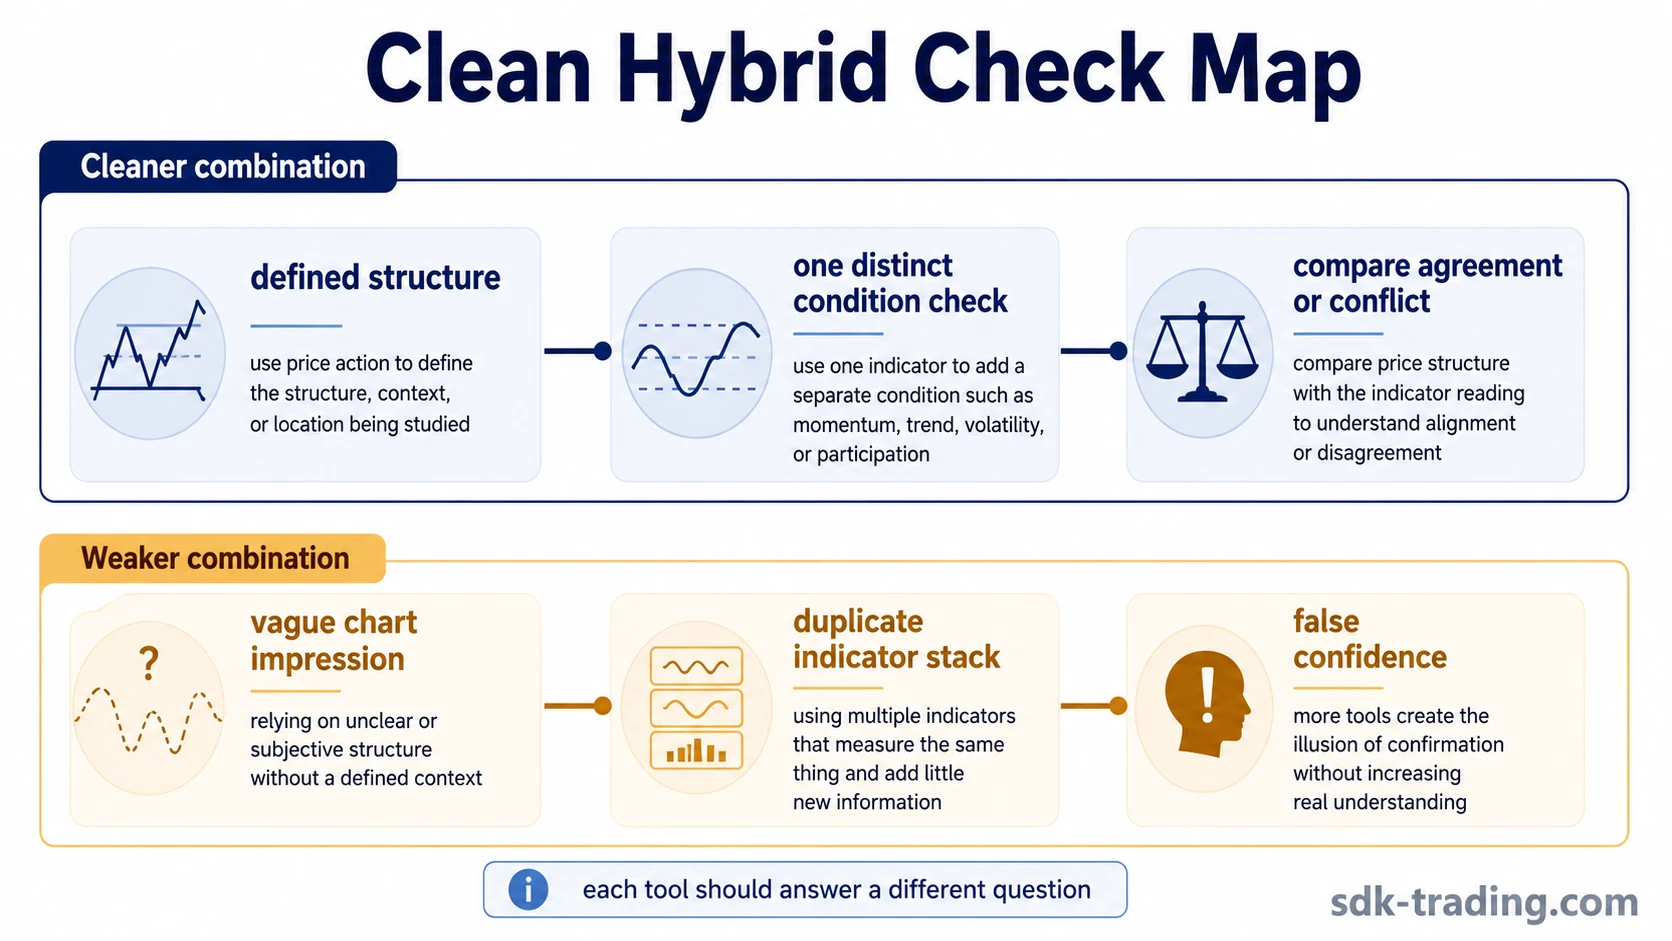
A cleaner hybrid process gives each tool one job. Price action can define the area, structure, or behavior. An indicator can add one condition check. The process becomes weaker when multiple indicators repeat the same calculation or when vague structure is used to justify any reading after the fact.
Common Misreads About Price Action and Indicators
Misread: indicators are separate market information
Most indicators transform existing price, volume, or volatility data. They may reveal a condition more clearly, but they are not independent from the market behavior that produced the data.
Misread: price action is always earlier and therefore cleaner
Price action can show visible movement quickly, but early movement can also be noisy. A fast reading is not automatically a stronger reading.
Misread: indicators are always late and useless
Many indicators lag because they smooth or transform data. That delay can be useful when the goal is to reduce noise, compare conditions, or avoid reacting to every small movement.
Misread: more indicators mean stronger confirmation
Several indicators can repeat the same underlying information. A stack of similar momentum tools may look like confirmation while adding little new evidence.
Misread: a cleaner chart means a stronger process
A chart without indicators can still be poorly defined. If structure, levels, and conditions are unclear, the reading can remain subjective even when the chart looks simple.
Misread: combining both automatically improves decisions
Combining both approaches helps only when each one answers a different question. It weakens when price action and indicators are used to justify the same conclusion after the fact.
Limitations of Both Approaches
Both approaches can fail when traders treat them as signals instead of interpretation tools. Price action can become vague when structure is not defined in advance. Indicator-based strategies can become fragile when settings are changed until they fit past examples.
Both also depend on market condition. A clean trend may make moving averages easier to interpret. A clean range may make price location more useful. A fast transition from range to expansion may weaken both readings until enough new behavior appears.
The safest comparison is conditional. Price action is not automatically more authentic because it is closer to the chart. Indicators are not automatically more objective because they use formulas. Both require definitions, context, and a clear reason for being used.
Price Action or Indicators: Which Method Fits the Question?
| Decision question | Method that may fit better | Reason |
|---|---|---|
| Where is the market reacting? | Price action | Location, acceptance, rejection, and structure are visible chart questions. |
| Is momentum changing? | Indicator-based reading | A momentum tool can standardize the condition and make changes easier to compare. |
| Is the move holding beyond a prior area? | Price action | The key issue is whether price accepts or rejects the new area. |
| Is volatility expanding or contracting? | Indicator-based reading | A volatility tool can summarize expansion or compression more consistently. |
| Is the structure clear enough to study? | Price action first | Without a defined area or sequence, an indicator may answer a poorly framed question. |
| Is the reading repeatable across many examples? | Indicator-based reading, with context | Formula and settings can be repeated, but the interpretation still depends on condition and location. |
The better method is the one that answers the specific question with the least confusion. In many cases, the cleanest process is not choosing one side permanently. It is defining the question first, then selecting the tool that answers that question most clearly.
FAQ
Are price action strategies better than indicator strategies?
No. Price action and indicator strategies answer different questions. Price action is usually more focused on structure and location, while indicators are more focused on standardized readings of momentum, trend, volatility, or participation.
Can price action and indicators be used together?
Yes, if each method has a clear job. Price action can define the structure being studied, while an indicator can summarize momentum, trend, volatility, or participation around that structure. The combination becomes weaker when several tools repeat the same idea.
Do indicators lag price action?
Many indicators smooth or transform market data, so they may respond after visible movement begins. That delay can reduce noise, but the reading still needs context from the chart structure.