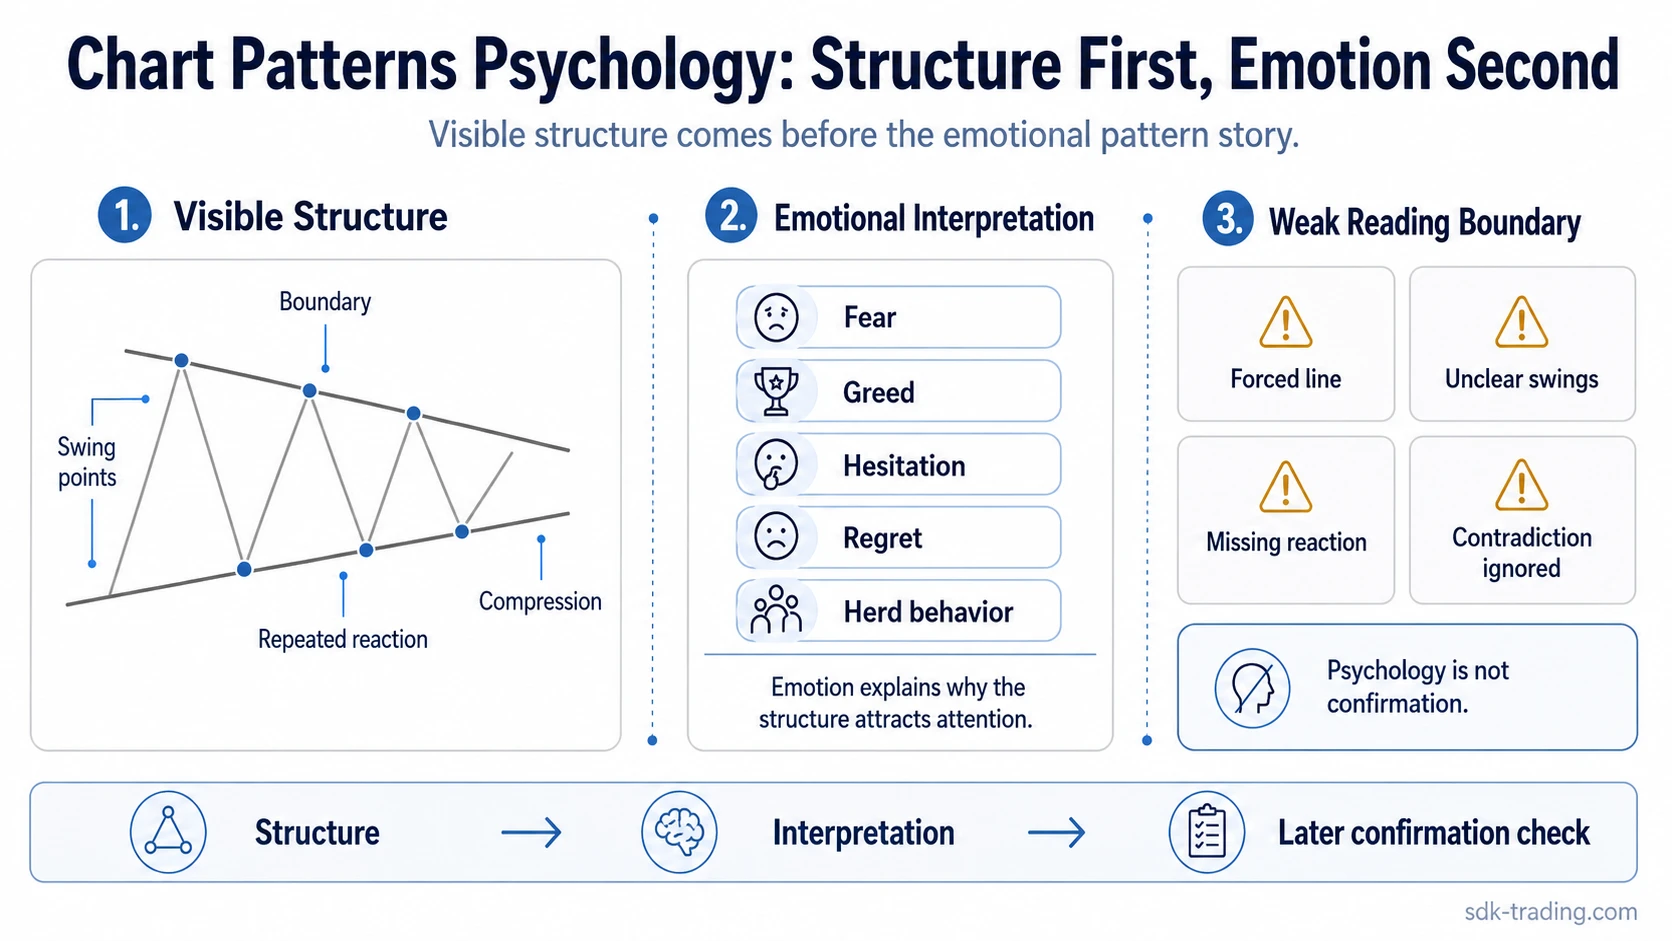
Chart patterns psychology becomes most useful when emotional pressure makes a trader label a pattern before the structure is clear. Fear, greed, hesitation, regret, and herd behavior can influence interpretation, but the label should come after visible boundaries, swing points, compression, or repeated reactions.
A chart pattern can reflect participant behavior, but psychology does not prove that the pattern will resolve in a specific direction. It is a descriptive layer. Structure comes first; the psychological explanation comes after the market has left something visible enough to read.
Key Points
- Chart patterns psychology is about interpretation, not prediction.
- Fear, greed, hope, hesitation, and regret can make unclear structure look cleaner than it is.
- Repeated boundaries, compression, and reaction behavior are stronger evidence than a familiar label.
- A weak pattern label often appears when the line is forced, swings are unclear, or contradictory structure is ignored.
What Chart Patterns Psychology Actually Explains
Chart patterns psychology explains why certain shapes attract attention. A repeated resistance area may show sellers defending a zone, buyers hesitating near the same price, or late participants reacting to a level that already carries memory. A narrowing range may show hesitation and reduced confidence before the next expansion attempt.
The psychological reading becomes more useful when it is tied to visible behavior: repeated reactions at a boundary, clearer swing points, compression, or a failed attempt to move beyond an obvious level. Without that structure, the explanation can become a story placed on top of a chart rather than a reading taken from the chart.
| Visible structure | Possible psychological trace | Reading limit |
|---|---|---|
| Repeated reaction near the same boundary | Participants may be remembering or defending an area | The boundary still needs clear reaction behavior, not only a drawn line |
| Compression before expansion | Hesitation may be building as neither side gains clean control | Compression does not say which side will gain control |
| Sharp move followed by emotional labeling | Fear or hope may make a reversal story feel obvious | The label is weak if swing structure has not formed |
| Failed break after a widely watched shape | Crowded expectation may have met poor follow-through | A failed break is context, not a complete trading decision |
| Volatility spike that makes the shape look dramatic | Urgency can make traders see a cleaner pattern than the chart supports | High volatility can distort boundaries and swing quality |
The Common Mistake: Labeling Emotion Before Structure
The common mistake is choosing a pattern name because the emotional story feels obvious. A sharp drop can feel like panic. A fast rebound can feel like a reversal. A long pause near resistance can feel like pressure building. Those impressions may be relevant, but they are not enough by themselves.
Mistake vs Safer Reading:
Mistake: “This looks like a reversal because the move feels exhausted.”
Safer reading: “The move may be emotionally stretched, but the pattern label remains weak until boundaries, swings, and reactions become visible.”
Label-first reading often turns a rough shape into a finished pattern too early. Structure-first reading asks whether the chart has enough visible evidence before the psychology is interpreted. The difference matters because the same emotional pressure can produce a clean reaction, a failed break, a volatile fakeout, or no useful structure at all.
How Market Memory Shows Up in Boundaries
Market memory appears when traders repeatedly react near similar price areas. A prior support area may attract attention again because some participants remember earlier demand, trapped positions, or missed opportunities. A prior resistance area may matter because sellers, late buyers, or risk managers respond to the same visible boundary.
That memory is not a guarantee. It is a reason to examine the reaction more carefully. Repeated touch points, cleaner swings, and compression near a boundary can make the psychological reading more grounded. A single dramatic move through a level can feel emotionally intense, but it may not create a useful structure if later behavior does not respect the area.
Accumulation and distribution language can help describe participation shifts, but it should stay tied to observable behavior. When price compresses near a boundary, the useful question is whether participation is becoming more organized or more unstable. A psychological label should not replace that structural check.
When Psychology Distorts Pattern Reading
Psychology can clarify why a structure attracts attention, but it can also distort the reading. The distortion usually appears when the trader wants the pattern to be complete before the chart has enough evidence.
Weak Reading Checks:
- Forced line: the boundary does not connect meaningful reactions.
- Unclear swings: the emotional story fills in structure that is not yet visible.
- Volatility-driven shape: a dramatic move makes the pattern feel cleaner than it is.
- Ignored contradiction: the preferred label becomes stronger than the evidence against it.
- Crowded label: many traders may see the same simple pattern before follow-through, failure, or boundary rejection is clear.
The safer habit is to treat emotion as a clue, not a conclusion. If the swings are unclear, the boundary is poorly defined, or the reaction is missing, the pattern name is doing too much work.
Practical Scenario: A Weak Pattern Label
A trader sees a sharp decline, then a fast rebound. The move feels dramatic, and the rebound creates pressure to call the structure a reversal pattern. The emotional story is easy to understand: panic may have pushed price lower, and buyers may be trying to regain control.
The weak reading begins if the label arrives before the structure. If the swing points are not clear, the lower boundary has not been tested, and one reaction already failed to hold, the pattern may be more emotional than structural. The chart may still become meaningful later, but the first label is only a hypothesis.
A safer reading starts with visible evidence: where the boundary is, how price reacts around it, whether compression appears, and whether later behavior supports or contradicts the initial idea. The psychological story becomes useful only after the structure gives it a place to stand.
Psychology Does Not Confirm the Pattern
Pattern psychology and pattern confirmation are different layers. Psychology can explain why traders pay attention to a boundary, why a failed break may create pressure, or why a sharp reversal can attract emotional labeling. It does not confirm that the structure is complete, and it does not turn the label into a trading signal.
Identification begins with visible structure. Psychology explains possible participant behavior behind that structure. Confirmation, if used, belongs to a separate process that checks later price behavior, acceptance, rejection, and contradiction. Mixing those layers is how a descriptive idea becomes false certainty.
Weak Reading Boundary:
A pattern label is weak when the line is forced, the swings are unclear, the boundary reaction is missing, or the trader ignores evidence that contradicts the preferred interpretation.
Related Pattern Structures
Sharp reversal structures often attract emotional labeling because the change in direction is visually dramatic. A V-bottom structure can look persuasive after a fast rebound, but the psychology still has to be separated from the evidence visible in the structure.
The same applies in the opposite direction. A V-top structure can make fear and regret feel obvious after a fast rejection, but the label is stronger when the chart shows clear reaction behavior rather than only a dramatic turn.
A Safer Way to Read Pattern Psychology
Start with the structure that can be seen. Then ask what participant behavior may explain it. The order matters because emotion is flexible: fear, greed, hope, and regret can be used to explain almost any chart after the fact. Boundaries, swings, compression, and reactions create a stricter test.
A practical structure-first check can use five questions:
- Are the boundaries visible without forcing the line?
- Are the swing points clear enough to support the label?
- Is compression or repeated reaction present?
- Could volatility be making the shape look cleaner than it is?
- What evidence would weaken the preferred interpretation?
When those questions are answered before the pattern is named, psychology becomes a useful interpretation layer. When the label comes first, psychology can become a reason to trust a shape the market has not clearly formed.