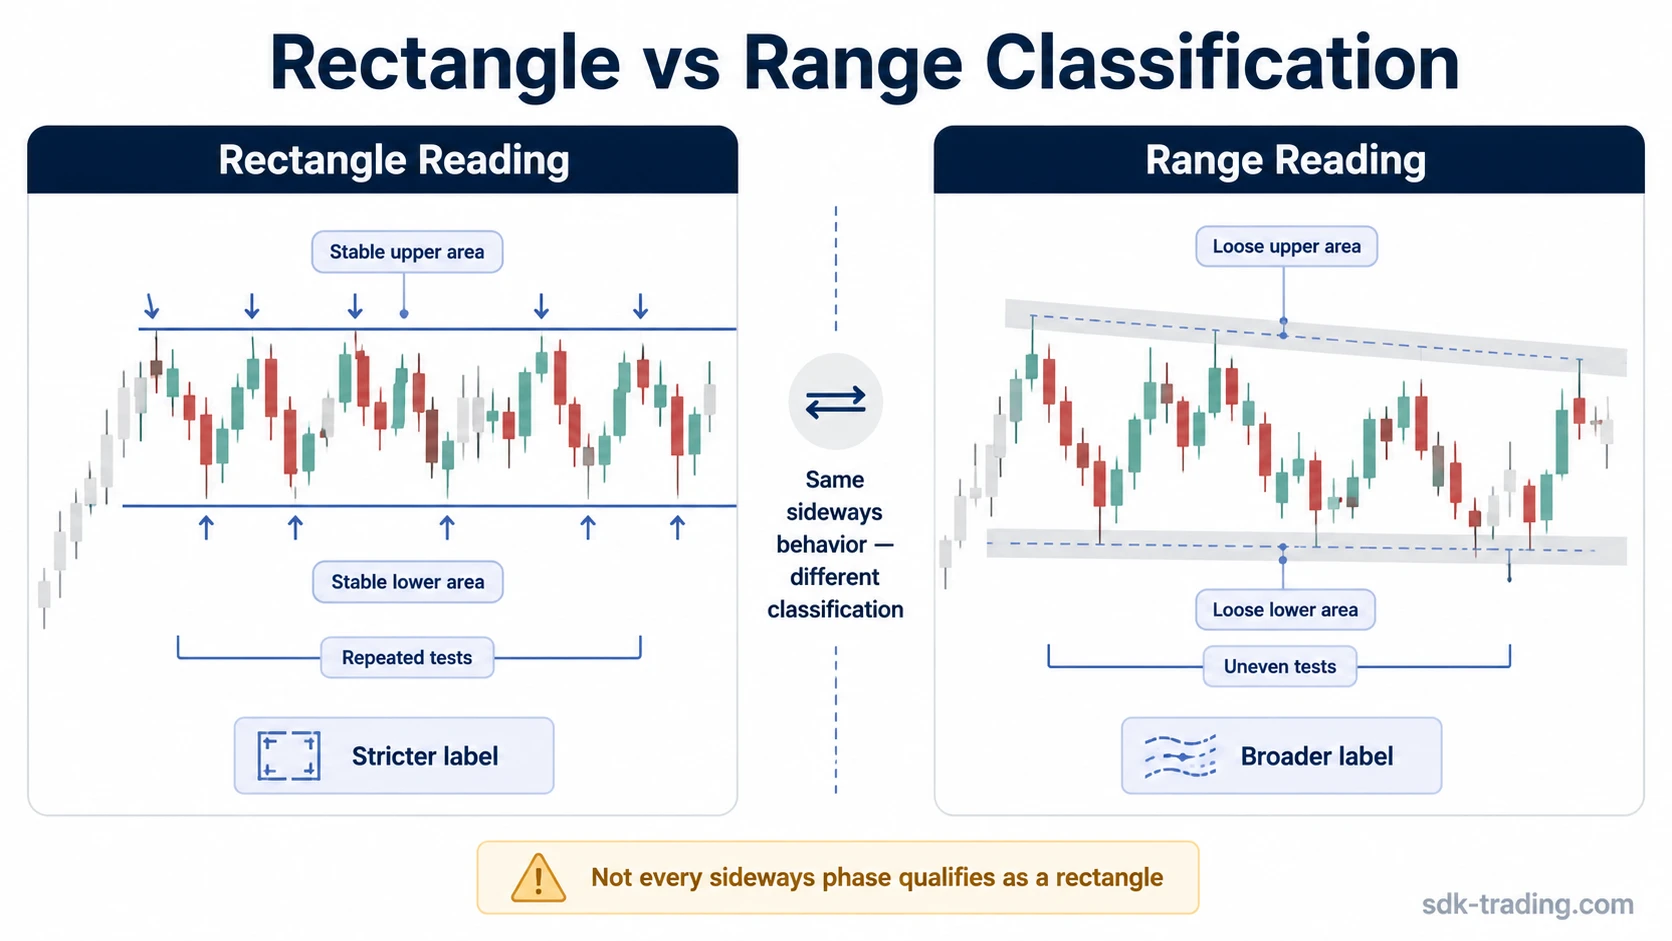
A rectangle is a stricter chart-pattern classification built around disciplined horizontal boundaries. A range is a broader sideways market condition where price rotates between upper and lower areas, sometimes without enough structure to qualify as a rectangle.
The confusion comes from the shared sideways behavior. Both can show stalled directional movement, repeated tests, and price rotating between upper and lower areas. The difference is the standard of classification: a rectangle asks for cleaner structure, while a range can describe looser containment.
Definition: In technical analysis, rectangle vs range separates a formal horizontal chart pattern from a broader sideways trading condition. The distinction helps describe price structure; it does not create an entry, exit, target, or outcome.
Key Points
- A rectangle is the stricter label because it depends on clearer horizontal edges and repeated tests.
- A range is the broader label because it can include sideways movement with looser or drifting zones.
- Boundary quality, prior movement, and test behavior decide whether the price action deserves the rectangle label.
- Neither label is a standalone trading signal.
Rectangle vs Range: The Core Difference
A rectangle reading needs more discipline than a general range reading. The formation should have a relatively stable upper edge, a relatively stable lower edge, and enough repeated interaction with both sides to make the box-like shape recognizable.
A range can be less formal. Price may still move sideways, but the edges can be wider, less tested, more uneven, or less connected to a clear continuation-pattern context.
The rectangle chart pattern is therefore best treated as a specific structure inside the wider family of sideways market behavior, not as a synonym for every sideways phase.
False-equivalence warning: Every rectangle contains range-like behavior, but not every range has enough horizontal discipline to be called a rectangle.
Rectangle vs Range Criteria
The cleanest distinction comes from checking the quality of the upper and lower zones, the context before the sideways phase, and how price behaves around the edges.
| Criterion | Rectangle Reading | Range Reading |
|---|---|---|
| Boundary precision | Upper and lower boundaries are relatively horizontal and repeatedly respected. | Edges may be wider, uneven, drifting, or only approximate. |
| Prior movement context | Often read after a directional move when price pauses in a more orderly structure. | Can appear after a trend, during choppy trade, or inside a broader sideways condition. |
| Repeated tests | Multiple tests help define both sides of the formation. | Tests may be irregular, shallow, or concentrated on only one side. |
| Edge stability | Overshoots are limited enough that the box-like shape remains disciplined. | Overshoots, undershoots, and shifting levels may make the containment less precise. |
| Classification purpose | Used to describe a specific horizontal chart pattern. | Used to describe broader sideways price behavior. |
| Interpretation risk | Risk comes from forcing a clean pattern claim onto an incomplete or messy formation. | Risk comes from treating broad containment as if it had pattern-level precision. |
| Safer wording | “The structure is forming a rectangle-like consolidation.” | “Price is trading in a range.” |
Why Traders Confuse Rectangles and Ranges
The two terms get mixed because both can describe a market that is no longer trending cleanly. Price moves sideways, reactions appear near upper and lower areas, and the chart may look boxed in.
The difference becomes clearer when the question changes from “Is price sideways?” to “Is the sideways movement organized enough to deserve a formal pattern label?” A range only needs a broad upper and lower area. A rectangle needs more evidence that those areas are stable enough to define the formation.
Common mistake: Calling the first visible sideways pause a rectangle can make the chart sound more complete than it is. A cleaner interpretation waits for edge quality, repeated tests, and context to support the label.
When Sideways Price Action Looks More Like a Rectangle
A sideways phase looks more like a rectangle when the upper and lower edges stay relatively consistent across several reactions. The market does not need perfect geometry, but the same price areas should remain relevant as the formation develops.
A stronger rectangle reading appears when price approaches the upper area, reacts, moves back toward the lower area, reacts again, and repeats that behavior without constantly redefining the box. A prior directional move can also make the pause easier to classify as a continuation-style rectangle, though the label still depends on the price action itself.
Volume, momentum, or later expansion can add context, but they should not replace the basic classification work. The first question is still whether the upper and lower zones are disciplined enough to support the rectangle label.
When Sideways Price Action Is Better Described as a Range
A range is usually the safer label when the market is sideways but the edges are not clean. Price may rotate between upper and lower areas, yet the reactions can be uneven, the tests can be inconsistent, or the zones can drift as new swings form.
That broader wording is useful when the chart shows balance or indecision without a pattern-quality formation. A range can still matter for interpretation because it shows where price is being contained, but it does not automatically become a rectangle.
Loose ranges are especially easy to over-label. A few highs near one area and a few lows near another area can describe containment, but a formal rectangle reading asks whether those areas are stable enough to define the shape.
Same Sideways Market, Different Reading
Price rallies, stalls, and starts rotating between an upper area and a lower area. At first, that only confirms sideways trade. The rectangle reading becomes more reasonable if later swings keep returning to the same upper and lower zones, with reactions that define both edges rather than constantly redrawing them.
The same movement is better described as a range if each reaction changes the map. A push above the prior upper area, a shallow pullback that never retests the lower side, and a later reaction from a lower high may still show containment, but the edges are too unstable for a clean rectangle label.
Example of a Basic Rectangle vs Range Reading: Price pauses after a directional move and trades between two visible areas. If the upper and lower edges remain stable through several rotations, “rectangle” may be the more precise structural label. If the edges keep shifting and the movement only shows broad containment, “range” is the more cautious label.
Clean, Weak, and Failed Classification
Classification quality matters because the label can make a messy chart sound cleaner than it is. A rectangle reading is strongest when the price action has enough repeated behavior to support the boundary claim.
| Reading Quality | What the Structure Shows | Safer Interpretation |
|---|---|---|
| Clean rectangle reading | Stable horizontal edges, repeated tests, and a recognizable boxed formation. | Rectangle is a reasonable classification. |
| Weak rectangle reading | Some sideways behavior, but one edge is unclear or tests are uneven. | Rectangle-like range is safer than a firm label. |
| Range reading | Price is contained broadly, but edges are loose or drifting. | Range describes the condition without overstating pattern precision. |
| Failed classification | The market quickly stops respecting the proposed boundaries. | The earlier label should be dropped or treated as unresolved. |
Common Mistakes With Rectangle and Range Labels
The first mistake is using the labels as if they mean the same thing. Rectangle is a narrower structural claim. Range is a broader condition claim.
The second mistake is treating a label as execution logic. A market can form a clean rectangle and still remain unresolved. A range can contain price for a long time without giving a clear directional answer.
The third mistake is demanding perfect geometry. Markets often overshoot and retest imperfectly. The practical issue is not whether every touch is exact, but whether the upper and lower zones remain stable enough to describe the formation honestly.
Label discipline: Use “range” when the market is broadly sideways. Use “rectangle” only when the sideways behavior has enough horizontal discipline to support a more specific pattern reading.
Limitations of the Rectangle vs Range Distinction
The distinction improves chart description, not prediction. A cleaner label can help organize what is visible, but it does not determine direction, timing, execution, or outcome.
Both labels can also change as new candles form. A loose range may become more rectangle-like after repeated boundary tests. A developing rectangle can lose that classification if price stops respecting the proposed edges.
Limitation: Rectangle and range labels describe structure. They do not replace confirmation, invalidation, risk control, or broader market context.
How to Use the Distinction Safely
Start with the broader description. If price is rotating sideways, “range” is usually the safer first read. Narrow it to “rectangle” only after the upper and lower zones stay stable through enough tests to make the box-like formation clear.
If the upper and lower areas are still changing, the cleaner conclusion is simple: price is ranging, but the rectangle classification remains unresolved.
FAQ
Is a rectangle the same as a trading range?
No. A rectangle is a more specific chart-pattern label built around clearer horizontal boundaries. A trading range is a broader sideways condition that may or may not become structured enough to classify as a rectangle.
Can a range become a rectangle?
Yes. A loose sideways range can become more rectangle-like if price repeatedly respects stable upper and lower boundaries. Until that structure appears, range is usually the safer label.
Does a rectangle predict direction?
No. A rectangle describes structure. Directional interpretation depends on later behavior, context, and confirmation, not on the label alone.
What makes a rectangle reading weak?
A rectangle reading is weak when the boundaries drift, tests are uneven, one side is poorly defined, or price quickly stops respecting the proposed structure.