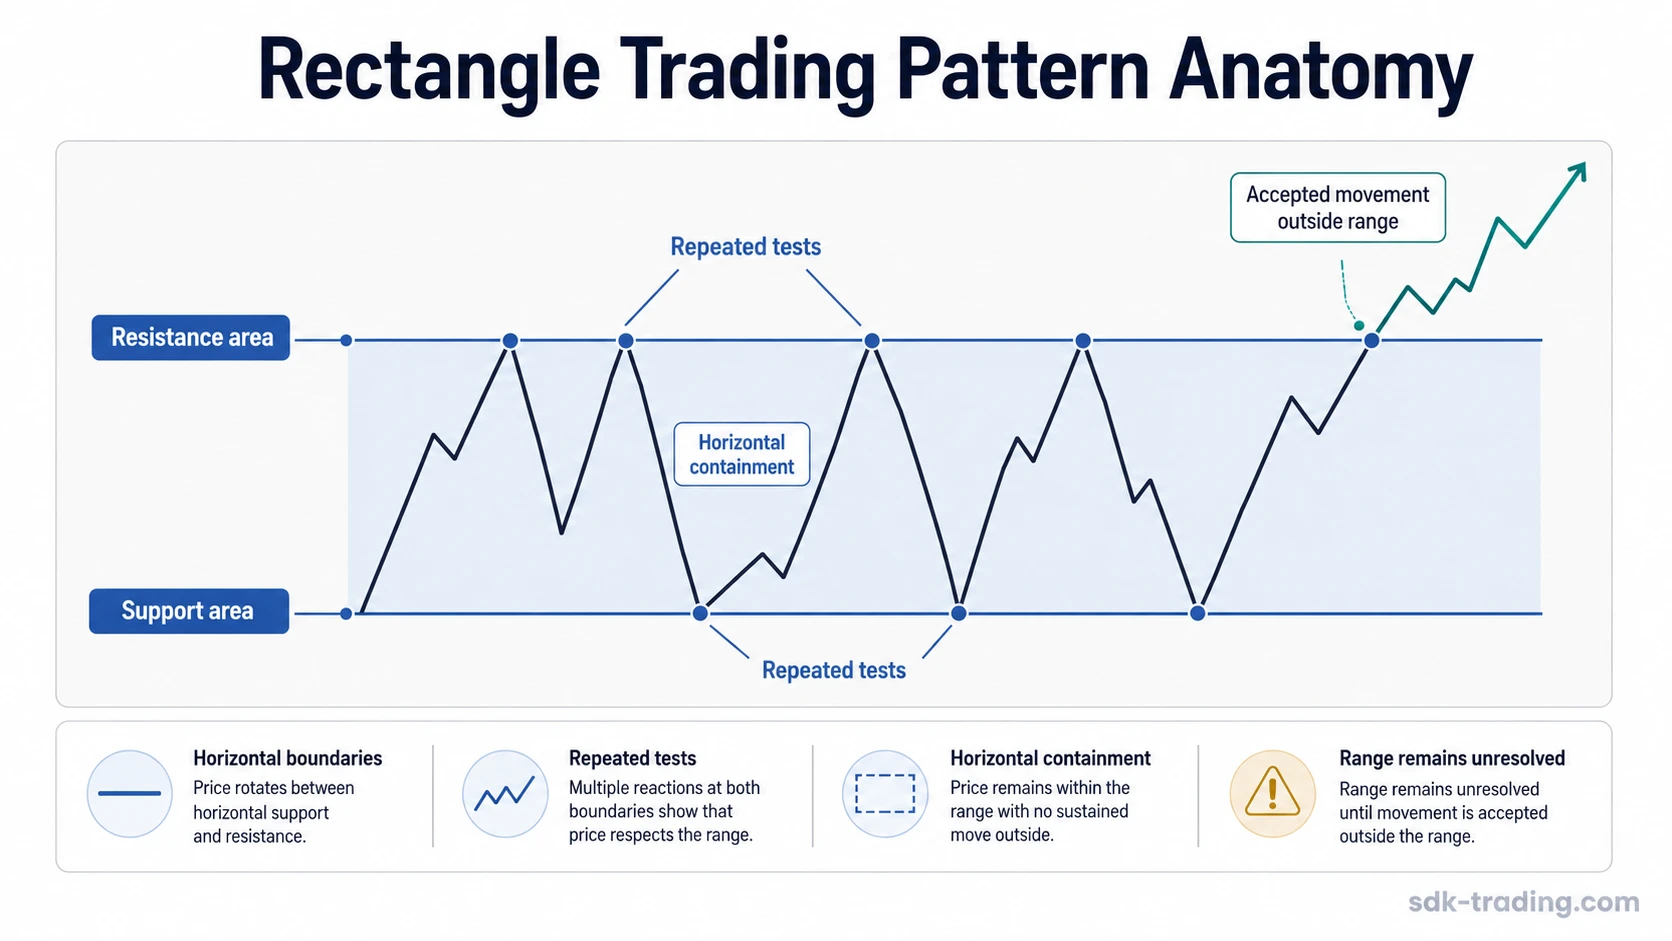
A rectangle trading pattern is a chart structure where price is contained between broadly horizontal support and resistance after repeated tests of both sides. The pattern shows temporary balance, not a confirmed direction. The structure becomes clearer only when price is accepted outside the range or fails back into it.
Definition: A rectangle trading pattern is a horizontal containment pattern formed by repeated movement between a similar upper boundary and a similar lower boundary. It reflects a period where neither side has gained clear control inside the range.
The important distinction is boundary quality. A clean rectangle has recognizable upper and lower limits that continue to matter as price tests them. A loose range may still move sideways, but its highs, lows, and reactions are less consistent.
Key Points
- A rectangle needs repeated tests near both horizontal boundaries, not one isolated high and low.
- The direction remains unresolved while price is still accepted inside the range.
- A wick beyond the boundary or a quick return into the rectangle is weaker evidence than accepted movement outside the range.
- Rectangle structure differs from flag and pennant structure because its containment is primarily horizontal.
What Is a Rectangle Trading Pattern?
A rectangle trading pattern forms when price repeatedly moves between a resistance area above and a support area below. The upper boundary limits advances, while the lower boundary limits declines. The structure becomes easier to classify when these boundaries remain broadly flat and continue to attract reactions over several swings.
The pattern can appear after an advance, after a decline, or during a larger sideways phase. That context may influence the interpretation, but the rectangle itself does not prove continuation or reversal. It only shows that price has entered a bounded area where both sides are still contesting control.
A rectangle structure carries more weight when the market respects the same broad area several times and then holds beyond the prior range. It remains less reliable when price only pierces a boundary briefly or immediately returns into the overlap.
How a Rectangle Forms on a Chart
A rectangle usually begins after a directional move loses momentum and price starts rotating between two visible levels. The first upper reaction creates a possible resistance area. The first lower reaction creates a possible support area. Later tests decide whether those areas are meaningful enough to classify the structure as a rectangle.
The formation is not only about shape. It is also about behavior inside the shape. Price should show repeated containment, comparable reactions near both boundaries, and enough time inside the range for the structure to become visible. A single pause or two-candle hesitation is usually too thin for a reliable rectangle label.
Participation note: Volume can support the reading when it helps show whether participation is expanding, fading, or shifting near the boundaries. Volume does not confirm direction by itself.
| Formation element | What to look for | Why it matters |
|---|---|---|
| Upper boundary | Several reactions near a similar resistance area | Shows that advances are repeatedly being limited in the same zone |
| Lower boundary | Several reactions near a similar support area | Shows that declines are repeatedly being absorbed or rejected in the same zone |
| Containment | Most price action remains inside the two boundaries | Separates a rectangle from random sideways noise |
| Boundary quality | Broadly horizontal limits, not steeply sloped or converging lines | Preserves the rectangle classification instead of drifting into another pattern |
| Resolution evidence | Accepted movement outside the range or failed return into it | Helps separate a completed structural reading from an unresolved range |
How to Identify a Rectangle Pattern
Start with the boundaries, not with the expected outcome. A rectangle needs enough interaction with both sides of the range to show that the market is responding to the same broad areas. Two upper tests and two lower tests are often a useful minimum for classification, although the shape does not need to be perfectly symmetrical.
Next, check whether the boundaries are broadly horizontal. Slight variation is normal because markets rarely turn at exact prices. The classification weakens when the upper line slopes strongly, the lower line slopes strongly, or both sides compress toward each other.
| Check | Cleaner rectangle evidence | Weaker evidence |
|---|---|---|
| Boundary tests | Repeated reactions near both the upper and lower boundary | Only one clear test on either side |
| Boundary shape | Broadly flat support and resistance | Strongly sloped or converging boundaries |
| Internal behavior | Price rotates inside the range without losing the containment structure | Price becomes too jagged to respect the range |
| Boundary breach | Movement is accepted outside the prior range | Only a wick breaks the boundary before price returns inside |
| Classification discipline | The label remains conditional until structure supports it | The pattern is forced because price has moved sideways |
Clean, Weak, and Invalid Rectangle Readings
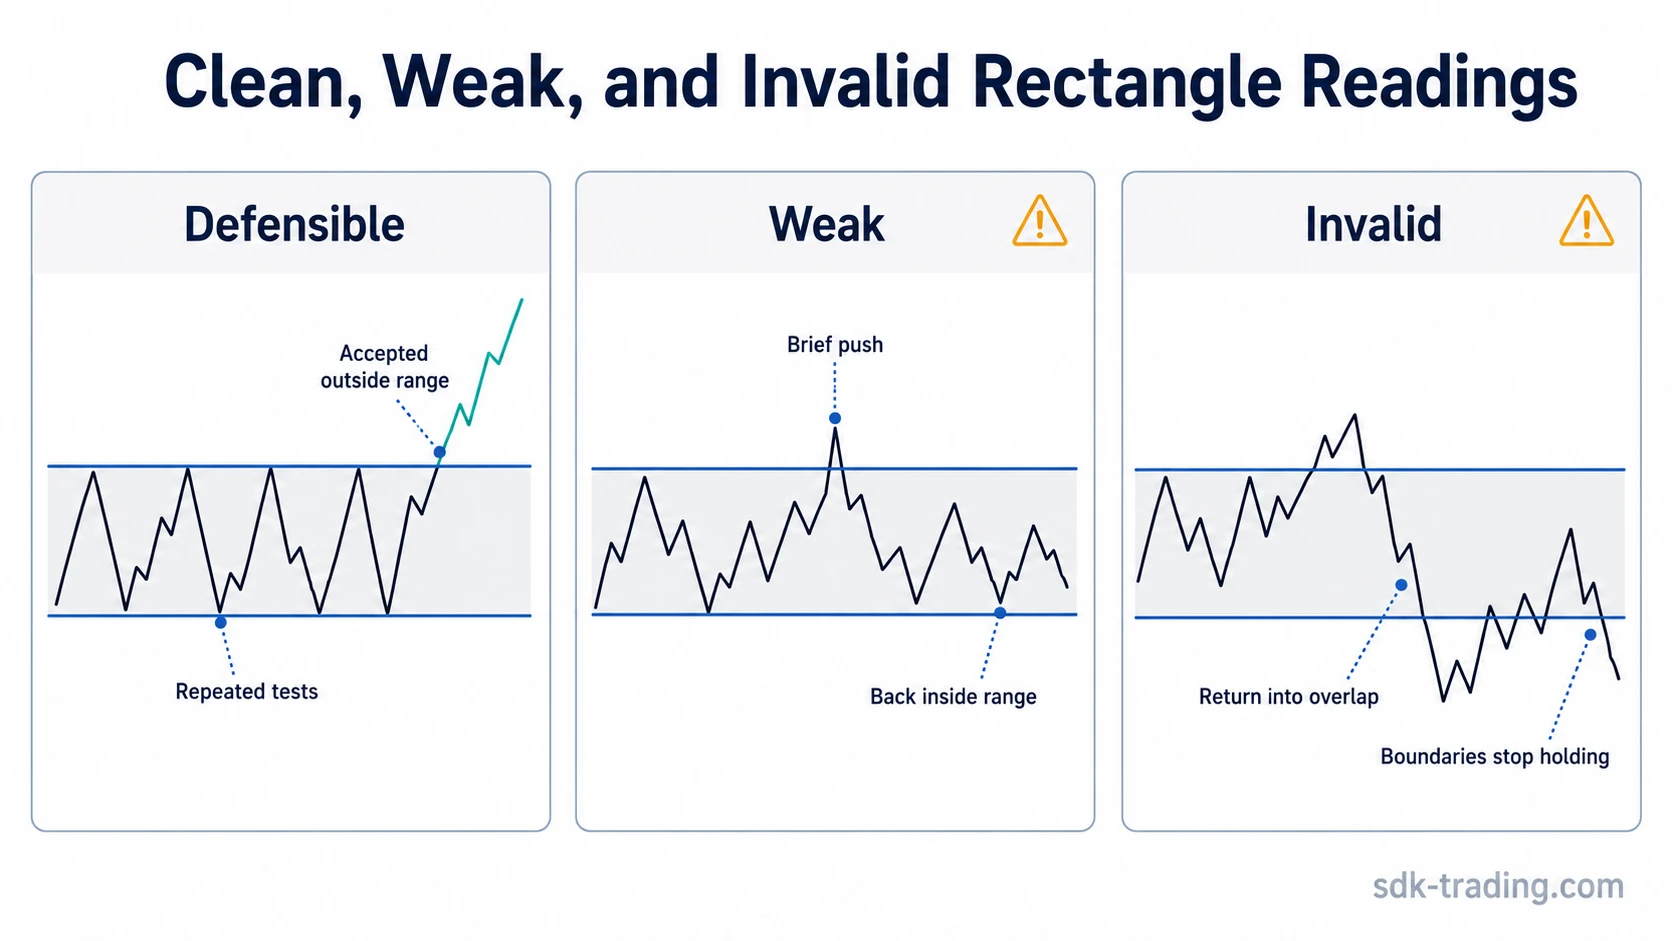
The rectangle label is most useful when it separates structure quality from the direction of the next move. A clean shape does not guarantee a clean resolution. A weaker shape can still move, but the classification carries less structural weight.
| Reading quality | Typical structure | Boundary evidence | Interpretation |
|---|---|---|---|
| Clean rectangle | Flat upper and lower boundaries with repeated tests | Price respects the range, then shows accepted movement outside it | The rectangle classification is structurally defensible |
| Weak rectangle | Some horizontal containment, but tests are uneven or jagged | A wick or brief push breaks the boundary without clear acceptance | The structure may still be a range, but the rectangle label needs caution |
| Invalid rectangle | The range loses horizontal containment or stops respecting both sides | Price breaks and returns into overlap, or the boundaries no longer function | The label no longer describes the current structure cleanly |
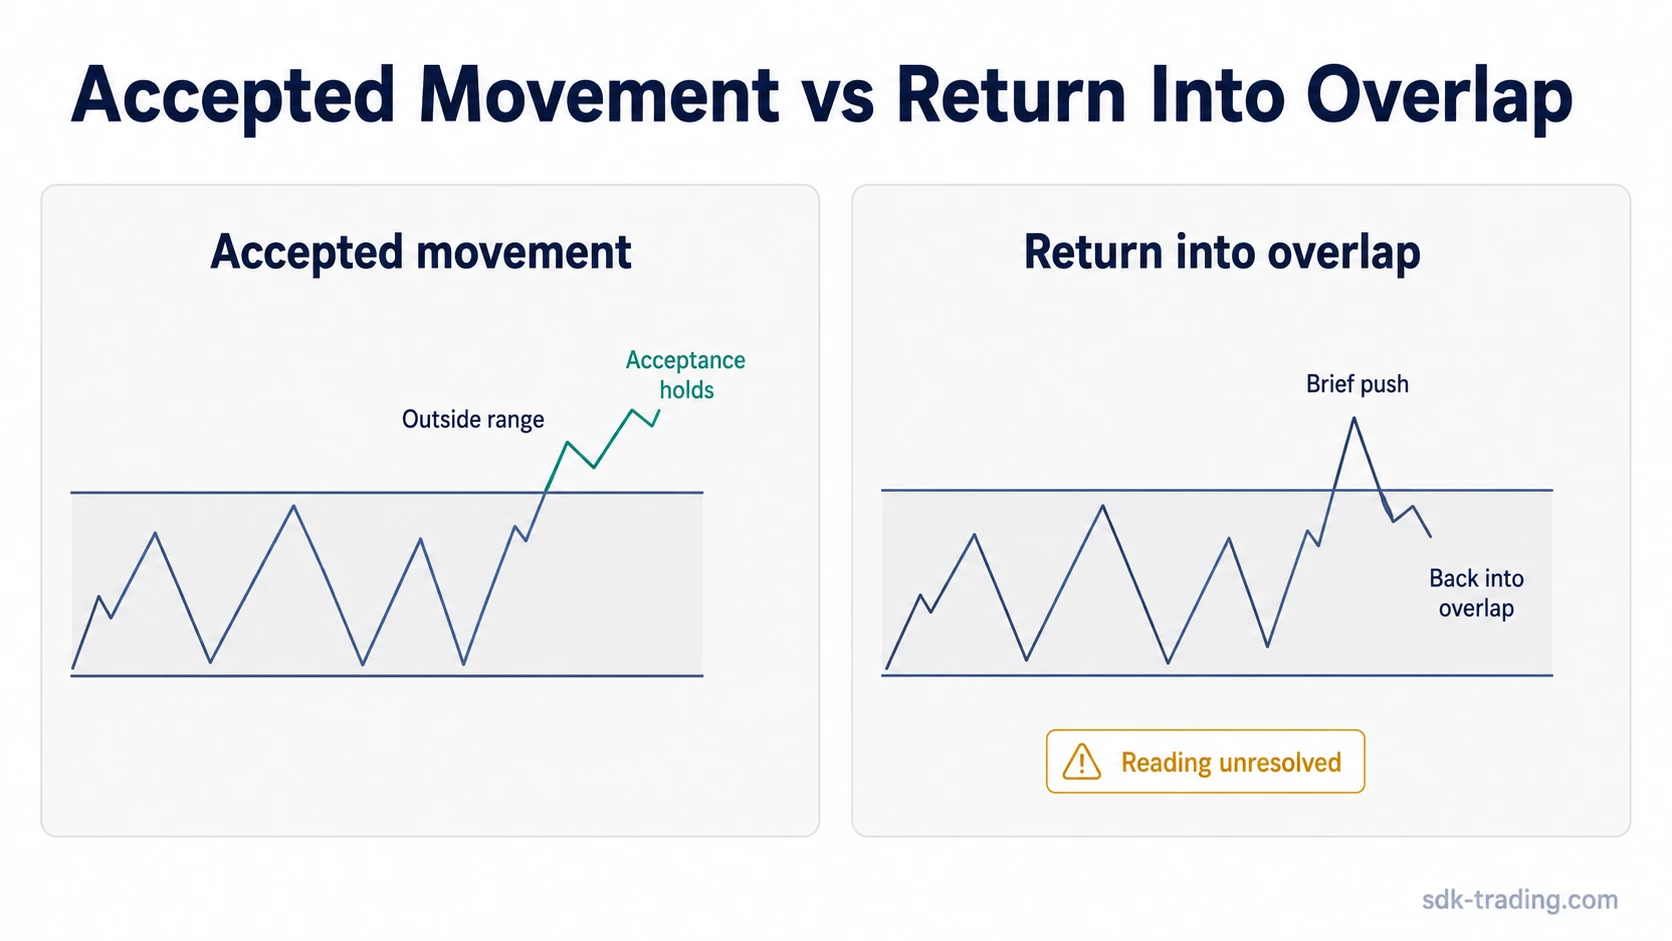
Common mistake: A boundary break is not automatically enough to complete the structure. A wick above resistance or below support can be a probe. The pattern becomes more meaningful only when the market accepts the new area instead of quickly returning into the rectangle.
Rectangle Pattern Example in Context
Price advances into a prior resistance area and then starts rotating between the same upper zone and a lower support zone. Several attempts to move above resistance stall, while several declines into support are rejected. At that point, the rectangle label is possible because the market is respecting a horizontal containment structure.
A stronger interpretation develops when price moves outside the upper boundary and remains accepted above the prior range. A brief trade above resistance that leaves only a wick and closes back inside the overlap is weaker evidence. If later price action stops respecting either boundary, the original rectangle label no longer describes the structure cleanly.
Rectangle Pattern vs Range, Flag, and Pennant
A rectangle is a specific type of horizontal range structure. A loose range can move sideways without forming a clean rectangle. The difference is not the word “range” itself, but whether the market keeps reacting to two broadly horizontal boundaries with enough consistency to make the shape useful.
A Flag Pattern has a different structure because the consolidation is usually channel-like after an impulse. The boundaries may slope or run in a compact parallel channel rather than forming flat horizontal containment.
A Pennant differs because its structure compresses. Instead of holding between two flat levels, price contracts between converging boundaries, which changes the shape and the classification logic.
| Related concept | Main structure | Key distinction |
|---|---|---|
| Rectangle | Horizontal support and resistance | Price is contained between two broadly flat boundaries |
| Loose range | Sideways movement without clean containment | Boundaries may be less consistent or less useful for classification |
| Flag | Compact channel after an impulse | Structure is usually channel-like rather than flat containment |
| Pennant | Converging compression after an impulse | Boundaries narrow toward each other instead of staying parallel and horizontal |
What a Rectangle Does Not Prove
A rectangle does not prove that the prior trend will continue. It also does not prove that the next move will reverse the prior trend. The structure only shows that price has paused inside a bounded area where both support and resistance have mattered.
A rectangle also does not turn a boundary breach into a complete structure by itself. A move outside the range has more structural value when price is accepted beyond the boundary. If price returns into the range quickly, the attempted break may show unresolved pressure rather than completed resolution.
The rectangle should be read as horizontal containment first. Later behavior decides whether that containment resolves, weakens, or stops functioning as a rectangle structure.
FAQ
Is a rectangle trading pattern bullish or bearish?
A rectangle trading pattern is not automatically bullish or bearish. Its meaning depends on the prior context, the quality of the boundaries, and whether price is accepted outside the range or returns back into it.
How many touches are needed for a rectangle pattern?
At least two upper tests and two lower tests usually make the structure easier to classify. Fewer tests can leave the reading too thin because the market has not shown enough respect for both boundaries.
Does a rectangle pattern always continue the prior trend?
No. A rectangle can appear before continuation or reversal. The pattern shows horizontal containment first, while later acceptance or failure decides whether the structure has resolved.
What weakens a rectangle pattern reading?
The reading weakens when boundaries are jagged, tests are inconsistent, price only wicks beyond a boundary, or a break quickly returns into the prior range.