Double top vs triple top is a trading chart pattern comparison between two structures that test a similar upper resistance area. A double top uses two comparable resistance tests with one main reaction low between them. A triple top uses three separate resistance tests and often develops over a broader horizontal area with additional reaction-low evidence.
The difference is not visual peak count alone. Two highs near the same area can still be an unresolved range, and three highs near the same area do not automatically create a stronger reversal interpretation. The classification becomes more defensible only when the sequence, reaction lows, support reference, spacing, and structural completion all point in the same direction.
Definition: A double top is a two-test upper-resistance structure, while a triple top is a three-test upper-resistance structure with a longer resistance negotiation. Both interpretations remain provisional until the market resolves the support or neckline area that gives the pattern meaning.
Key Points
- A double top uses two comparable resistance tests; a triple top uses three separate tests.
- Reaction lows and the support or neckline area matter as much as the number of peaks.
- Repeated resistance touches can still be range behavior if support is not resolved.
- Completion depends on structure and acceptance, not on equal highs alone.
What Double Tops and Triple Tops Share
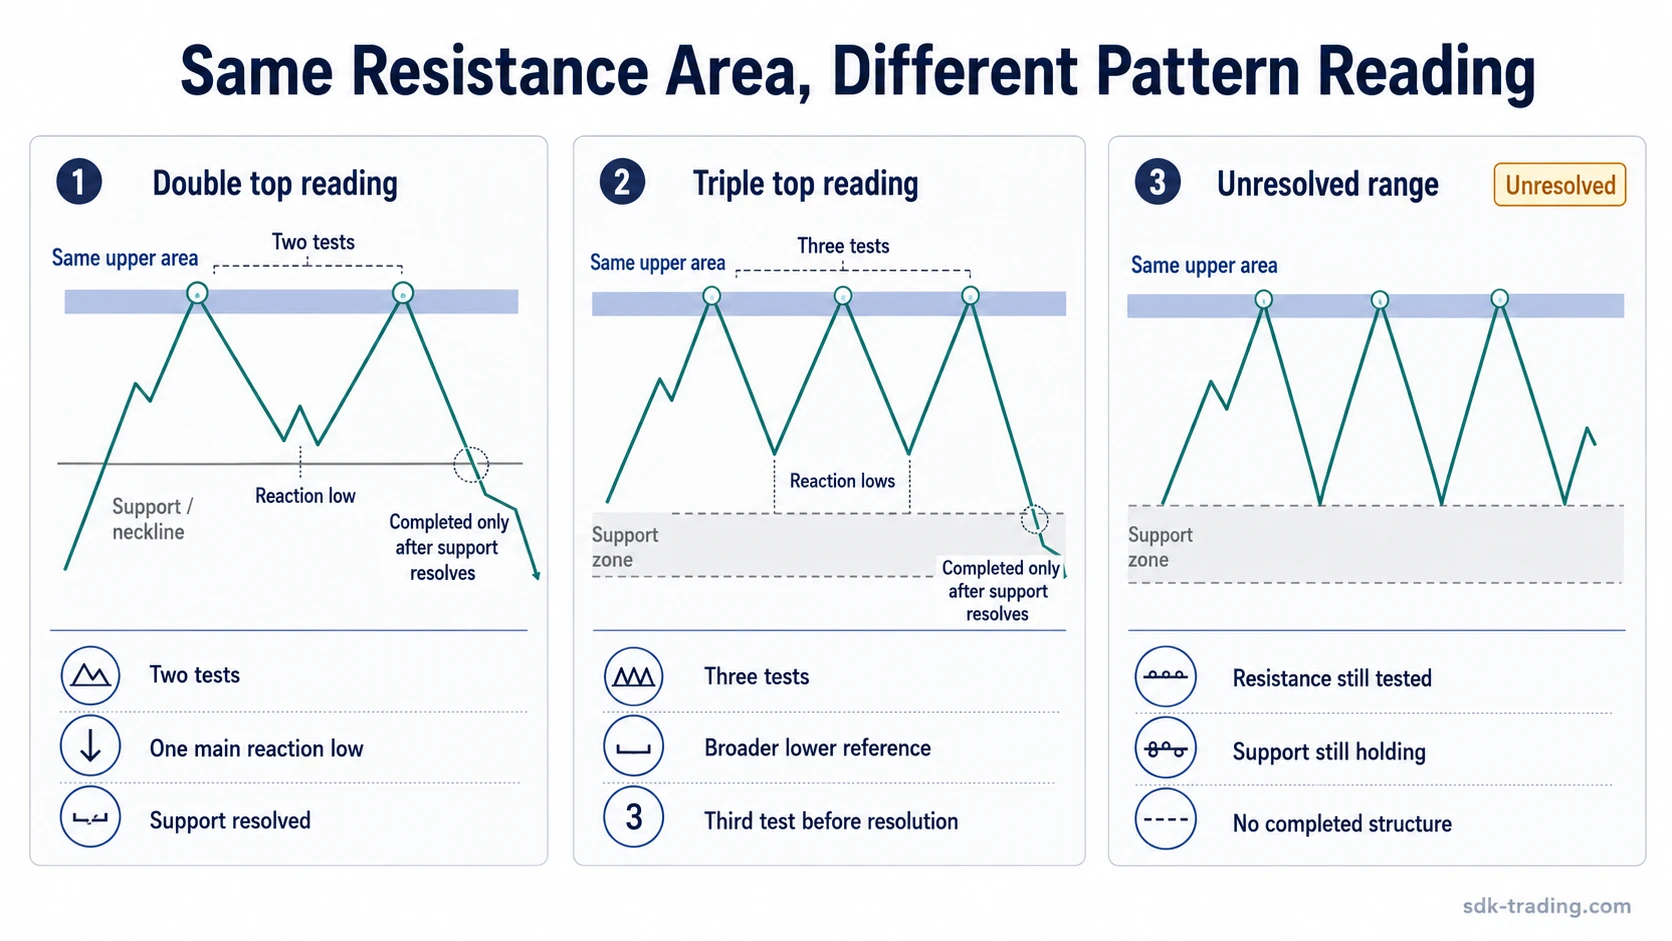
Both structures begin with the same broad idea: price advances into an upper area, fails to make clear progress through it, and returns to test that area again. The shared feature is resistance testing, not a completed reversal structure by itself.
A double top is the more compact version of that idea. The market tests resistance, pulls back into a reaction low, and then returns for a second comparable test. The pattern becomes meaningful only if that reaction low creates a support or neckline reference that later price behavior can accept, reject, or leave unresolved.
A triple top extends the same resistance problem into a third test. The extra test does not automatically make the pattern more important. It changes the interpretation because the market has spent more time negotiating the same upper area, usually with a wider support reference and more information about whether buyers can maintain acceptance above the range.
Overlap: both patterns test an upper resistance area after an advance.
Divergence: the double-top label usually fits a two-test failure around one main reaction low, while the triple-top label needs a separate third test and a broader support or neckline structure.
Key Differences Between a Double Top and a Triple Top
The main distinction is structural sequence. A two-peak pattern asks whether the second test failed to hold above resistance and whether the intervening reaction low matters. A three-peak pattern asks whether the market made a separate third attempt before the support area resolved.
Spacing also changes the interpretation. A compact second peak may still belong to a double-top reading. A later third test, separated by another reaction and another attempt to hold the upper area, moves the pattern toward a triple-top classification. If the tests are crowded, overlapping, or poorly separated, the cleaner interpretation may be range behavior rather than either pattern.
The neckline or support reference is another important separator. In a double top, one main reaction low often carries most of the structural weight. In a triple top, the lower reference may be built from more than one reaction low, which makes the support zone broader and less clean. That broader development can add context, but it can also make the classification less precise.
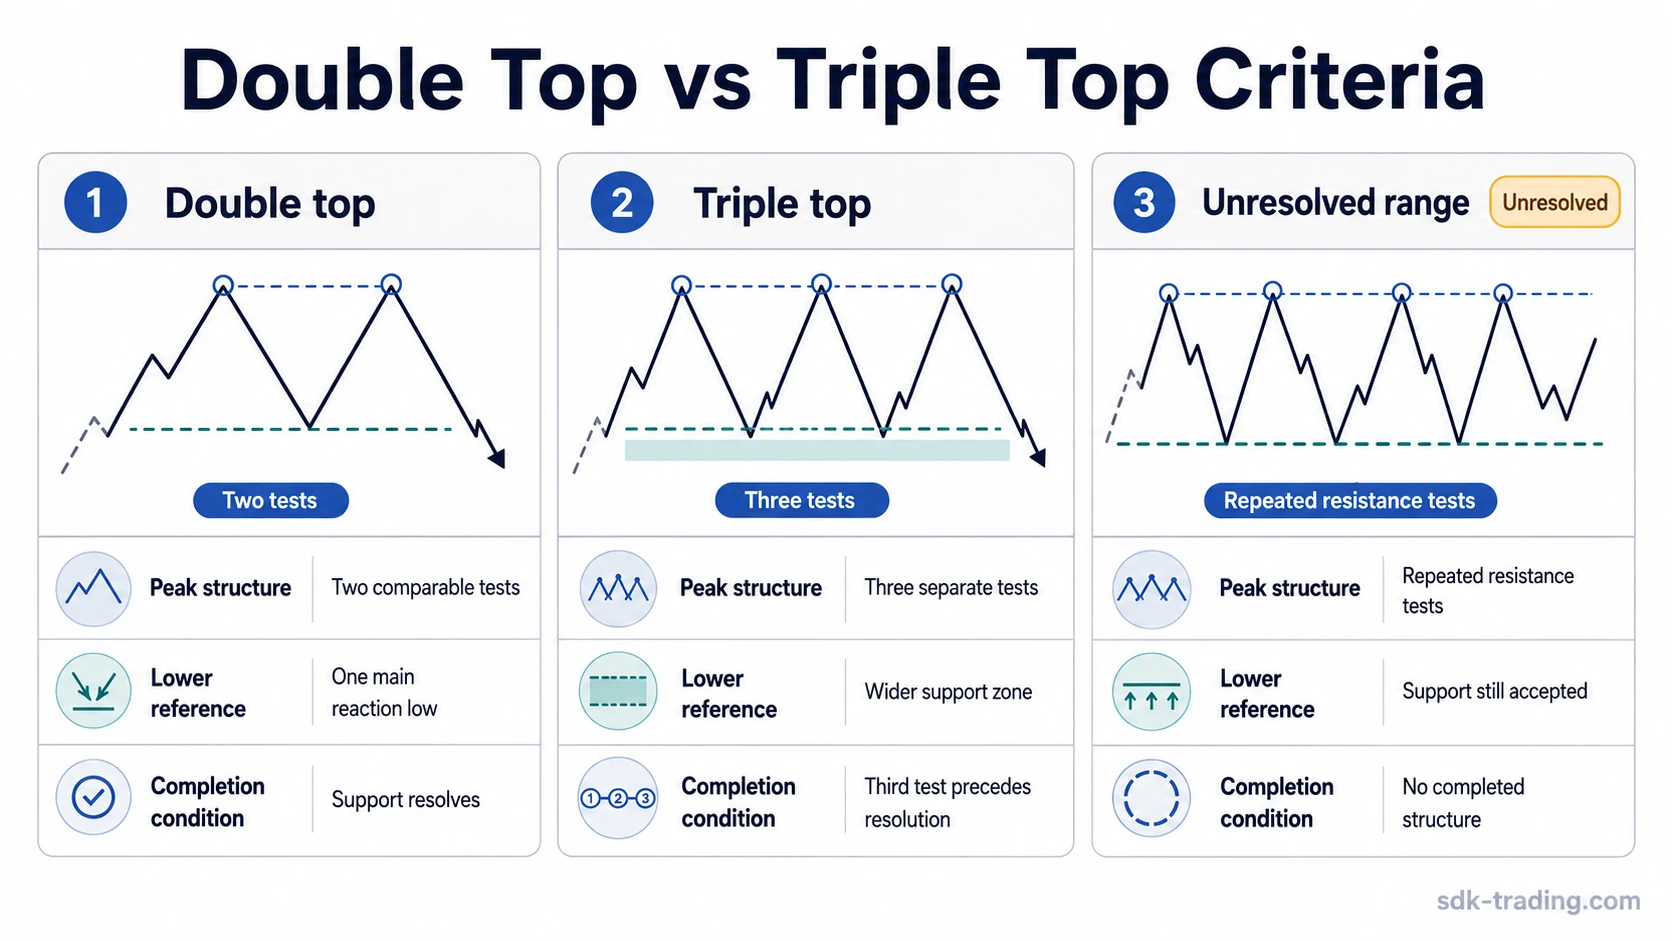
Double Top vs Triple Top Criteria Table
The practical separator is whether the second test resolves the pattern or whether the market forms a distinct third resistance test before resolution.
| Criterion | Double Top | Triple Top | Common Misread |
|---|---|---|---|
| Peak count | Two comparable tests of upper resistance. | Three separate tests of upper resistance. | Counting touches without checking whether each test is structurally separate. |
| Reaction lows | Usually one main reaction low between the two peaks. | Usually two reactions or a broader lower reference between the three peaks. | Treating small pauses as full reaction lows. |
| Neckline or support | Often built around one clearer support reference. | Often develops across a wider support zone. | Calling the pattern complete while support remains accepted. |
| Timing and spacing | More compact and easier to define when the two tests are distinct. | More extended because the third test takes additional time and range development. | Forcing a triple-top label onto three crowded touches inside the same congestion. |
| Completion | Depends on whether the sequence resolves below the relevant reaction low or support reference. | Depends on whether the broader lower area resolves after the third test. | Using equal highs alone as completion evidence. |
| Unresolved state | Can remain a two-test range if support does not resolve. | Can remain an extended range if the third test does not lead to resolution. | Assuming repeated resistance tests must become a reversal pattern. |
When a Double Top Can Become a Triple Top Reading
Price advances into a prior resistance area and forms a first clear rejection. It later returns to the same upper area and fails to hold above it again. At that point, the pattern may be read as a double-top candidate, but only if the reaction low between the two tests is meaningful enough to define the lower support reference.
If price then holds the lower part of the range and returns for a separate third test, the comparison changes. The earlier double-top reading has not necessarily failed, but the market has added another resistance negotiation. The better classification may shift toward a triple top if the third test is distinct, separated by a real reaction, and connected to the same upper resistance area.
If the support area never resolves, neither label should be forced. The market may simply be rotating between a familiar upper area and a familiar lower area. In that case, the cleanest interpretation is unresolved range behavior until price behavior accepts or rejects one side of the pattern.
Example of a Basic Double Top vs Triple Top Reading: Price tests the same resistance area twice and pulls back to a clear reaction low between the tests. If the second test is followed by a structural break of that reaction low, the two-test reading is easier to classify as a double top. If the reaction low holds and price later returns for a distinct third resistance test, the earlier two-test label becomes less complete and the structure can shift toward a triple-top reading. If the lower area keeps holding, the safer classification remains unresolved range behavior.
When the Comparison Becomes Misleading
The most common mistake is treating peak count as the whole pattern. Equal or similar highs can make a chart look organized, but similar highs do not prove that the market has finished a reversal structure. The lower reference still has to matter.
Another mistake is assuming that the third peak makes a triple top more reliable by default. The third test can add information, but it can also show that the market is still balanced around the same range. More tests can add information, but they can also show continued balance rather than control by either side.
Limitation: A repeated resistance area is only one part of the interpretation. Reaction lows, spacing, support behavior, and later acceptance determine whether the classification is useful. Without those elements, the pattern is better treated as unresolved rather than forced into a double-top or triple-top category.
How Double Top vs Triple Top Differs From Nearby Concepts
Multiple-top language can describe the broader family of repeated upper resistance tests, but it is less precise than the two-pattern comparison. Double top vs triple top is narrower because it asks whether the pattern has two comparable tests or three separate tests, and whether the lower reference has developed enough to support that classification.
The comparison also differs from head-and-shoulders analysis. Double and triple tops usually focus on repeated resistance around a similar upper area. Head-and-shoulders analysis depends more on peak hierarchy, with a higher central head and weaker shoulder structure. Mixing those ideas too quickly can make the chart label look precise while the structure remains unclear.
FAQ
Is a triple top just a failed double top?
Not always. A possible double top can shift into a triple-top reading if the market forms a separate third resistance test before the lower boundary resolves. If support remains accepted, the pattern may still be an unresolved range.
Do the highs need to be exactly equal?
No. The highs should test a similar resistance area, but they do not need to match exactly. A small overshoot or undershoot can still belong to the same pattern if the market treats the area as resistance.
Which matters more, peak count or the neckline?
Peak count helps identify the candidate label, but the neckline or support reference gives the pattern meaning. Without a meaningful lower boundary, repeated highs may only describe range behavior.
Can three resistance touches still be an unresolved range?
Yes. Three touches can remain unresolved if price continues to hold the lower boundary and no structural resolution appears. In that case, the cleaner reading is range persistence rather than a completed triple top.