Heikin Ashi vs Renko is a comparison between two transformed chart views: Heikin Ashi smooths a time-based candle sequence, while Renko rebuilds price into movement-based bricks. Neither chart is better in every situation. The useful choice depends on whether the question is about candle-sequence smoothing or price-displacement filtering.
Heikin Ashi keeps the chart tied to regular time intervals, but changes the displayed candle values. Renko changes the structure more aggressively by showing bricks only after price has moved enough to meet the selected brick size. That makes the two methods useful for different chart questions, but it also means both can hide information that exists in the raw price chart.
Core distinction: Heikin Ashi is a smoothed candle-sequence view. Renko is a movement-threshold view. Heikin Ashi asks how the candle sequence behaves after smoothing; Renko asks whether price has moved far enough to print a new brick.
Key Points
- Heikin Ashi smooths candle behavior across time-based periods.
- Renko removes normal time spacing and focuses on price movement large enough to create bricks.
- Both methods reduce visual noise by transforming the displayed price information.
- Neither method confirms direction, timing, continuation, reversal, trade quality, or outcome.
- The better chart view depends on the question: sequence behavior for Heikin Ashi, movement filtering for Renko.
Heikin Ashi vs Renko: The Core Difference
The main difference between Heikin Ashi and Renko is how each method reorganizes price information. Heikin Ashi keeps a candle structure, but calculates each candle from averaged price inputs and prior Heikin Ashi values. Renko charts do not preserve the normal candle-by-candle time sequence; they print bricks only when price movement reaches the required brick threshold.
This is why the same market can look smoother on a Heikin Ashi chart and more filtered on a Renko chart. Heikin Ashi can still show a sequence of candles through time, including body compression or wick behavior. Renko can remove many smaller time-based fluctuations, but it may also hide when those fluctuations happened.
Better is the wrong first question. Heikin Ashi and Renko do not solve the same problem. Heikin Ashi is usually more useful when the question is about the quality of a smoothed candle sequence. Renko is usually more useful when the question is about whether price movement is large enough to matter under a selected brick size.
How Each Chart Method Builds Price Information
Heikin Ashi candles are calculated from raw open, high, low, and close inputs, together with prior Heikin Ashi values. The result is still displayed as candles, but those candles are calculated outputs rather than exact raw OHLC candles.
Renko charts use a brick size. A new brick appears only after price moves enough to satisfy that brick size. Because the chart waits for enough displacement, normal time spacing becomes secondary. Several periods of movement may produce no new brick, while a sharp move can produce multiple bricks depending on the method and settings.
Important limitation: Both methods transform displayed price information. Heikin Ashi should not be read as exact raw OHLC data, and Renko should not be read as a complete record of normal time-based price behavior.
Heikin Ashi vs Renko Comparison Table
| Criteria | Heikin Ashi | Renko |
|---|---|---|
| Core structure | Calculated candles built from raw OHLC inputs and previous Heikin Ashi values. | Movement-based bricks printed after price moves by the selected brick size. |
| Time handling | Keeps the normal time-based sequence of candles. | Removes normal time spacing from the main display. |
| Price handling | Smooths displayed candle values. | Filters movement until the brick threshold is reached. |
| Noise reduction | Reduces candle-to-candle noise by averaging the sequence. | Reduces smaller fluctuations by ignoring movement below the brick threshold. |
| Lag type | Lag can appear through smoothing and delayed sequence change. | Lag can appear because a brick waits for enough price displacement. |
| Exact OHLC visibility | Raw OHLC is transformed and not shown as exact standard candles. | Raw time-based OHLC detail is not the main display. |
| Strongest diagnostic use | Reading smoothed candle persistence, compression, and sequence behavior. | Reading whether movement is large enough to pass a selected price threshold. |
| Main limitation | Can make a weakening move appear smoother than the raw candles would show. | Can hide timing, smaller reversals, and transition detail between bricks. |
Same Market Move, Different Reading
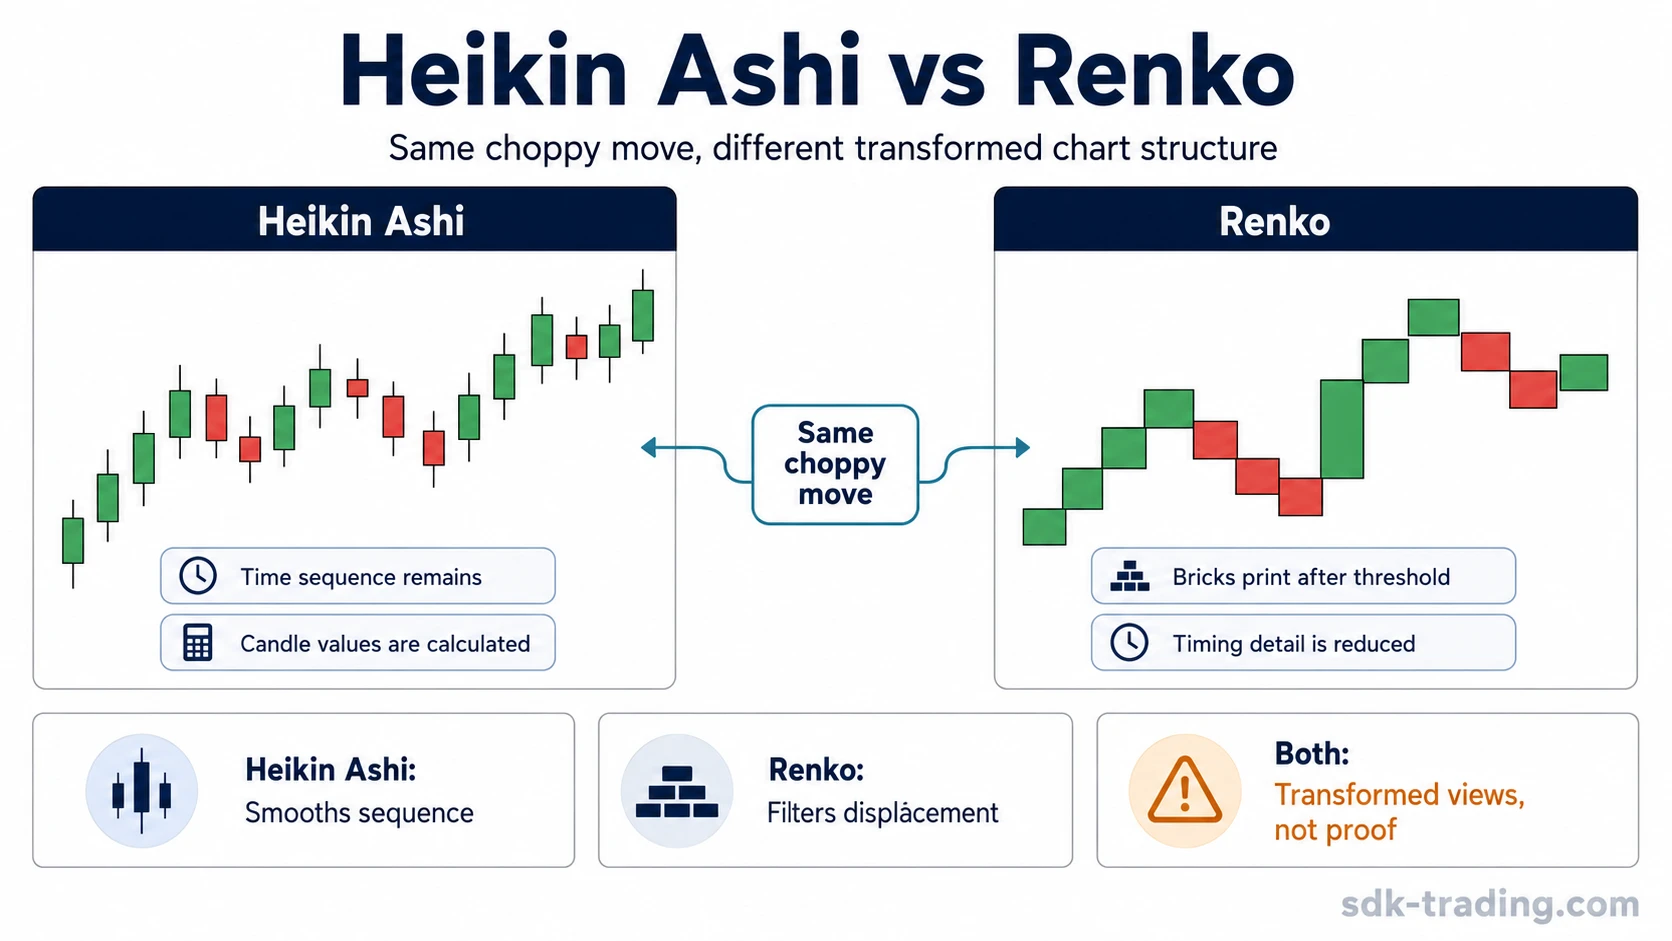
Example scenario: Price moves upward in a choppy sequence, with several small pullbacks along the way. On a Heikin Ashi chart, the sequence may look smoother because the calculated candles reduce some of the back-and-forth noise. On a Renko chart, the same small pullbacks may not appear at all if they do not meet the brick threshold.
The difference is not that one chart has found the “true” move and the other has failed. The difference is the question being asked. Heikin Ashi keeps the time sequence visible enough to study smoothed candle behavior. Renko asks whether price movement is large enough to create a new structural brick.
This same-scenario contrast is the safest way to compare the two methods. Heikin Ashi may make persistence easier to observe, but it can soften warning details. Renko may make directional displacement cleaner to see, but it can remove the timing and smaller transitions that shaped the move.
When Heikin Ashi Fits Better
Heikin Ashi fits better when the main question is about smoothed candle-sequence behavior. It can help reduce the visual disruption of alternating raw candles and make persistence, compression, and sequence change easier to observe.
That does not make a Heikin Ashi sequence a confirmation signal. A long run of similar-colored calculated candles can still lag the raw market, and a compressed candle can show hesitation without proving reversal. A Heikin Ashi doji can be useful as a compression clue, but it still needs context before the reading becomes meaningful.
Heikin Ashi limitation: Smoothing can reduce noise, but it can also delay recognition of a sharp change. The smoother the visual sequence appears, the more important it becomes to remember that the displayed candles are calculated.
When Renko Fits Better
Renko fits better when the main question is about price displacement rather than normal candle sequence. By using a brick size, Renko filters out movement that is too small to print a new brick. This can make larger movement phases easier to isolate visually.
The trade-off is that Renko can hide time. A quiet period and an active period may not be represented in the same way as a standard time-based chart. Smaller pullbacks, fast transitions, and intraperiod movement can also disappear from the main view if they do not satisfy the brick rule.
Brick-size note: The selected brick size changes what Renko hides or reveals. A larger brick size can filter more movement, while a smaller brick size can show more transitions, depending on the method and settings.
What Both Methods Can Hide
Heikin Ashi and Renko both reduce noise by changing what the reader sees. That reduction is useful only when the hidden information is understood. The risk is treating a cleaner chart as a more truthful chart.
| Hidden or reduced detail | Why it matters |
|---|---|
| Exact raw OHLC | Heikin Ashi displays calculated values, and Renko does not show normal time-based candles as the primary structure. |
| Intrabar or transition movement | Small movements can be visually softened or removed, especially when they do not change the transformed display. |
| Timing detail | Renko can make movement look cleaner while reducing the visibility of when that movement happened. |
| Early reversal pressure | Both methods can show a cleaner sequence after the raw chart has already started to change character. |
| Platform or setting differences | Brick size, calculation settings, and display choices can affect how much information appears or disappears. |
Boundary: A transformed chart can clarify one kind of observation while weakening another. It should not replace raw price review when exact levels, timing, or execution-sensitive context matters.
Common Misreadings
| Misreading | Safer interpretation |
|---|---|
| Renko is more accurate because it looks cleaner. | Renko is more filtered, not automatically more accurate. It removes smaller movement and normal time spacing from the main display. |
| Heikin Ashi color confirms trend direction. | Color persistence can describe the smoothed sequence, but it does not prove continuation or outcome. |
| The better chart is the one with less noise. | Less noise can also mean less information. The better method depends on whether the hidden detail matters for the question. |
| Using both methods creates a complete system. | Combining transformed views can create another layer of interpretation, but it does not create confirmation by itself. |
Which One Should You Use?
Use Heikin Ashi when the main need is to observe a smoothed candle sequence: persistence, compression, transition, and the way calculated bodies and wicks change over time. Use Renko when the main need is to filter smaller movement and focus on displacement beyond a selected brick threshold.
The decision should start with the chart question, not with a claim that one method is superior. Heikin Ashi can preserve more sequence context while smoothing the candles. Renko can make movement phases cleaner while reducing timing context. Both can help observation, and both can mislead when treated as confirmation.
FAQ
Is Renko better than Heikin Ashi?
Renko is not better in every situation. It is more focused on movement that exceeds a selected brick size, while Heikin Ashi is more focused on smoothed candle-sequence behavior. The better choice depends on the chart question.
Do Heikin Ashi and Renko show real prices?
Both are transformed chart views. Heikin Ashi candles are calculated from price inputs, so they should not be read as exact raw OHLC candles. Renko bricks are based on price movement thresholds, so they do not preserve normal time-based price detail in the main display.
Can Heikin Ashi and Renko be used together?
They can be viewed together as separate diagnostic views, but combining them does not create confirmation by itself. Heikin Ashi may show smoothed sequence behavior, while Renko may show movement filtering. Both still need context and limitation awareness.