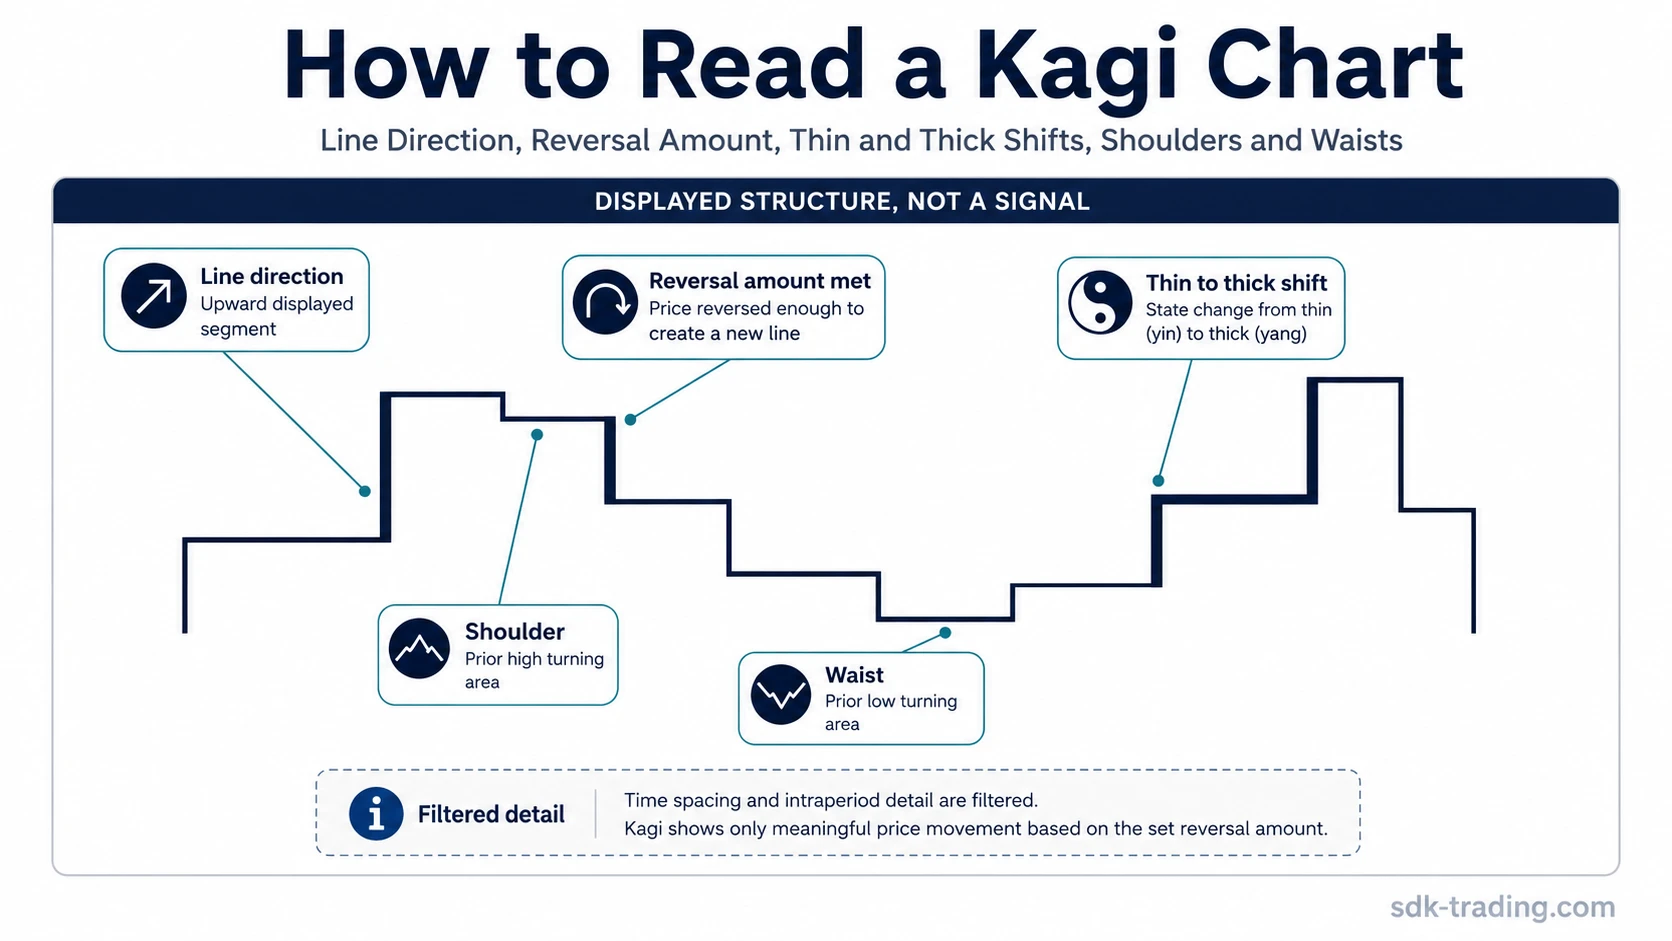
A Kagi chart is read by checking line direction, the reversal amount, thin and thick line changes, and the shoulders and waists created by prior turns. These features describe displayed price structure, but they do not create a complete trading decision on their own.
The main risk when reading Kagi is over-reading a clean display. Because Kagi removes regular time spacing, price movement can look more orderly than it would on a standard time-based chart. The chart can help organize direction and turning areas, but the reading still depends on settings, context, and what price does after the displayed change appears.
Core reading idea: Kagi reading starts with structure, not prediction. Line direction shows the current displayed move, reversal amount controls when the line can turn, thickness or yin-yang changes mark a display-state shift, and shoulders or waists identify prior turning areas.
Key Points
- A Kagi chart is price-based rather than time-based, so new line behavior depends on price movement rather than a fixed candle interval.
- The reversal amount controls sensitivity. A smaller setting reacts sooner, while a larger setting filters more movement but can respond later.
- Thin and thick lines, or yin and yang states, show a displayed structure shift rather than an instruction to act.
- Shoulders and waists mark prior turning areas that can act as reference levels, but they are not guaranteed support or resistance.
- The safer reading checks what the Kagi display filters out before treating a line change as meaningful.
How to Read a Kagi Chart Without Over-Reading It
Reading a Kagi chart starts with the active line. A rising line shows that displayed price movement is advancing under the chart’s rules. A falling line shows that displayed price movement is declining under the same rules. The line changes direction only after price moves far enough against the current direction to meet the chosen reversal amount.
That reversal threshold is the main filter. A normal time-based chart adds a new candle because time has passed. A Kagi chart changes because price has moved enough to satisfy the construction rule. This is why Kagi can reduce visual noise, but it can also hide time gaps, pauses, and intraperiod detail that may still matter in interpretation.
For construction logic and the larger chart-type context, the core Kagi chart concept remains the main reference. The reading process here is narrower: direction, reversal amount, thickness state, and prior turning levels.
The Four Inputs to Check First
A practical Kagi reading can begin with four checks: line direction, reversal amount, thin/thick state, and shoulders or waists. Each input answers a different question. Mixing them together can make a display change look more decisive than it really is.
| Reading input | What it shows | What not to over-read |
|---|---|---|
| Line direction | The current displayed price movement after Kagi filtering. | A direction change is not proof that a new trend has begun. |
| Reversal amount | The price movement needed before the line can reverse. | A more sensitive setting does not make the reading more reliable by itself. |
| Thin or thick line | A display-state shift after price passes a prior turning reference. | A thickness change is not a complete trading decision without context. |
| Shoulders and waists | Prior Kagi turning areas that can become reference levels. | Reference levels are not guaranteed reaction zones. |
Why a Kagi Reversal Is Not Always a New Signal
A Kagi reversal means price has moved far enough in the opposite direction to meet the reversal amount. It does not automatically mean that the market has changed character. The reversal may represent a meaningful shift, a normal counter-move, or only a reaction to a sensitive setting.
The difference matters because Kagi can make reversals look cleaner than they were in real time. A standard chart may show several candles, pauses, failed pushes, or gaps during the same movement. Kagi can compress that activity into a simpler line turn. The cleaner visual form can help interpretation, but it can also remove detail that would otherwise warn against a stronger conclusion.
Limitation: A Kagi reversal confirms that the selected reversal rule was met. It does not confirm trend quality, continuation, reversal strength, or execution quality.
How Reversal Amount Changes Sensitivity
The reversal amount defines how far price must move against the current Kagi line before a new line direction appears. This setting can be fixed, percentage-based, or based on volatility measures such as ATR, depending on the charting platform.
A smaller reversal amount makes the chart more reactive. More turns may appear, and the chart may show more frequent shifts. A larger reversal amount filters smaller price movement and can make the structure look smoother, but it may also recognize changes later.
| Setting type | Effect on reading | Main limitation |
|---|---|---|
| Fixed amount | Uses a set price distance for reversals. | May become too sensitive or too slow as price scale changes. |
| Percentage amount | Adjusts reversal distance relative to price level. | Still depends on whether the chosen percentage fits the market being viewed. |
| ATR-based amount | Can adapt reversal distance to recent volatility. | May change sensitivity as volatility expands or contracts. |
The setting is part of the reading, not a neutral background detail. Two Kagi charts of the same market can look different if their reversal amounts differ.
What Shoulders and Waists Show
Shoulders and waists are prior turning areas on a Kagi chart. A shoulder is typically associated with a prior high area in the displayed structure, while a waist is associated with a prior low area. These levels help organize where displayed price movement previously changed direction.
When price later moves beyond a prior shoulder or waist, the Kagi line may change thickness or state. Many platforms represent this with thin and thick lines, while some use yin and yang terminology. The useful reading is structural: the chart is marking a relationship between current movement and a prior turning area.
Interpretation note: Shoulders and waists are reference areas. They can help identify where the displayed structure changed before, but they should not be treated as levels where price must react again.
What Kagi Removes From View
Kagi removes regular time spacing. A long period with little qualifying price movement may produce little change, while a fast move can produce a sharp Kagi adjustment. That makes the chart useful for filtering smaller movement, but it also means the display does not show every time-based detail.
This matters most when comparing Kagi with standard candlesticks or other chart types. A candlestick chart can show exact opens, closes, gaps, long wicks, and session-by-session behavior. Kagi focuses on price movement relative to its reversal rule. Neither display changes the underlying market history, but each display emphasizes different information.
Reading boundary: Kagi can simplify structure, but simplification is not the same as certainty. Removed time detail can make a move look cleaner after the fact than it felt while developing.
Example of a Basic Kagi Chart Reading
Price advances through several smaller fluctuations while the Kagi line continues rising. A shallow pullback does not meet the selected reversal amount, so the displayed line does not turn. Later, price falls far enough to cross the reversal threshold, and the Kagi line changes direction.
The first line turn only says that the reversal rule has been met. If price also moves through a prior waist or shoulder, the line state may shift from thin to thick or from one yin-yang state to another, depending on the platform. That adds structural information, but the reading is still contextual.
A stronger interpretation would compare the line turn with nearby reference areas, recent volatility, and whether price accepts or rejects the new area afterward. A weaker interpretation would treat the first visible Kagi change as a complete decision without checking what was removed from the time-based view.
Common Mistakes When Reading Kagi Charts
The most common mistake is treating one displayed change as if it carries every part of the decision. Kagi is a chart construction method, not a complete trading method. The line, reversal amount, shoulders, waists, and thickness state each provide one layer of information.
| Mistake | Safer reading |
|---|---|
| Treating every line reversal as a new market view. | Check whether the reversal is meaningful under the selected reversal amount and surrounding structure. |
| Assuming thin or thick shifts are complete decisions. | Read them as display-state changes that need context. |
| Reading shoulders and waists as guaranteed support or resistance. | Treat them as prior turning references that may or may not matter later. |
| Ignoring the reversal setting. | Compare the reading with the sensitivity of the selected fixed, percentage, or ATR-based threshold. |
| Forgetting that time detail is removed. | Cross-check whether gaps, exact closes, or rejection behavior matter for the specific interpretation. |
Safer Interpretation: Use Kagi as a Structure Filter
Kagi is most useful as a structure filter. It can organize directional movement, prior turning areas, and display-state shifts into a cleaner visual sequence. The safer reading is to ask what the chart has filtered, what the selected reversal amount has emphasized, and what still needs confirmation from broader price behavior.
A Kagi line change can show that displayed structure has shifted, but that shift still needs interpretation. Shoulders and waists can mark useful reference areas without guaranteeing a later reaction. Thin and thick shifts can clarify how current movement relates to prior turning areas, but they cannot replace the missing time-based detail or the surrounding price context.
Practical reading sequence: Check direction first, then reversal amount, then thickness or yin-yang state, then shoulders and waists. After that, compare what the Kagi display emphasizes with what it removes from view.
FAQ
What do thin and thick Kagi lines mean?
Thin and thick lines mark a display-state change related to prior Kagi turning areas. They can help interpret structure, but they should not be treated as complete trading instructions.
What are shoulders and waists on a Kagi chart?
Shoulders and waists are prior turning areas in the Kagi structure. They can act as reference levels for later interpretation, but they do not guarantee that price will react there again.
Does a Kagi reversal confirm a trend change?
No. A Kagi reversal confirms that price met the selected reversal rule. It may reflect a meaningful change, but the interpretation still depends on setting sensitivity and surrounding market structure.