A golden cross is a trading chart pattern where a shorter moving average rises above a longer moving average. The common version compares the 50-day moving average with the 200-day moving average, but the cross appears only after prior price movement has already affected both averages.
The pattern is often read as a bullish shift in trend behavior, but the crossover alone does not prove that a new advance is durable. The stronger test is whether price holds the post-cross area, or whether the averages flatten, overlap, and recross in sideways movement.
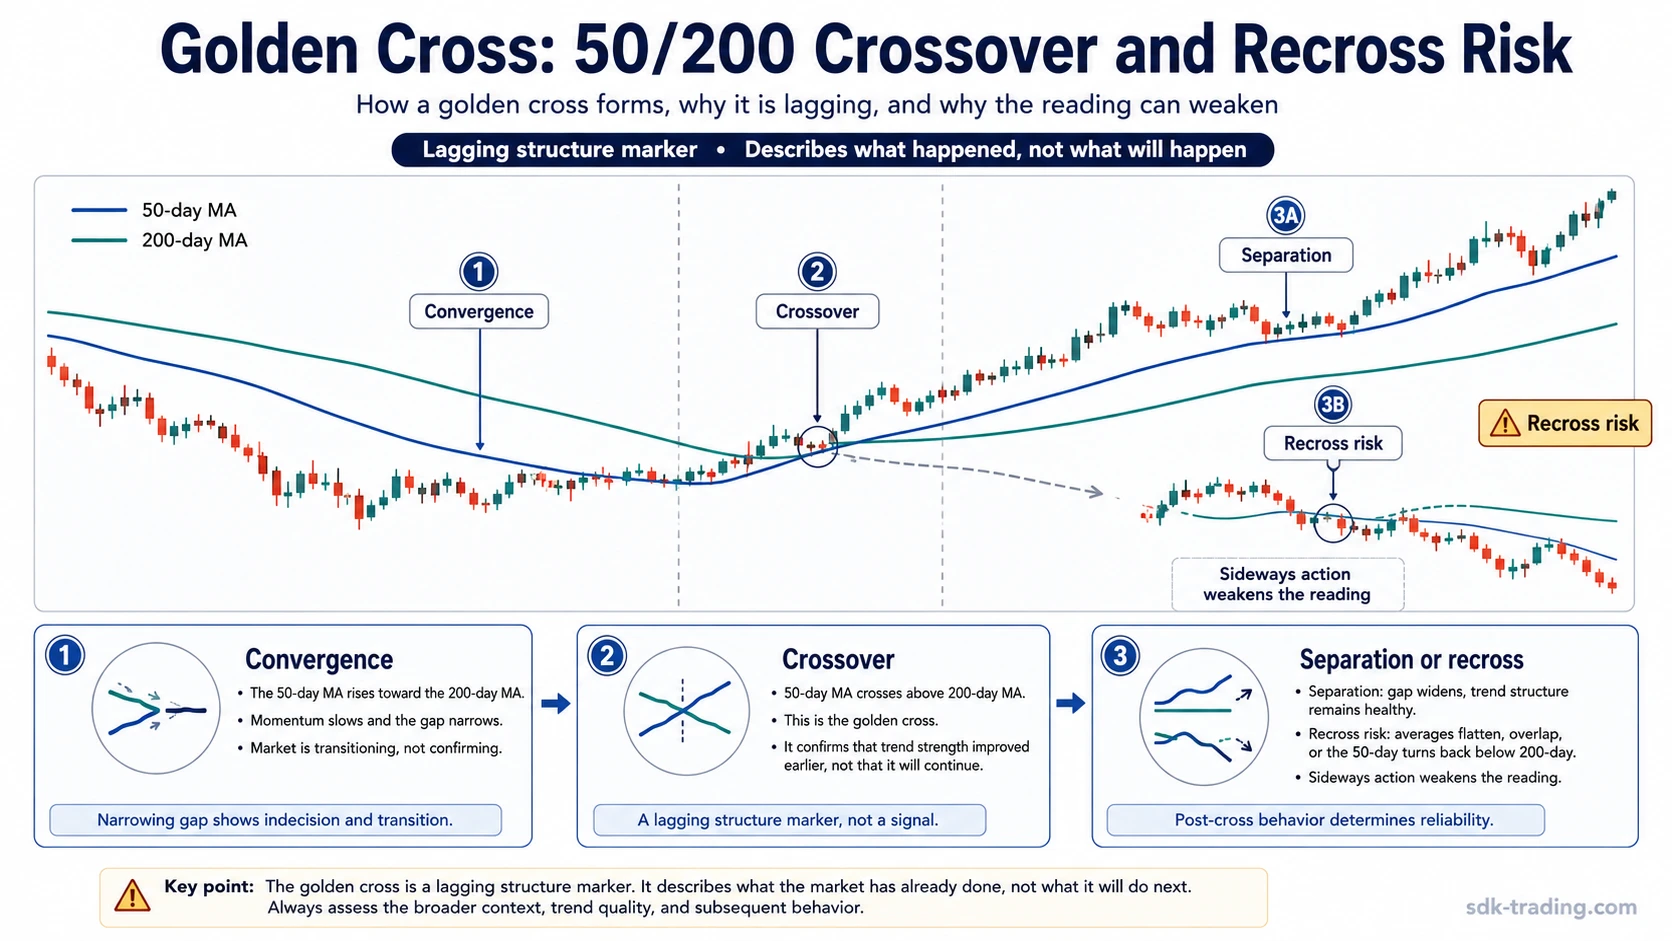
Definition: A golden cross occurs when a shorter moving average crosses above a longer moving average, most commonly when the 50-day moving average moves above the 200-day moving average in a trading or investing chart.
Key Points
- A golden cross compares a shorter moving average with a longer moving average to identify a possible shift in trend behavior.
- The 50-day and 200-day moving averages are the most common convention, but other periods can be used depending on the market and timeframe.
- The crossover is lagging because moving averages smooth past prices rather than current intent.
- A clean interpretation needs post-cross separation or acceptance, not only a single line crossover.
- False golden cross readings often happen when price remains range-bound and the moving averages recross.
What Is a Golden Cross?
A golden cross is a moving-average crossover pattern. It forms when the shorter average, such as a 50-day moving average, rises above the longer average, such as a 200-day moving average. The crossing line relationship suggests that recent prices have improved enough to pull the shorter average above the longer trend baseline.
The pattern belongs to trend-following technical analysis. It reacts to price history rather than forecasting price in advance. That lag is not a flaw by itself; it is a property of smoothing. The mistake is treating the crossover as complete evidence before the market has shown whether the new relationship can hold.
The 50/200 version is widely recognized because it separates medium-term price behavior from a longer trend reference. A shorter moving average turning above a longer one means recent price action has improved relative to the broader average, but the signal remains conditional until later price behavior confirms or undermines the crossover.
How the 50/200 Moving-Average Crossover Forms
A typical golden cross begins after a decline, base, or compression phase. The shorter moving average is usually below the longer moving average while the prior downside behavior is still reflected in recent prices. If price stabilizes or starts recovering, the short average responds first because it uses a smaller lookback window.
The formation becomes visible in stages. First, the short average stops falling or begins to rise. Then the distance between the short and long averages narrows. The crossover occurs when the short average moves above the long average. After that, the important behavior is whether the averages separate or remain tangled.
| Stage | Observable behavior | Interpretation |
|---|---|---|
| Prior decline or compression | The shorter moving average remains below the longer moving average. | Recent price behavior is still weaker than the longer trend baseline. |
| Convergence | The short average rises toward the long average. | Recent prices have improved enough to narrow the gap between the averages. |
| Crossover | The short average moves above the long average. | The chart records a possible bullish structural shift. |
| Post-cross test | The averages either separate, flatten, or recross. | The later behavior decides whether the crossover has useful follow-through or remains noise. |
The crossover point is only one moment inside the sequence. A stronger version usually has separation after the cross, improving price behavior, and fewer immediate reversals back through the moving-average area.
What a Golden Cross Can and Cannot Show
A golden cross can show that recent price action has improved relative to a longer moving-average baseline. It can also identify a possible transition from a weaker condition into a stronger one, especially after a prolonged decline, base, or compression phase.
It cannot prove that the market will continue higher. Moving averages do not measure future demand directly; they average prior prices. If the market moves sideways, even a technically correct crossover can have little value because the averages may flatten and cross back again.
Limitation: A golden cross is strongest as a structure marker, not as a standalone decision rule. The interpretation improves when price holds the area after the cross and deteriorates when price stalls, overlaps the averages, or quickly returns below them.
The useful question is not only whether the cross happened, but whether the market behaved differently afterward. A cross followed by persistent separation carries a different message from a cross followed by immediate overlap and recrossing.
Clean, Weak, and Invalid Golden Cross Readings
The same moving-average crossover can carry different weight depending on the behavior around it. A clean version has follow-through and separation. A weak version shows hesitation or range-bound behavior. An invalid version loses the crossover relationship quickly.
| Reading type | Observable behavior | Interpretation | What weakens it |
|---|---|---|---|
| Clean golden cross | The short average crosses above the long average and continues separating. | Recent price strength is improving relative to the longer baseline. | Low separation, immediate flattening, or price failing to hold near the moving-average area. |
| Weak golden cross | The crossover occurs, but price remains choppy and the averages stay close together. | The market has not clearly held the new moving-average relationship. | Sideways movement, repeated overlap, and lack of sustained distance between the averages. |
| Invalid golden cross | The short average crosses above the long average, then quickly falls back below it. | The crossover failed to hold as a structural shift. | Fast recrossing, failed recovery attempts, or a return to the prior weaker condition. |
This classification prevents the pattern from becoming a mechanical label. The cross is the observation. The later separation, flattening, or recrossing determines how much weight the observation deserves.
Golden Cross vs Death Cross
A golden cross and a death cross use the same moving-average relationship in opposite directions. A golden cross occurs when the shorter moving average rises above the longer moving average. A death cross occurs when the shorter moving average falls below the longer moving average.
The contrast is directional, but both patterns share the same limitation. Each is based on smoothed price history, so both can appear late and both can fail in sideways markets. The more useful distinction comes from what follows the cross, not from the label alone.
Core distinction: A golden cross points to possible bullish structure after the short average moves above the long average. A death cross points to possible bearish structure after the short average moves below the long average.
Why False Golden Cross Signals Happen
False golden cross readings usually happen because the moving averages respond to prior price movement while the current market remains undecided. A short recovery can pull the faster average above the slower one, but that does not guarantee that price has escaped a range or established a durable trend.
Sideways markets are the main problem. When price swings around the moving-average area without directional separation, the shorter average can cross above and below the longer average several times. The chart may record several crossovers while the underlying condition remains noisy.
Lag also matters. The longer moving average moves slowly because it includes more historical prices. By the time the 50-day average crosses the 200-day average, part of the recovery may already be reflected in price. That makes follow-through more important than the crossover point itself.
Safer interpretation: A golden cross becomes more meaningful when it appears with cleaner price behavior, distance between the averages, and fewer immediate recrosses. It loses value when the averages stay flat, tangled, or repeatedly crossed.
Example Scenario: Cross, Stall, and Recross
Price recovers after a long period of compression, and the 50-day moving average gradually rises toward the 200-day moving average. The crossover appears after several weeks of improved price action, but price tests above the prior range without holding much distance from the moving-average area.
The first interpretation is tempting because the short average has moved above the long average. The setup remains incomplete because price stalls, the averages stay close together, and the next recovery attempt fails to create separation.
If price later holds above the moving-average area and the short average keeps moving away from the long average, the crossover has cleaner follow-through. If price slips back into the prior range and the short average falls below the long average again, the golden cross has not held as a structural shift.
Timeframe Sensitivity
The 50/200 convention is common on daily charts, especially for stocks and broad market indexes. Shorter timeframes can create more frequent crossovers, while longer timeframes produce slower readings. The concept stays the same, but the noise level changes with the lookback windows.
A shorter moving-average pair reacts faster, which can make crossovers appear earlier and more often. A longer pair reacts more slowly, which can reduce noise but increase lag. The chosen moving averages should be interpreted as smoothing tools, not as proof that one timeframe has universal authority.
FAQ
What does a golden cross mean in trading?
A golden cross means a shorter moving average has crossed above a longer moving average. In trading, it is usually read as a possible bullish structural shift, but the reading depends on what happens after the crossover.
Which moving averages are used for a golden cross?
The most common golden cross uses the 50-day moving average crossing above the 200-day moving average. Other moving-average pairs can be used, but the 50/200 version is the widely recognized convention.
Why can a golden cross fail?
A golden cross can fail when price remains sideways, the moving averages stay flat, or the shorter average quickly falls back below the longer average. The crossover is based on smoothed past prices, so it can appear after much of the move has already developed.
Is a golden cross stronger when the averages separate?
Separation after the crossover usually makes the reading cleaner because recent prices are continuing to pull the shorter average away from the longer baseline. Flat or tangled averages make the reading weaker.
How is a golden cross different from a death cross?
A golden cross forms when the shorter moving average rises above the longer moving average. A death cross is the opposite pattern, where the shorter moving average falls below the longer moving average.