A death cross in trading is a moving-average crossover where a shorter moving average falls below a longer moving average. The common version uses the 50-day moving average crossing below the 200-day moving average, which can mark deterioration in trend structure after price weakness has already developed.
Definition: A death cross is a bearish moving-average crossover in which the shorter average moves below the longer average, showing that recent price behavior has weakened relative to the longer trend reference.
The crossover is a lagging technical-analysis reading because moving averages are calculated from prior prices. Its interpretation is cleaner when the averages, price behavior, and broader chart structure point to the same deterioration instead of a brief moving-average overlap inside a range.
Key Points
- A death cross usually refers to the 50-day moving average crossing below the 200-day moving average.
- The reading belongs to the moving-average crossover family, so it depends on average length, slope, and price behavior.
- The crossover is lagging because moving averages are calculated from prior prices.
- Flat averages, sideways price action, and quick recrosses can dilute the bearish interpretation.
- The opposite directional crossover is the golden cross.
What Is a Death Cross?
A death cross is a trend-based indicator reading created by two moving averages. The shorter average reflects more recent prices, while the longer average responds more slowly to the broader price path.
When the shorter average drops below the longer average, recent price action has weakened enough to pull the faster line under the slower line. In the common 50-day and 200-day version, that means the medium-term average has fallen below the longer-term average.
| Element | Typical death cross role | What it tells the analyst |
|---|---|---|
| Shorter moving average | Commonly the 50-day moving average | Tracks recent trend pressure faster than the long average. |
| Longer moving average | Commonly the 200-day moving average | Provides the slower trend reference. |
| Crossover point | Shorter average moves below the longer average | Marks the moment recent weakness overtakes the longer reference. |
| Post-cross behavior | Separation, flattening, or recross | Helps separate durable deterioration from a weak or noisy overlap. |
The broader moving-average crossover structure matters because a death cross is one directional version of that mechanism. The same logic can appear with different moving-average lengths, but the 50-day and 200-day version is the most widely recognized convention.
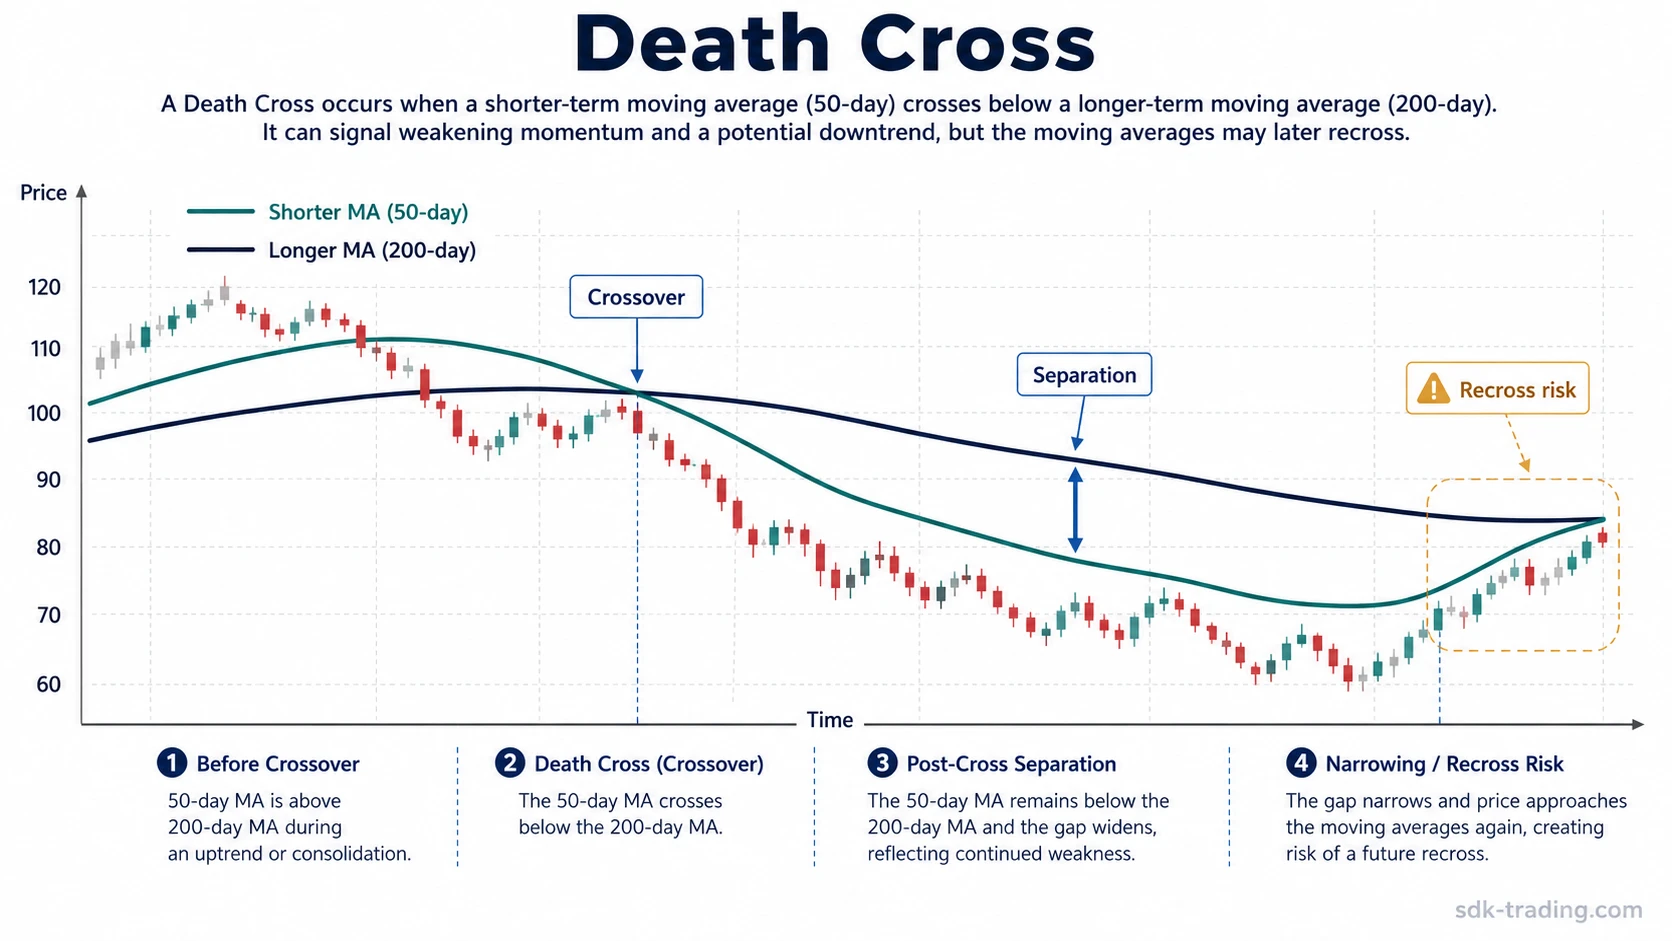
How a Death Cross Forms
A death cross usually develops after price has already weakened enough to pull the shorter moving average lower. The crossover is therefore a result of earlier price behavior, not a fresh measurement that appears before weakness begins.
| Stage | Chart behavior | Interpretation boundary |
|---|---|---|
| Prior ordering | The shorter average remains above the longer average. | The earlier structure still shows the faster average leading the slower one. |
| Convergence | The shorter average rolls over and moves closer to the longer average. | Recent prices are no longer supporting the prior separation. |
| Crossover | The shorter average moves below the longer average. | Recent weakness has become visible in the moving-average relationship. |
| After the cross | The averages separate, flatten, or recross. | The later shape affects whether the crossover remains clean, weak, or diluted. |
The slope of both averages matters. A downward-sloping shorter average crossing below a flat or falling longer average gives a different message than two flat averages touching repeatedly inside a sideways range.
Death Cross Diagnostic Boundary
The crossover alone only identifies the moving-average event. A stronger interpretation needs the surrounding behavior to agree with the same trend-deterioration message.
| Reading quality | What to observe | Why it changes the interpretation |
|---|---|---|
| Qualifies as a death cross | The shorter moving average crosses below the longer moving average. | The basic crossover condition is present. |
| Cleaner deterioration reading | The averages continue separating while price recovery attempts remain weak. | The moving-average structure and price behavior point in the same direction. |
| Weaker reading | The averages are flat, close together, or repeatedly braided. | The cross may reflect range compression more than durable trend deterioration. |
| Diluted or invalid reading | The shorter average quickly recrosses above the longer average. | The initial cross did not hold long enough to show sustained separation. |
This boundary separates the objective event from the quality of the interpretation. The event is the cross; the surrounding structure determines whether the cross carries a clean message.
Clean, Weak, and False-Positive Death Cross Readings
A clean death cross has more than a single line intersection. The shorter average usually slopes lower, the longer average stops rising or begins turning down, and price struggles to reclaim the moving-average area after the crossover.
Clean reading: The shorter average crosses below the longer average, separation expands, and price recovery attempts fail near the moving-average area.
Weak crossover: The averages are nearly flat, price is rotating sideways, and the event looks more like a range-bound overlap than a decisive trend shift.
False-positive risk: The shorter average quickly moves back above the longer average, leaving a brief cross that did not develop into sustained separation.
Sideways markets are a common source of noisy death cross readings. When price rotates around both averages, the lines can cross more than once without producing a stable trend message.
Death Cross vs Related Moving-Average Crossovers
A death cross and a golden cross use the same moving-average relationship in opposite directions. A death cross appears when the shorter average crosses below the longer average; a golden cross appears when the shorter average crosses above the longer average.
The distinction is directional, not strategic. Both crossovers are lagging moving-average events, and both can be distorted by flat averages, parameter choice, and range-bound price action.
| Reading | Basic crossover | Common interpretation | Main caution |
|---|---|---|---|
| Death cross | Shorter average crosses below longer average | Trend-deterioration reading | Can lag and can misread range-bound price action. |
| Golden cross | Shorter average crosses above longer average | Trend-improvement reading | Can lag and can fail if the move lacks follow-through. |
| Moving-average crossover | Any shorter/longer average crossing relationship | Parent mechanism for both directions | Depends heavily on selected averages and market condition. |
Why Death Cross Readings Can Lag
A moving average is built from earlier price data. The longer the lookback period, the slower the average reacts. A 200-day moving average can still reflect prices from many months earlier, so a 50-day and 200-day death cross often appears after weakness has already been visible in price.
That lag is part of the design. The longer average filters short-term noise, while the shorter average reacts faster to recent pressure. The trade-off is that a smoother crossover responds later.
Limitation: A death cross can describe deterioration that has already happened. Treating the crossover as a fresh prediction can overstate what the indicator actually measures.
The 50-day and 200-day pair is common, not universal. A 20-day and 100-day cross reacts differently from a 50-day and 200-day cross. Shorter settings react faster but produce more noise; longer settings filter more noise but respond later.
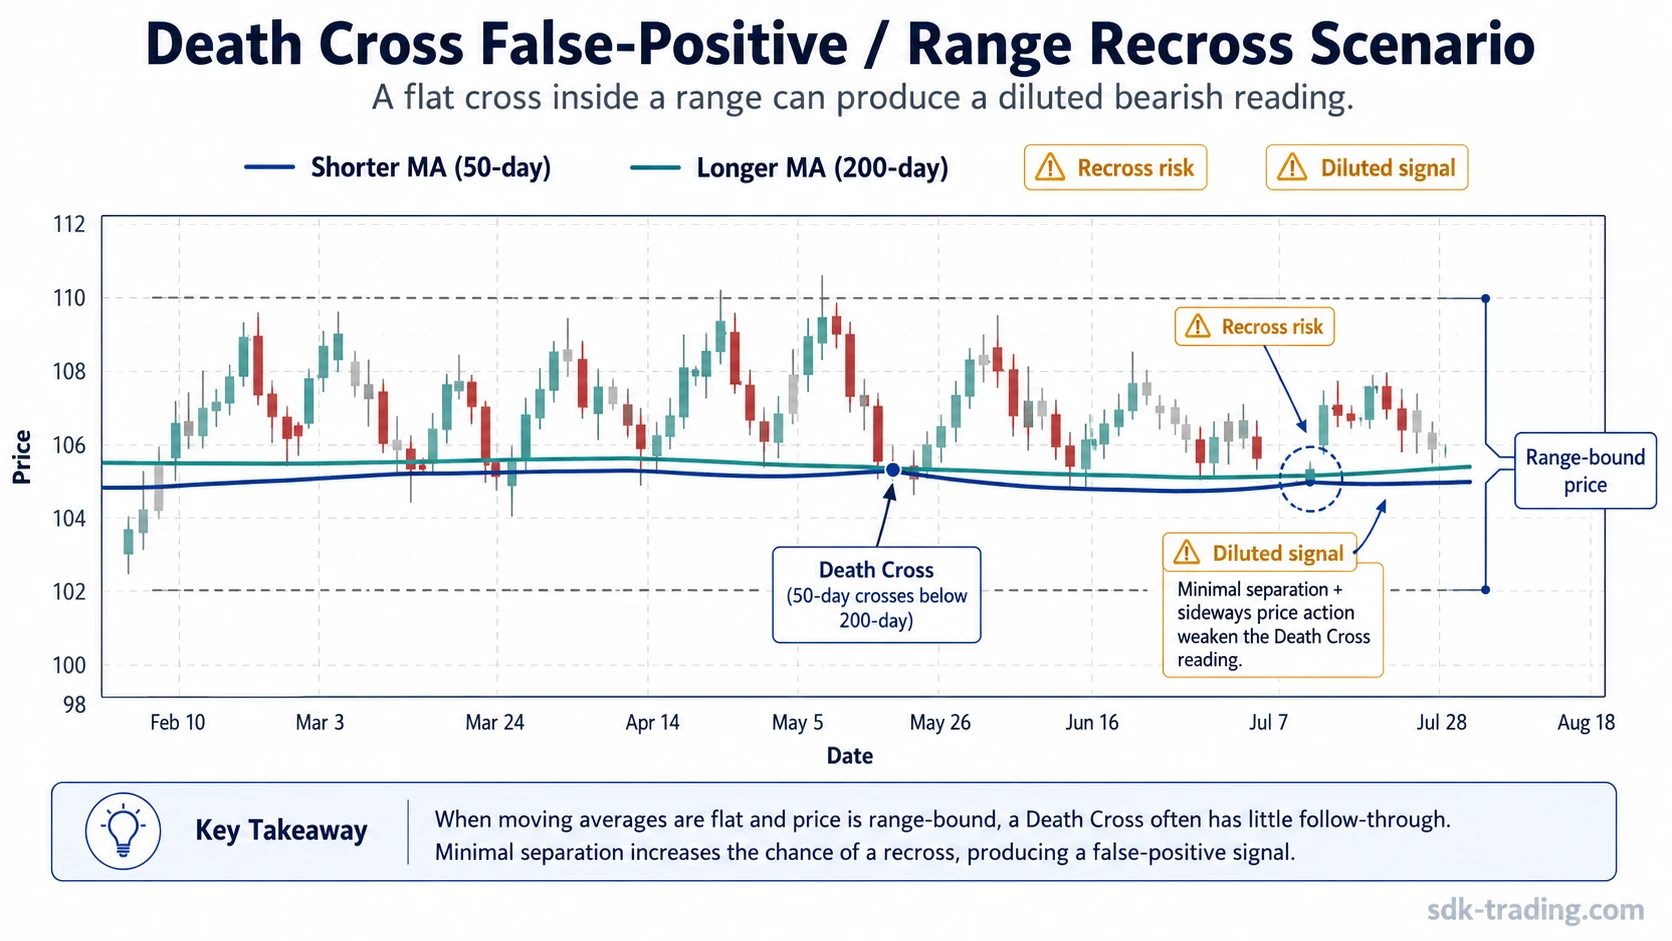
Example Scenario: Range Recross Risk
Price has been moving sideways after a decline, with rallies stalling near the same upper area and pullbacks holding near the same lower area. The 50-day moving average drifts below the 200-day moving average while both averages are nearly flat.
The crossover qualifies as a death cross, but the structure is not especially clean. Price has not expanded lower, the averages have not separated much, and the market is still rotating around the same range. A later move back above the longer average would make the original cross look more like moving-average noise than sustained deterioration.
A cleaner deterioration reading would require more than the initial cross. Expanding separation, weak recovery attempts, and price acceptance below the moving-average area would all support a stronger trend-structure reading.
Common Death Cross Mistakes
The most common mistake is treating the crossover as a complete trading decision. A death cross only describes the relationship between two averages. It does not define risk, timing, position size, or whether price has already absorbed the move.
| Mistake | Why it is risky | Safer interpretation |
|---|---|---|
| Calling every cross bearish | Flat averages can cross repeatedly inside a range. | Check slope, separation, and price location around the averages. |
| Ignoring lag | The cross can appear after a large part of the decline has already happened. | Read the cross as a delayed structure reading, not an early forecast. |
| Using one setting as universal | Different markets and timeframes can respond differently to the same lookback pair. | Treat 50-day and 200-day as a convention, not a universal rule. |
| Confusing event with interpretation | The crossover is objective, but its meaning depends on surrounding behavior. | Separate the fact of the cross from the quality of the reading. |
FAQ
What does a death cross mean in trading?
A death cross means a shorter moving average has fallen below a longer moving average. It is commonly read as a trend-deterioration warning, especially when price action and moving-average slope also show weakness.
Which moving averages are used for a death cross?
The most common death cross uses the 50-day moving average crossing below the 200-day moving average. Other moving-average pairs can be used, but they change the speed and noise level of the reading.
Is a death cross a prediction?
No. A death cross is based on past prices, so it is a lagging indicator reading. It can describe weakening trend structure, but it does not predict a specific future move.
Can a death cross be a false-positive reading?
Yes. False-positive risk increases when the averages are flat, price is range-bound, or the shorter average quickly recrosses above the longer average.
How is a death cross different from a golden cross?
A death cross forms when the shorter average crosses below the longer average. A golden cross forms when the shorter average crosses above the longer average.