A moving average crossover happens when a shorter, faster moving average crosses above or below a longer, slower moving average in a trading chart. The cross shows a change in the relationship between two smoothed price series, but the reading weakens when slope, separation, and raw price structure do not support the move.
Definition: A moving average crossover is a technical-analysis event where one moving average line moves from one side of another moving average line to the other side. The shorter average reacts more quickly to recent price changes, while the longer average smooths more data and usually changes direction more slowly.
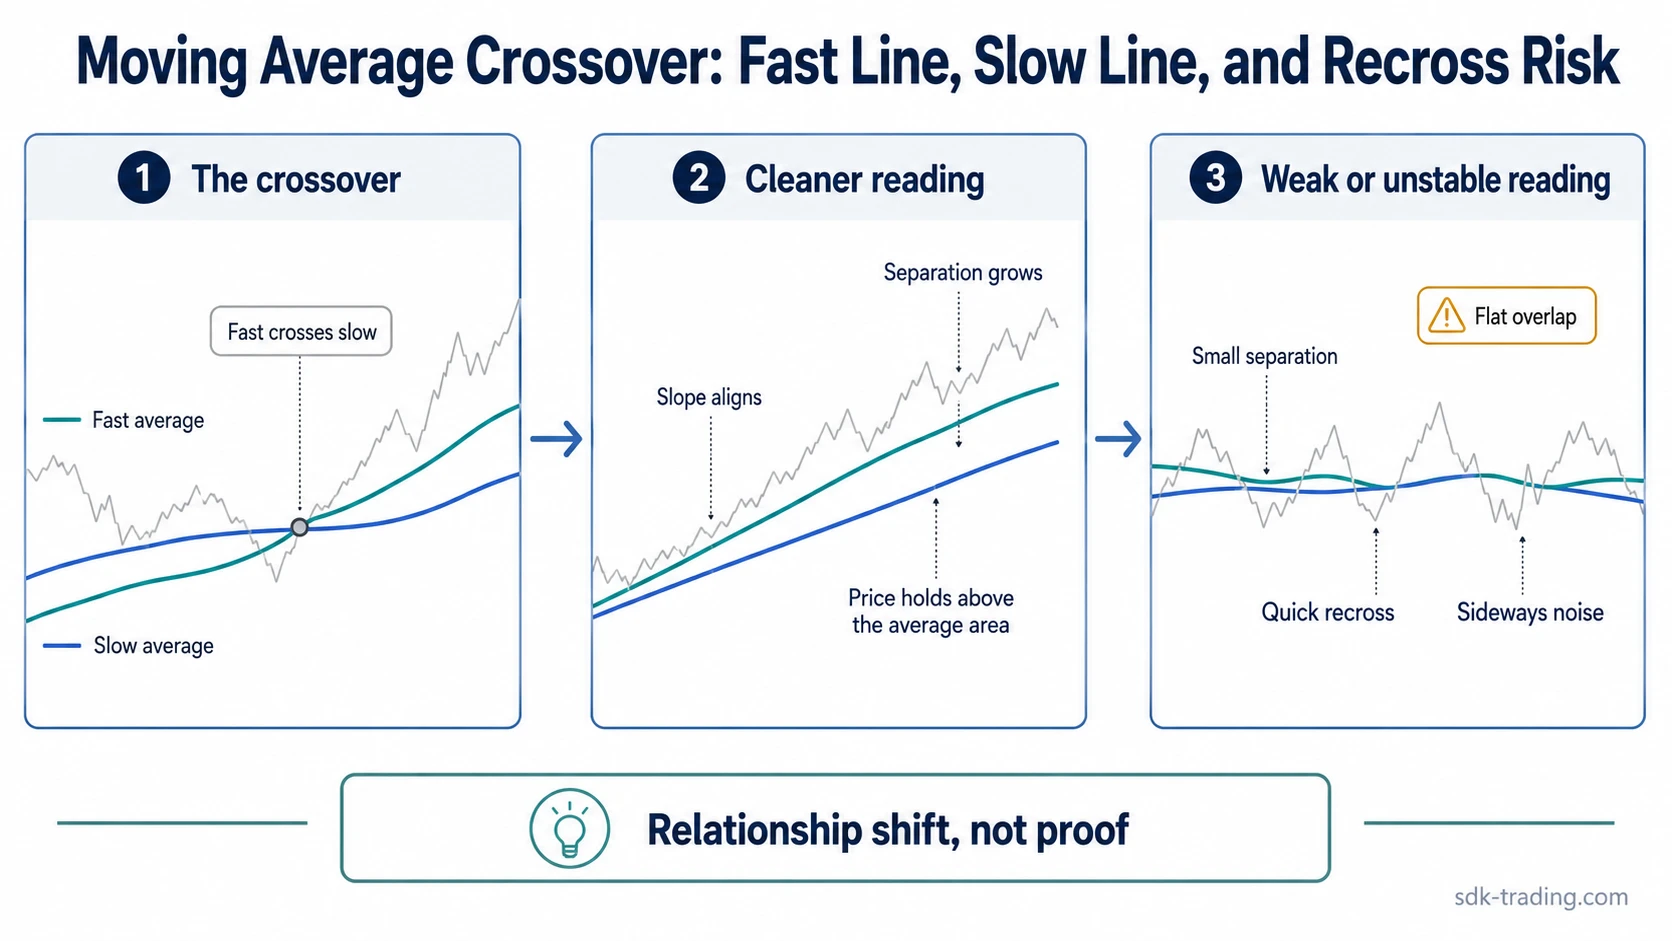
The crossover is best read as a relationship shift, not as proof of future direction. One averaged-price clue can be useful, but the surrounding structure decides whether the cross is clean, late, unstable, or quickly reversed.
Key Points
- A moving average crossover compares two smoothed price series, usually a faster average and a slower average.
- A bullish crossover means the faster average moves above the slower average; a bearish crossover means it moves below.
- Common pairs such as 9/20, 20/50, and 50/200 are examples, not universal settings.
- False crossovers become more likely when averages flatten, overlap, or recross quickly in sideways price action.
What a Moving Average Crossover Means
A moving average reduces raw price movement into a smoother line by averaging prices across a defined lookback window. A crossover appears when two different windows reorder their positions on the chart.
For example, a shorter lookback can turn upward faster after a rebound because it gives more influence to recent prices. A longer lookback usually moves more slowly because older prices remain inside the calculation for longer. The cross marks the point where the shorter smoothed series has moved from one side of the longer smoothed series to the other.
The meaning is conditional. A sharp cross with rising separation may reflect stronger directional pressure than a flat cross where both averages are tangled together. A crossover that appears after price has already traveled far may describe a move that is already mature rather than an early change.
How Fast and Slow Moving Averages Create the Cross
The faster line is normally built from fewer price periods. The slower line is normally built from more periods. Because the shorter window updates with less data, it can turn sooner when recent prices change direction.
The exact behavior depends on the moving-average type. A simple moving average gives equal weight to each price in its window, while exponential and weighted moving averages respond differently because they emphasize recent prices more strongly. The crossover still represents a line relationship, but the responsiveness of each line changes with the calculation method.
Observation note: The cross itself is only the visible event. Slope, distance between the lines, price position, and the next few bars often determine whether the event looks orderly or unstable.
Bullish vs Bearish Moving Average Crossovers
A bullish moving average crossover occurs when the faster average moves above the slower average. In chart-reading terms, this can indicate that recent prices have strengthened enough to pull the shorter smoothed line above the longer one.
A bearish moving average crossover occurs when the faster average moves below the slower average. This can indicate that recent prices have weakened enough to push the shorter smoothed line under the longer one.
Neither version proves that a new trend is underway. A bullish cross can weaken if price cannot hold above the area that produced the cross. A bearish cross can become less meaningful if price quickly recovers and the averages flatten instead of separating.
Common Moving Average Pairs
Moving average pairs are chosen to compare shorter and longer smoothing windows. Shorter pairs usually react faster and can produce more noise. Longer pairs react more slowly and may appear after a larger part of the move has already developed.
| Pair | Typical role | Main limitation |
|---|---|---|
| 9 / 20 | Shorter-term relationship between recent price movement and a slightly slower average. | More sensitive to noise and quick recrosses. |
| 20 / 50 | Intermediate relationship between a faster swing window and a slower trend filter. | Can flatten during sideways movement and produce mixed readings. |
| 50 / 200 | Longer-term relationship often used to describe broader trend deterioration or improvement. | Usually lagging and may appear after a major move has already developed. |
No pair is inherently best. The same pair can behave differently across markets, timeframes, volatility regimes, and moving-average types.
Clean, Weak, and Invalid Crossover Readings
The strongest information gain usually comes from reading the crossover as a condition, then checking whether the surrounding chart behavior supports or weakens that condition. Line separation alone is not enough if raw price behavior fails to hold the area that created the cross.
| Crossover condition | What it may suggest | What weakens the reading | Failure condition |
|---|---|---|---|
| Faster average crosses the slower average with both lines beginning to slope in the same direction. | Recent price behavior is starting to align with the slower smoothing window. | The lines remain close together and price does not extend beyond the prior structure. | Price slips back through the averages and the faster line recrosses quickly. |
| Faster average crosses while the slower average stays flat. | The shorter-term move has changed, but the longer smoothing window has not yet shifted. | Price remains inside a range and the averages braid around each other. | The cross reverses before separation develops. |
| Faster average crosses after a sharp price move has already traveled far from the prior base. | The average relationship shows that recent prices have already moved strongly. | The cross appears late, with price extended and structure no longer offering clean acceptance. | Price rejects the extension and returns through both averages. |
| Faster and slower averages overlap repeatedly. | The market may be moving without a stable directional relationship between the two windows. | Repeated crossovers appear without expanding distance between the lines. | The crossover becomes a whipsaw rather than a useful trend clue. |
Why False Crossovers and Whipsaws Happen
False crossovers often appear when price moves sideways and the two averages flatten into the same area. Small price changes can then push the faster average above and below the slower average without a durable shift in structure.
Whipsaw risk increases when the cross is based on a short, noisy movement rather than a sustained change in price behavior. The faster line reacts first, but the slower line may not reflect the same directional pressure. The result can be a quick cross, a brief separation, and then a recross.
Limitation: A moving average crossover is built from past prices. It can clarify how two smoothing windows have reordered, but it cannot remove lag, predict continuation, or prove that a trend change has become stable.
Moving Average Crossover Example in Context
Price rebounds from a decline and the fast average crosses above the slow average. The first read is tempting because the line relationship has improved. The read remains incomplete if both averages are still flat, the distance between them is small, and price has not held above the area that caused the cross.
The case becomes cleaner when price acceptance improves and the averages begin separating in the same direction. It stays weaker when price falls back through the averages and the fast line quickly crosses back below the slow line. The crossover remains only one averaged relationship unless raw price behavior supports the change.
Related Concepts Without Blurring Them
A moving average crossover is the broad relationship event. A golden cross is a specific bullish 50/200 moving average crossover, so it should not be treated as the whole category.
A death cross is the bearish 50/200 counterpart. It can indicate trend deterioration when the broader structure is also weakening, but it should not be treated as a universal bearish prediction.
A moving average crossover strategy adds application rules, filters, testing assumptions, and risk controls around the crossover. The concept itself remains narrower: it identifies the line relationship before any broader framework is added.
| Concept | What it owns | Boundary |
|---|---|---|
| Moving average crossover | The general event where one moving average crosses another. | Defines the relationship, not the full application process. |
| Golden cross | The 50-period average crossing above the 200-period average. | A bullish long-term subtype, not every bullish crossover. |
| Death cross | The 50-period average crossing below the 200-period average. | A bearish long-term subtype, not every bearish crossover. |
| Moving average crossover strategy | A broader framework for applying crossovers with filters and risk logic. | Explains how crossovers may be used inside a broader framework, not what the crossover means by itself. |
FAQ
What is a moving average crossover?
A moving average crossover is a chart event where a faster moving average crosses above or below a slower moving average. It shows a change in the relationship between two smoothed price series.
What is the difference between a bullish and bearish moving average crossover?
A bullish crossover occurs when the faster average moves above the slower average. A bearish crossover occurs when the faster average moves below the slower average. Both readings still need context from slope, separation, and price structure.
Why do moving average crossovers weaken or reverse quickly?
Moving average crossovers often weaken when price is moving sideways, the averages are flat, or the fast average recrosses the slow average quickly. In those conditions, the crossover may reflect noise rather than a stable directional shift.