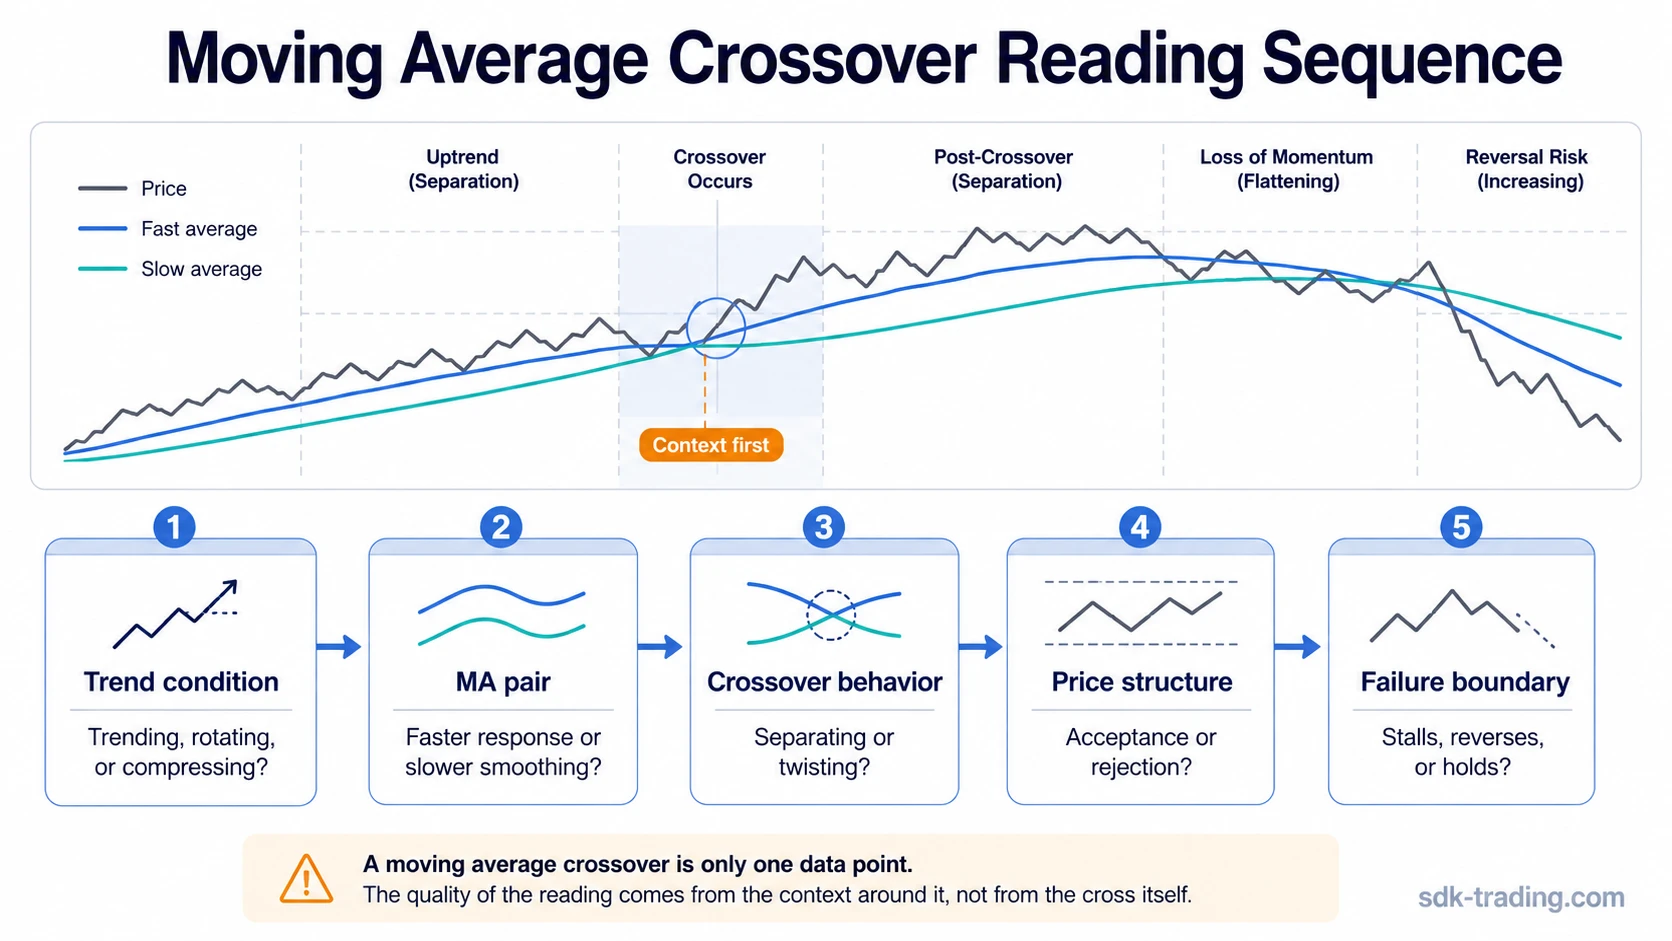
A moving average crossover strategy reads the relationship between a faster and slower moving average only after trend condition, period choice, price structure, and failure boundaries are visible. The crossover is the middle of the process, not the first checkpoint.
A moving average crossover occurs when a shorter-period average moves above or below a longer-period average. A bullish crossover may suggest improving upward pressure, while a bearish crossover may suggest trend deterioration, but both interpretations lose value when the market is flat, late, or already extended.
Definition: A moving average crossover strategy is a conditional framework for interpreting fast and slow moving average interaction across trend context, price behavior, and failure conditions.
Key Points
- A crossover is read after trend condition, not before it.
- Faster averages react sooner but can create more noise.
- Slower averages smooth more data but usually lag more.
- Crossovers lose value when averages flatten or price remains range-bound.
- Risk boundaries describe when the interpretation weakens, not where to place trades.
What a Moving Average Crossover Strategy Reads
The framework reads whether a shorter average is gaining or losing position against a slower reference line. The useful question is not only whether the lines crossed, but whether the surrounding trend and price behavior support the same interpretation.
A rising fast average crossing above a slower average may reflect improving upside pressure. A falling fast average crossing below a slower average may reflect weakening trend pressure. The signal carries less information when the crossover appears after most of the move has already unfolded.
Trend strength changes the quality of the crossover. A separate trend-strength tool such as an ADX trend filter can help separate directional conditions from flat, rotating conditions, but it does not remove uncertainty.
The Crossover Sequence
The sequence starts with market condition. A crossover in a persistent trend carries a different meaning from a crossover inside a choppy range where both averages repeatedly twist around each other.
| Step | What to Check | Interpretation Boundary |
|---|---|---|
| 1. Trend condition | Is price trending, rotating, or compressing? | A crossover inside a range is more exposed to whipsaw. |
| 2. MA pair | Are the averages short-term, medium-term, or long-term? | Shorter pairs react faster; longer pairs lag more. |
| 3. Slope and distance | Are the averages separating or flattening? | Flat averages reduce the value of the cross. |
| 4. Price structure | Is price holding above or below the tested area? | A crossover without price acceptance remains fragile. |
| 5. Failure boundary | Does the cross reverse quickly or stall? | A fast reversal can turn the reading into a false-positive sequence. |
Fast and Slow Moving Averages
The fast average is the more sensitive line. An EMA gives more weight to recent prices, so it often reacts faster than a simple average with the same period.
The slow average acts as the reference line. A SMA is often used as a simple baseline because it weights each price in the lookback window evenly.
Other smoothing choices change the feel of the crossover. A WMA emphasizes recent data through weighted calculation.
Hull moving average responsiveness is designed to reduce lag while keeping smoothing visible, but it still needs trend and price-structure context before the crossover reading carries weight.
The pair choice should match the analytical horizon. A short pair can react quickly but may cross too often, while a long pair may reduce noise but can recognize a shift later.
Common Moving Average Crossover Pairs
Common pairings are useful as examples of sensitivity, not universal settings. The same pair can behave differently across instruments, volatility regimes, and timeframes.
| Pair Example | Typical Use Case | Main Trade-Off |
|---|---|---|
| 9/20 or 9/21 | Shorter-term trend shifts and faster reaction | More noise and more frequent false crosses |
| 20/50 | Intermediate trend tracking | Balances responsiveness and lag, but still fails in ranges |
| 50/200 | Longer-horizon trend filter and major regime examples | Much slower recognition of trend change |
| Three-average variants | Layered short, medium, and long trend comparison | More structure, but also more complexity and delayed agreement |
Golden cross and death cross language usually refers to longer-horizon examples, often around the 50/200 relationship. Those labels should remain slow trend-filter references rather than automatic forecasts.
Scenario Tree for a Moving Average Crossover
A useful crossover reading separates the primary scenario from weaker alternatives before the interpretation becomes too confident. The same cross can support continuation, fail into chop, or reverse quickly depending on the next price behavior.
| Scenario | Market Behavior | Interpretation | Boundary |
|---|---|---|---|
| Primary trend-following scenario | Price holds the direction of the cross, averages slope apart, and pullbacks remain controlled. | The crossover may support the existing trend framework. | The crossover loses weight if price cannot hold the crossed area. |
| Range-bound whipsaw scenario | Price rotates around both averages and the lines repeatedly cross with little separation. | The crossover has low interpretive value because the market lacks directional agreement. | Flat averages and repeated reversals keep the signal unresolved. |
| Failed interpretation scenario | The cross appears late, price rejects the attempted direction, and the averages compress again. | The cross becomes evidence of lag rather than useful trend change. | A quick reversal of the cross invalidates the initial reading. |
Example of a Basic Crossover Reading: Price advances from a prior base and holds above a rising medium-term average. A faster average then crosses above the slower average while both lines begin to slope upward. The interpretation is cleaner if pullbacks hold above the slower line, the averages keep separating, and price does not immediately reject the higher area. The interpretation loses weight if price falls back through the averages, stalls below the crossed area, and the lines flatten again.
When Crossovers Become Weak
Crossovers become weaker when the moving averages are flat, close together, or repeatedly crossing in both directions. That behavior often means price is rotating rather than trending.
Late crosses are another weakness. A bearish cross after a long decline may describe what has already happened. A bullish cross after an extended rise may arrive after the cleanest part of the move has passed.
Price rejection can also damage the interpretation. If price briefly moves in the direction of the cross but cannot stay there, the crossover becomes a question rather than a conclusion.
Common mistake: Treating the crossover as precise timing can hide the lag built into moving averages. The safer interpretation checks whether trend condition, slope, distance between averages, and price acceptance all point in the same direction.
Risk Boundary Without Trade Instructions
A risk boundary is the point where the interpretation becomes weaker or invalid. It is not a stop-loss rule, target rule, or entry instruction.
| Condition | What It Suggests | Boundary for the Reading |
|---|---|---|
| Averages slope apart after the cross | Directional agreement is improving | Watch whether price continues to hold the relevant side of the slower average. |
| Averages flatten after the cross | Momentum may be fading | The crossover loses value if price remains trapped around both averages. |
| Cross reverses quickly | The first reading may have been a whipsaw | The interpretation fails if the attempted trend shift is rejected. |
| Price moves far before the cross | The crossover may be late | The cross may describe lag rather than fresh trend evidence. |
Moving Average Crossover vs Nearby Concepts
A moving average crossover strategy is narrower than a broader moving average strategy. It focuses on the fast/slow relationship and the conditions that make the cross more or less useful.
It is also different from a moving average crossover definition. The definition explains what the cross is; the strategy framework asks when the cross has enough surrounding support to matter.
MACD also uses moving-average logic, but it converts that relationship into an oscillator-style reading with a signal line, histogram, and zero-line context. A simple moving average crossover keeps the relationship visible directly on price or near the price chart.
FAQ
What is a moving average crossover strategy?
A moving average crossover strategy is a framework for reading when a faster moving average crosses a slower moving average, then testing that cross against trend condition, price structure, and failure boundaries.
Which moving average crossover is best?
No moving average pair is universally best. Shorter pairs react faster but create more noise, while longer pairs smooth more data but usually lag more.
Why do moving average crossovers fail in sideways markets?
Sideways markets often keep price rotating around the averages. The lines can cross repeatedly without directional separation, which increases whipsaw risk.
Is a golden cross the same as a moving average crossover?
A golden cross is a specific longer-horizon crossover label, commonly associated with a faster average crossing above a slower long-term average. It is one variant, not the whole framework.