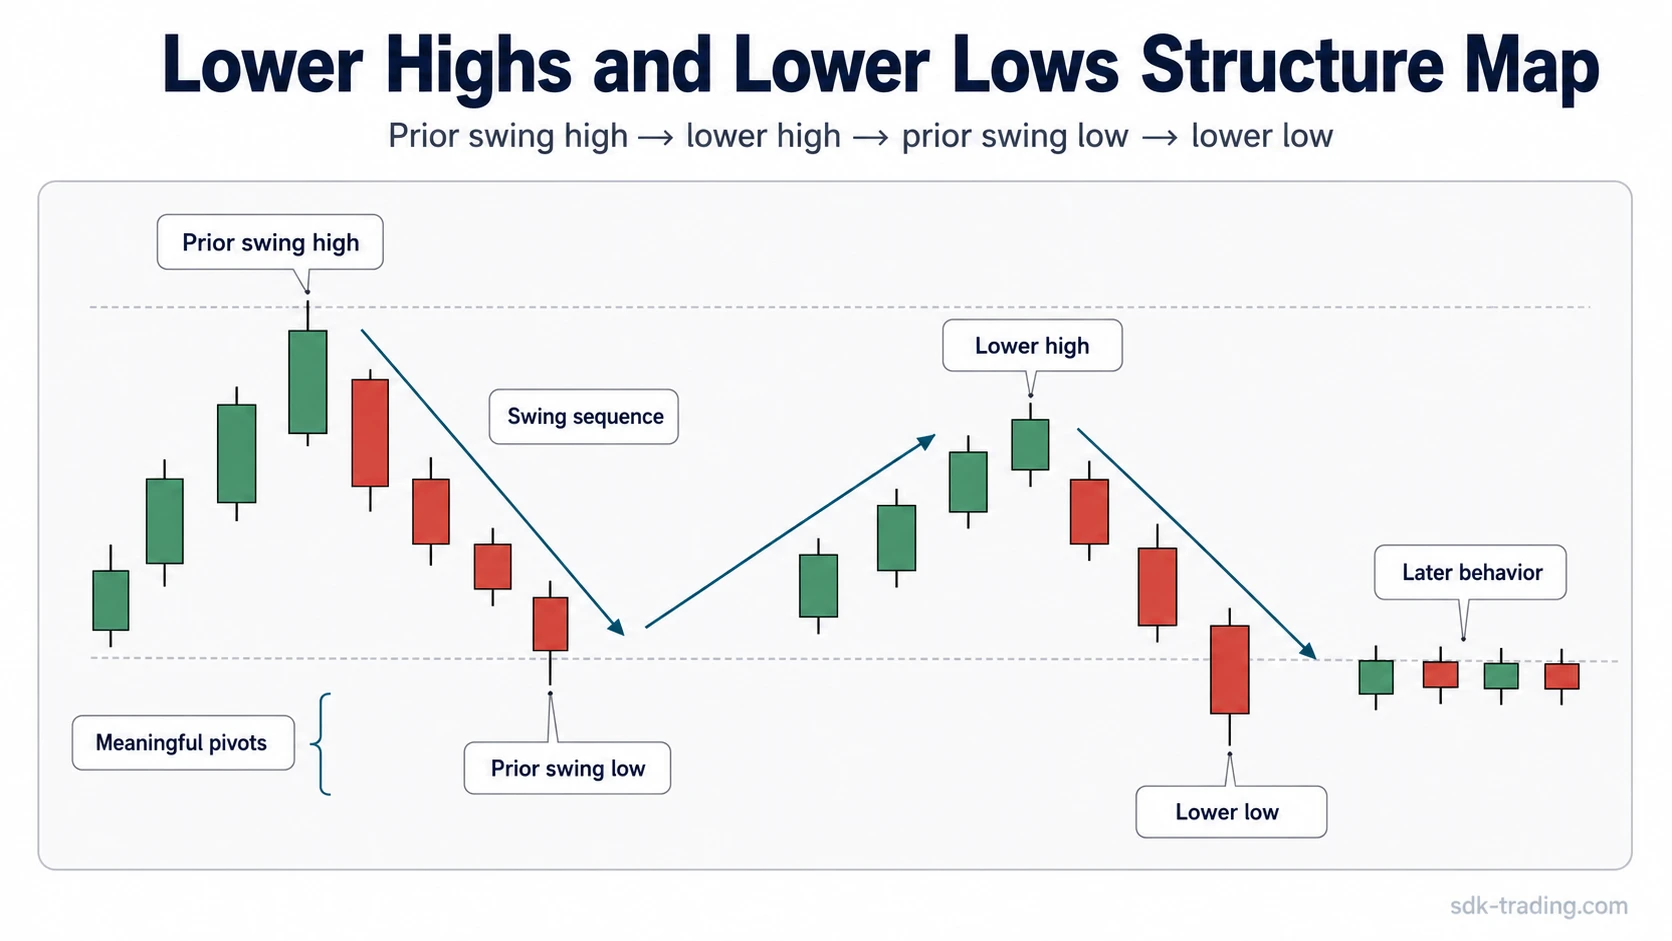
Lower highs and lower lows describe a descending market-structure sequence where each meaningful swing high forms below the prior swing high and each meaningful swing low forms below the prior swing low.
The sequence is usually associated with bearish or downward structure, but it is not a standalone trade signal. The useful classification comes from the relationship between swing points, the continuity of the sequence, and whether later price behavior accepts or rejects the structure.
Definition: Lower highs and lower lows form when price creates a series of declining swing peaks and declining swing troughs. A lower high shows that the next rally failed below the previous swing high. A lower low shows that the next decline moved below the previous swing low.
Key Points
- Lower highs and lower lows describe structure, not a complete trading plan.
- The classification needs meaningful swing points, not isolated candles or random intrabar noise.
- A cleaner sequence normally has both lower peaks and lower troughs, not only one lower high.
- The structure label weakens when price stops making lower lows or begins reclaiming prior lower-high boundaries.
What lower highs and lower lows mean
Lower highs and lower lows mean that each new reaction high is below the previous reaction high, and each new reaction low is below the previous reaction low. The structure shows that price is failing to recover as far as before while also extending lower on the downside.
In market-structure language, that often points to downward control. The important word is often. A descending sequence can be clean, weak, temporary, or already invalid depending on the quality of the swing points and the behavior that follows.
Structural classification: A lower high identifies a failed rally relative to a prior peak. A lower low identifies downside extension relative to a prior trough. The paired sequence matters more than either point alone.
A market can print one lower high during a normal pullback and still avoid forming a full descending sequence. A stronger classification needs a visible relationship between multiple swings, not a single candle color or one short-lived reaction.
How to identify lower highs and lower lows
The first step is to mark meaningful swing points. A swing high is a visible reaction peak where price stops advancing and turns lower. A swing low is a visible reaction trough where price stops declining and turns higher. The sequence becomes lower-highs-and-lower-lows only when the next relevant peak and trough both form below their prior reference points.
| Structure element | What to check | Safer interpretation |
|---|---|---|
| Prior swing high | A visible peak that price previously reacted from | Creates the upper reference point for judging the next rally |
| Prior swing low | A visible trough that price previously reacted from | Creates the lower reference point for judging downside continuation |
| Lower high | The next meaningful rally fails below the prior swing high | Suggests recovery is weaker than the previous recovery |
| Lower low | The next meaningful decline moves below the prior swing low | Shows downside extension within the sequence |
| Continuity | The pattern repeats or later behavior respects the same structure | Makes the sequence cleaner than a one-off reaction |
Timeframe matters. A chart can show lower highs and lower lows on a smaller timeframe while a larger timeframe is still range-bound or advancing. The cleanest classification comes when the selected timeframe has visible swings and the same sequence is not being contradicted by obvious higher-timeframe structure.
False-positive boundary: A red candle is not automatically a lower low. A small pullback is not automatically a new swing. A wick below a prior low begins a question, but the structure becomes clearer only after the market either accepts the lower area or rejects it.
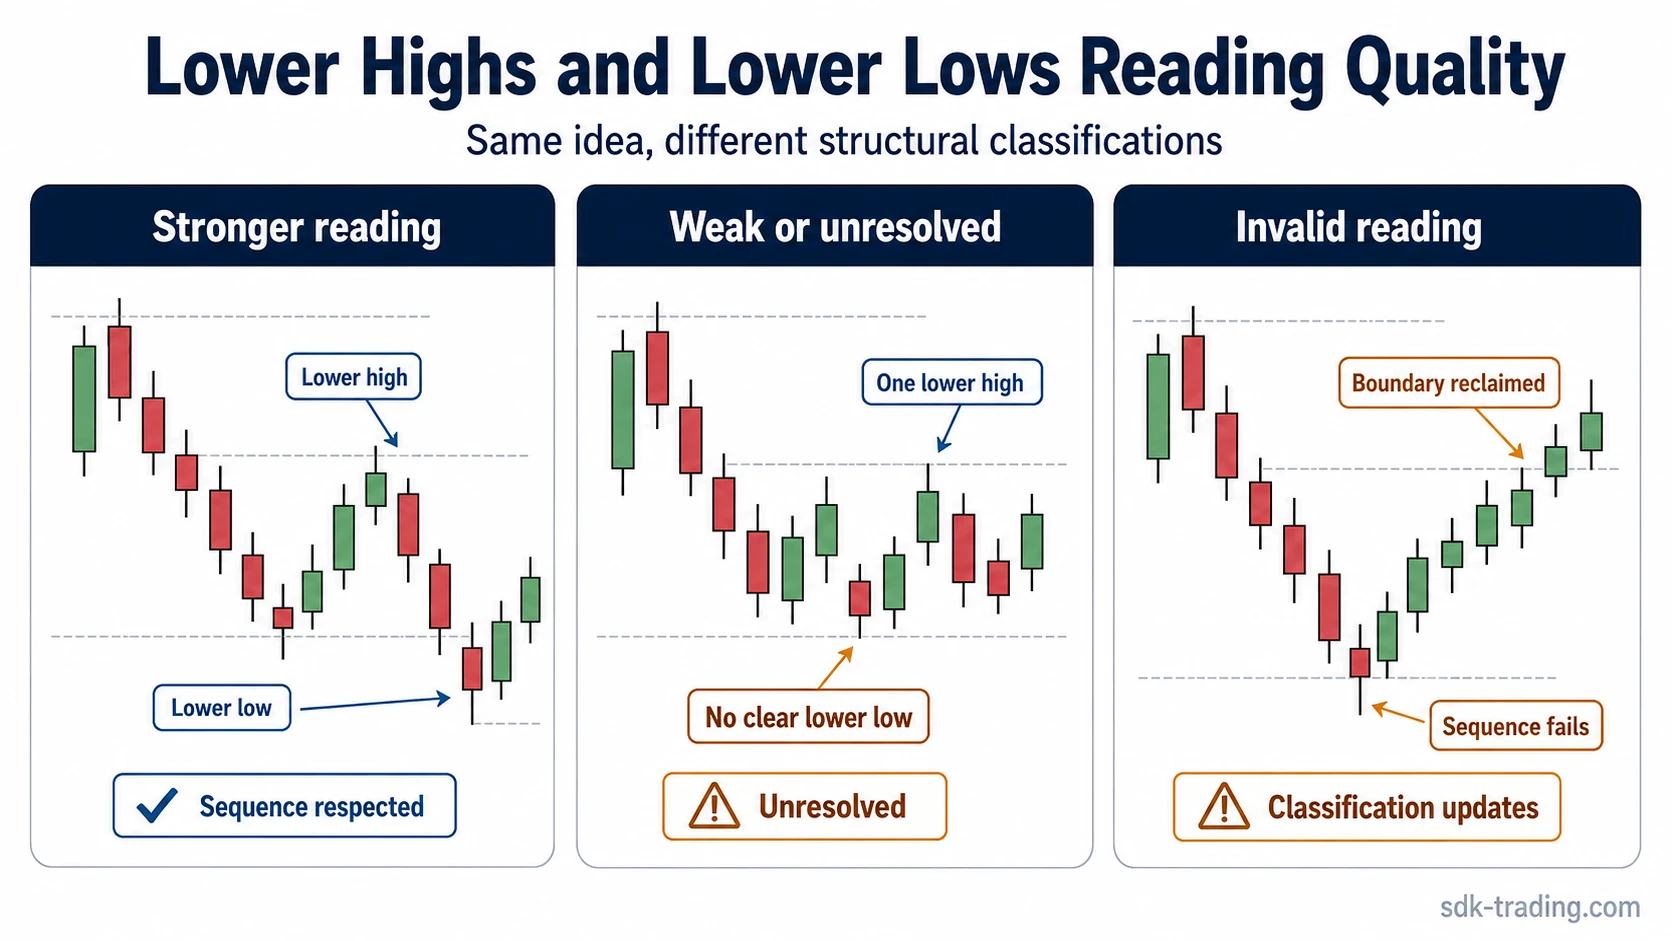
Clean, weak, and invalid lower-highs/lower-lows readings
The same phrase can describe very different chart conditions. A clean classification has visible swing structure and follow-through. A weak structure label has incomplete evidence. An invalid label appears when the old boundary is reclaimed or the descending sequence stops behaving like a sequence.
| Reading quality | Observable condition | Classification |
|---|---|---|
| Cleaner reading | Price forms a visible lower high, then breaks below the prior swing low, and later rallies fail below the lower-high area. | The descending structure is easier to classify because both lower peaks and lower troughs remain visible. |
| Weak or unresolved reading | Price forms one lower high but does not create a meaningful lower low, or the movement happens inside a choppy range. | The structure is incomplete. The sequence may remain a pullback, range movement, or noise until later behavior gives more context. |
| Invalid reading | Price reclaims the lower-high boundary, stops producing lower lows, or restores the prior swing structure. | The old lower-highs-and-lower-lows classification no longer fits the current structure. |
Confirmation and invalidation should be treated as classification tools. They help decide whether the structure is still present, weakening, or already replaced by different behavior. They do not convert the pattern into an instruction to act.
Acceptance versus failure: A break below a prior swing low matters more when price accepts that lower area through later behavior. If price quickly returns above the broken area and reclaims the lower-high boundary, the descending sequence becomes less reliable as a structure label.
Lower highs and lower lows vs related market-structure concepts
Lower highs and lower lows describe a descending sequence of swing points. Nearby concepts can appear around the same chart area, but they do not mean the same thing.
| Concept | Main role | How it differs from lower highs and lower lows |
|---|---|---|
| Higher highs and higher lows | Advancing swing sequence | It describes the opposite structure: rising swing highs and rising swing lows. |
| Swing highs and swing lows | Raw pivot identification | It identifies the peaks and troughs used to classify structure, but it does not automatically define a descending sequence. |
| Break of structure | Structural level break | It focuses on the event of a level being broken, while lower highs and lower lows describe the broader swing sequence. |
| Change of character | Possible interruption of prior control | It focuses on a shift against the prior sequence, not the existence of a complete descending sequence by itself. |
| Market structure shift | Broader state-change classification | It classifies a larger change in market behavior, while lower highs and lower lows describe one specific directional sequence. |
Common mistakes when reading lower highs and lower lows
Most false readings come from labeling structure before enough swing information exists. A lower high can be the start of a descending sequence, but it is not the whole sequence. A lower low can be meaningful, but it needs a clear prior swing low for comparison.
| Mistake | Why it creates a bad reading | Cleaner approach |
|---|---|---|
| Treating one lower high as a full sequence | One failed rally does not prove that lower lows are also forming. | Check whether the next decline creates a meaningful lower low. |
| Calling every red candle a lower low | Candle color does not define swing structure. | Use visible pivot points and compare them to prior pivots. |
| Ignoring timeframe | A small descending sequence can exist inside a larger range or larger uptrend. | Classify the structure on the timeframe being analyzed and avoid mixing signals casually. |
| Turning structure into trade direction | A structural label does not include execution rules or a complete risk framework. | Keep the classification neutral unless a separate framework is being evaluated. |
| Keeping the label after a reclaim | A reclaimed lower-high boundary can weaken or invalidate the old sequence. | Update the classification when later price behavior restores prior structure. |
Candles are secondary: Individual candles can help describe how price reacted, but the swing sequence decides whether lower highs and lower lows are actually present.
Practical example
Imagine price rallies into a visible swing high, pulls back into a visible swing low, then rallies again but fails below the first high. That failed rally creates a possible lower high. If the next decline moves below the prior swing low, the chart now has both a lower high and a lower low.
The label stays cleaner while rallies continue to fail below the lower-high area. It weakens if the next decline cannot extend below the prior low, and it fails if price reclaims the boundary that was supposed to define the lower high.
The classification lesson is simple: lower highs and lower lows are not identified from one candle or one reaction. The structure needs a sequence, a reference boundary, and later behavior that either respects or rejects the descending pattern.
FAQ
Is one lower high enough to confirm lower highs and lower lows?
No. One lower high can start the question, but a full lower-highs-and-lower-lows reading also needs a meaningful lower low and later behavior that does not immediately invalidate the sequence.
Do lower highs and lower lows automatically mean a downtrend?
No. They often describe downward structure on the selected timeframe, but context matters. The same sequence can be weak, temporary, or part of a larger range if the broader structure does not support it.
What invalidates lower highs and lower lows?
The reading weakens or fails when price stops forming lower lows, reclaims the lower-high boundary, or restores the prior swing structure. Invalidation is a classification update, not a trading instruction.
How are lower highs and lower lows different from swing highs and swing lows?
Swing highs and swing lows are the pivot points. Lower highs and lower lows are the descending relationship between those pivot points over a sequence.