Swing highs and swing lows are visible pivot points in market structure. A swing high is an upper pivot where price has turned down from a local high area, while a swing low is a lower pivot where price has turned up from a local low area. Their value depends on surrounding price behavior, timeframe, and what price later does around the pivot.
Definition: In trading, swing highs and swing lows are structural reference points used to read how price moves from one pivot area to another. They help organize a chart into peaks, troughs, ranges, and sequences, but they do not create trading instructions by themselves.
Key Points
- A swing high is a local upper pivot where price forms a visible high before moving lower.
- A swing low is a local lower pivot where price forms a visible low before moving higher.
- Useful swing points need context, such as surrounding candles, separation from noise, and timeframe fit.
- A clear swing reading is stronger when price later respects the pivot area.
- A weak or failed swing reading can appear when the pivot is shallow, noisy, or reabsorbed into the previous range.
What Are Swing Highs and Swing Lows?
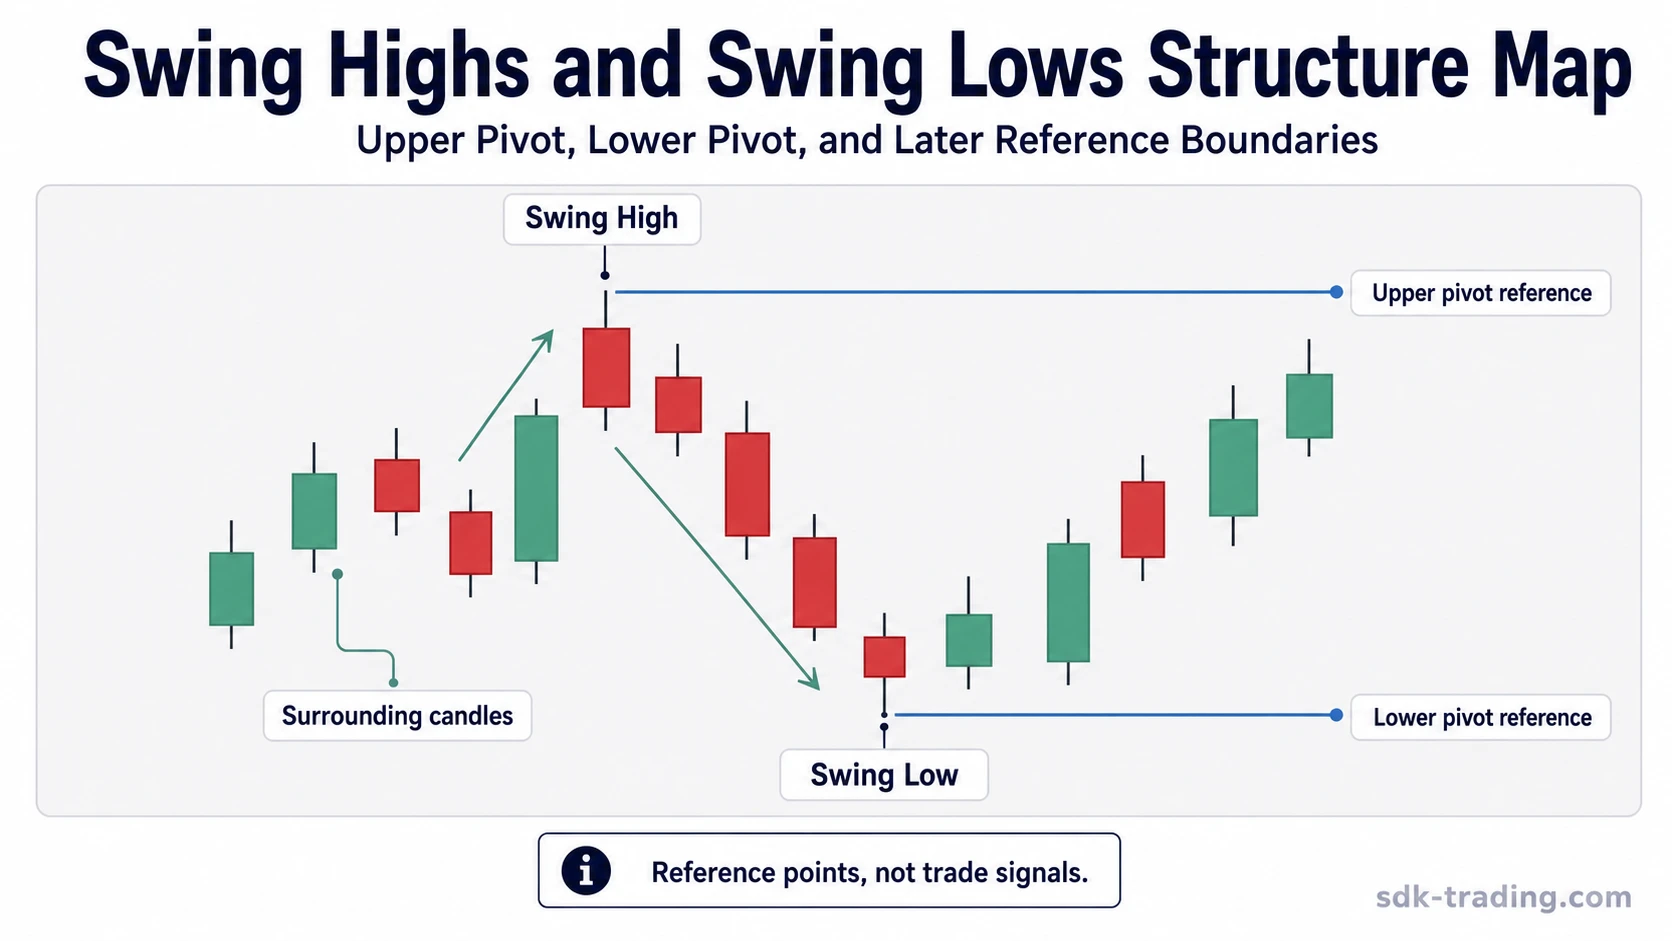
Swing highs and swing lows are the basic pivot units of price action. They divide a chart into turning areas rather than treating every candle high or candle low as equally meaningful. A market swing is clearer when the move into the pivot, the reaction away from it, and the later response around that area are visible enough to compare with surrounding structure.
A swing high marks an upper turning area. Price pushes into a local high, then trades lower enough for that high to stand out from the surrounding action. A swing low marks a lower turning area. Price pushes into a local low, then trades higher enough for that low to stand out from nearby price action.
Structural role: Swing highs and swing lows are reference points. They help define where price has previously turned, where structure may be changing, and whether later pivots are forming above, below, or inside earlier boundaries.
Swing High vs Swing Low Anatomy
| Pivot type | Basic shape | What makes it visible | Structural role |
|---|---|---|---|
| Swing high | A local peak or upper pivot | Nearby price action sits below the high area before and after the pivot | Creates an upper reference boundary for later structure comparison |
| Swing low | A local trough or lower pivot | Nearby price action sits above the low area before and after the pivot | Creates a lower reference boundary for later structure comparison |
The simple three-candle model is often used as a starting observation. A basic swing high may have a high that is higher than the candles immediately before and after it. A basic swing low may have a low that is lower than the candles immediately before and after it. That model is useful for recognition, but it is not enough by itself. A meaningful pivot also needs visible separation from surrounding noise.
How to Identify Swing Highs and Swing Lows
Identifying swing highs and swing lows starts with asking whether a pivot is visible enough to matter on the selected timeframe. A small turn inside choppy price action may be technically visible but still too minor to shape the structure reading. A stronger pivot usually has clearer movement into the area, a visible reaction away from it, and enough distance from surrounding candles to act as a reference point.
- Find the local turning area: Look for a visible upper turn for a swing high or a visible lower turn for a swing low.
- Check surrounding price behavior: Compare the pivot with nearby candles or nearby swing movement, not with a single isolated candle only.
- Separate structure from noise: Ignore tiny fluctuations that do not affect the wider chart structure.
- Match the timeframe: A pivot on a lower timeframe may disappear inside a larger candle range on a higher timeframe.
- Wait for later context: A pivot gains structural weight when price later respects, breaks, or reclassifies the area.
Important limitation: Swing identification is partly observer-dependent. The same chart can show minor swings on a lower timeframe and broader swings on a higher timeframe. The useful question is not whether every pivot can be named, but whether the pivot changes the structure reading.
Clear, Weak, and Failed Swing Readings
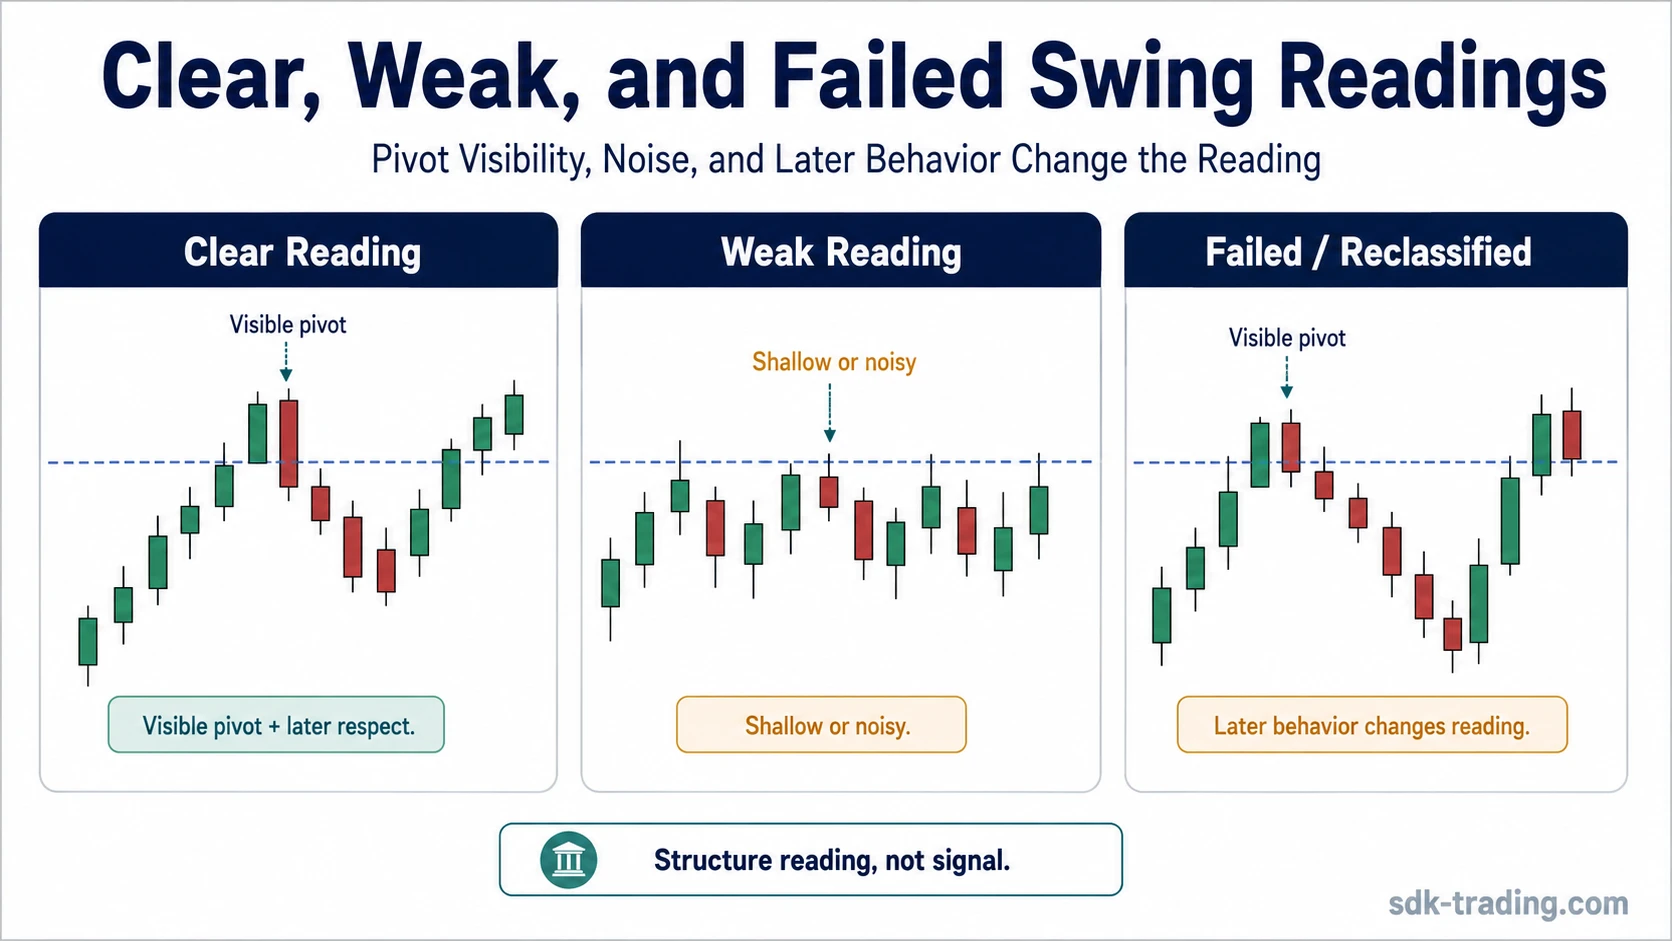
A swing point is not equally useful in every chart condition. Some pivots are clear because price reacts from them cleanly and later respects the area. Other pivots remain weak because they form inside noise, overlap, or shallow movement. Some pivots later lose usefulness when price returns through the area and the earlier reading no longer describes the structure well.
| Reading quality | Typical features | Safer interpretation |
|---|---|---|
| Clear swing reading | Visible pivot, clean surrounding movement, and later behavior that respects the area | The pivot can function as a meaningful structure reference. |
| Weak swing reading | Shallow pivot, overlapping candles, noisy range, or unclear timeframe fit | The pivot may be visible but should not carry too much structural weight. |
| Failed or reclassified reading | Later price returns through the pivot area or back inside the prior range | The earlier pivot may need to be downgraded or folded into a different structure reading. |
The failed or reclassified category is especially important. A swing high or swing low can look meaningful at first, then lose clarity if later price action moves back through the same area without respecting it. That does not make the original observation useless; it means later evidence changed the structure reading.
Swing Highs and Swing Lows in Market Structure
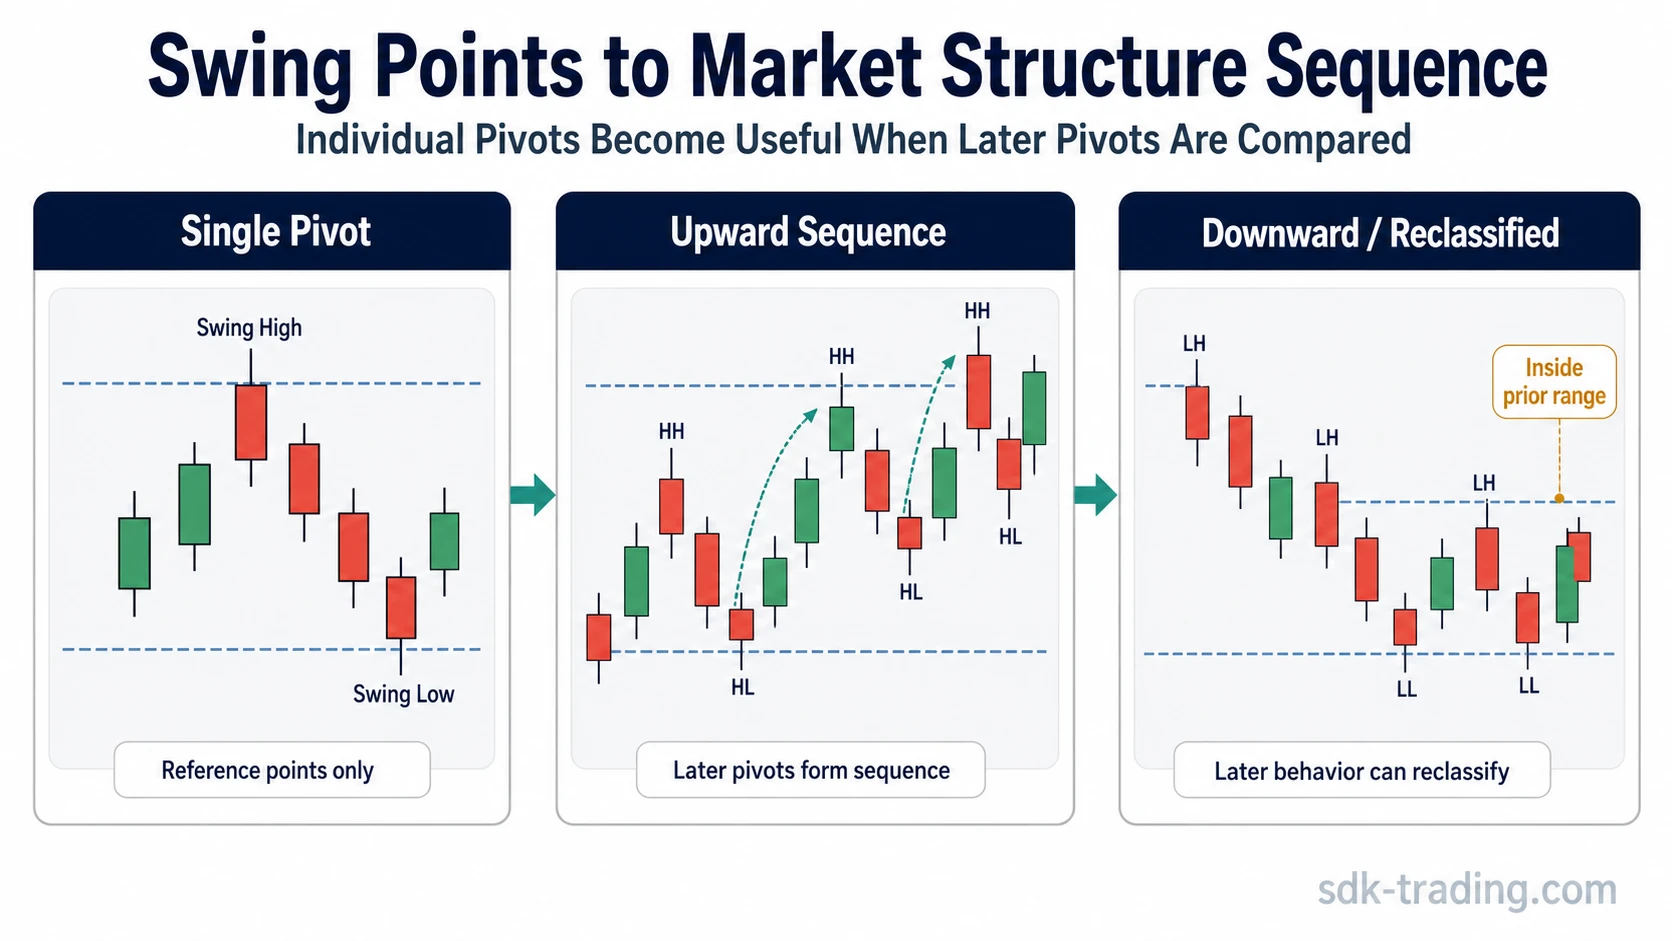
Swing highs and swing lows become more useful when they are compared as sequences. A single pivot describes one turning area. A sequence of pivots describes whether price is expanding upward, expanding downward, rotating inside a range, or failing to maintain a prior structure.
When later swing highs and later swing lows form above earlier pivots, the sequence can support a higher highs and higher lows reading. When later swing highs and later swing lows form below earlier pivots, the sequence can support a lower highs and lower lows reading.
Break of structure, CHOCH, and market structure shift readings also depend on swing points, but those labels describe later events around prior boundaries. The swing high or swing low is the reference point; later price behavior decides whether a structure event has enough context to matter.
Practical Scenario
A market forms a visible upper pivot after a push higher, then pulls back into a lower pivot. At first, both points are only reference areas. The upper pivot gains weight if price reacts around it or moves beyond it with clearer follow-through. The lower pivot gains weight if price holds above it and creates a cleaner comparison point. If price falls back through that lower pivot and returns into the earlier range, the prior structure reading weakens.
The first pivot starts the structure map, but later behavior tests it. Swing highs and swing lows work best as reference boundaries that organize price behavior over time.
Common Mistakes and Limitations
| Mistake | Why it creates a problem | Cleaner interpretation |
|---|---|---|
| Labeling every minor fluctuation | The chart becomes crowded with pivots that do not affect the structure. | Focus on swings that stand out from surrounding price action. |
| Ignoring timeframe | A pivot can look important on one timeframe and insignificant on another. | Judge the swing inside the timeframe being analyzed. |
| Treating a wick as enough | A brief probe may not change the wider structure. | Use the wick, body, close, and later behavior as separate pieces of evidence. |
| Reading one swing as a full trend | One pivot cannot describe a complete sequence. | Compare multiple pivots before assigning structural direction. |
| Overusing indicators | Tools can mark pivots mechanically without judging context. | Use tools only as aids; price structure remains the main reference. |
Fractals and ZigZag tools: These tools can help mark possible swing points, but they do not remove the need for chart context. A tool can identify a pivot mechanically while the broader structure remains unclear.
What Swing Highs and Swing Lows Are Not
Swing highs and swing lows are not automatic trading instructions. They are not proof that a reversal or continuation will happen. They also are not the same thing as a complete market-structure sequence.
- Not every small high or low matters: Minor fluctuations often sit inside larger structure.
- Not a complete trend reading: A trend sequence requires comparison between multiple pivots.
- Not a certainty tool: Later price behavior can weaken or reclassify an earlier pivot.
- Not identical to support and resistance: Swing points can help define reference areas, but support and resistance require a broader reaction history.
Related Concepts
Swing highs and swing lows sit beneath many market-structure labels. Higher-high and higher-low sequences, lower-high and lower-low sequences, break of structure, CHOCH, and market structure shift all require prior pivot references. The important distinction is that swing points identify turning areas, while later structure labels describe what price does with those areas.
| Concept | Relationship to swing points |
|---|---|
| Higher highs and higher lows | Uses rising swing highs and rising swing lows to describe upward structural progression. |
| Lower highs and lower lows | Uses falling swing highs and falling swing lows to describe downward structural progression. |
| Break of structure | Depends on whether price moves beyond a prior swing boundary with enough context. |
| CHOCH or market structure shift | Uses prior swing boundaries to judge whether behavior has changed compared with the earlier sequence. |
FAQ
What is a swing high and swing low in trading?
A swing high is a visible upper pivot where price turns down from a local high area. A swing low is a visible lower pivot where price turns up from a local low area. Both are structural reference points used to compare later price behavior.
How do you identify swing highs and lows?
Start with visible turning areas, then compare them with surrounding candles, nearby pivots, timeframe, and later behavior. A simple three-candle pattern can help with recognition, but meaningful swing points need broader context.
Are swing highs and swing lows the same as support and resistance?
No. Swing highs and swing lows are pivot points. Support and resistance are broader reference areas that usually require repeated reactions or stronger historical context around a price zone.
Can one swing point define market structure?
No. One swing point marks a turning area. Market structure needs comparison between multiple swing highs and swing lows, plus later behavior around those pivot boundaries.
Do swing highs and swing lows give trade signals?
No. Swing highs and swing lows mark structural pivot areas. They can help organize chart context, but they do not create entry, exit, or trade direction instructions by themselves.