Maximum drawdown is the largest peak-to-trough decline in an account, portfolio, or strategy before a new high or recovery point is reached. It measures the deepest historical damage path between a prior high and a later low, not a prediction of what price will do next.
Definition: Maximum drawdown measures how far value fell from a previous peak to the lowest trough that occurred before recovery or a new high. It is usually expressed as a percentage of the peak value.
The boundary is that maximum drawdown describes historical downside exposure inside an equity curve. It does not tell a trader where to enter, where to exit, where to place a stop, or whether a market is about to reverse.
Key Points
- Maximum drawdown focuses on the worst peak-to-trough decline, not every loss.
- The measurement depends on the highest value reached before the decline and the lowest value reached before recovery.
- A strong final return can still hide a difficult loss path if the account suffered a deep drawdown along the way.
- The metric helps describe capital pressure and recovery burden, but it does not forecast future losses.
What Is Maximum Drawdown?
Maximum drawdown is a retrospective risk metric. It looks backward across an account, portfolio, fund, or strategy record and asks one specific question: how much did value fall from the highest point to the lowest point before recovery?
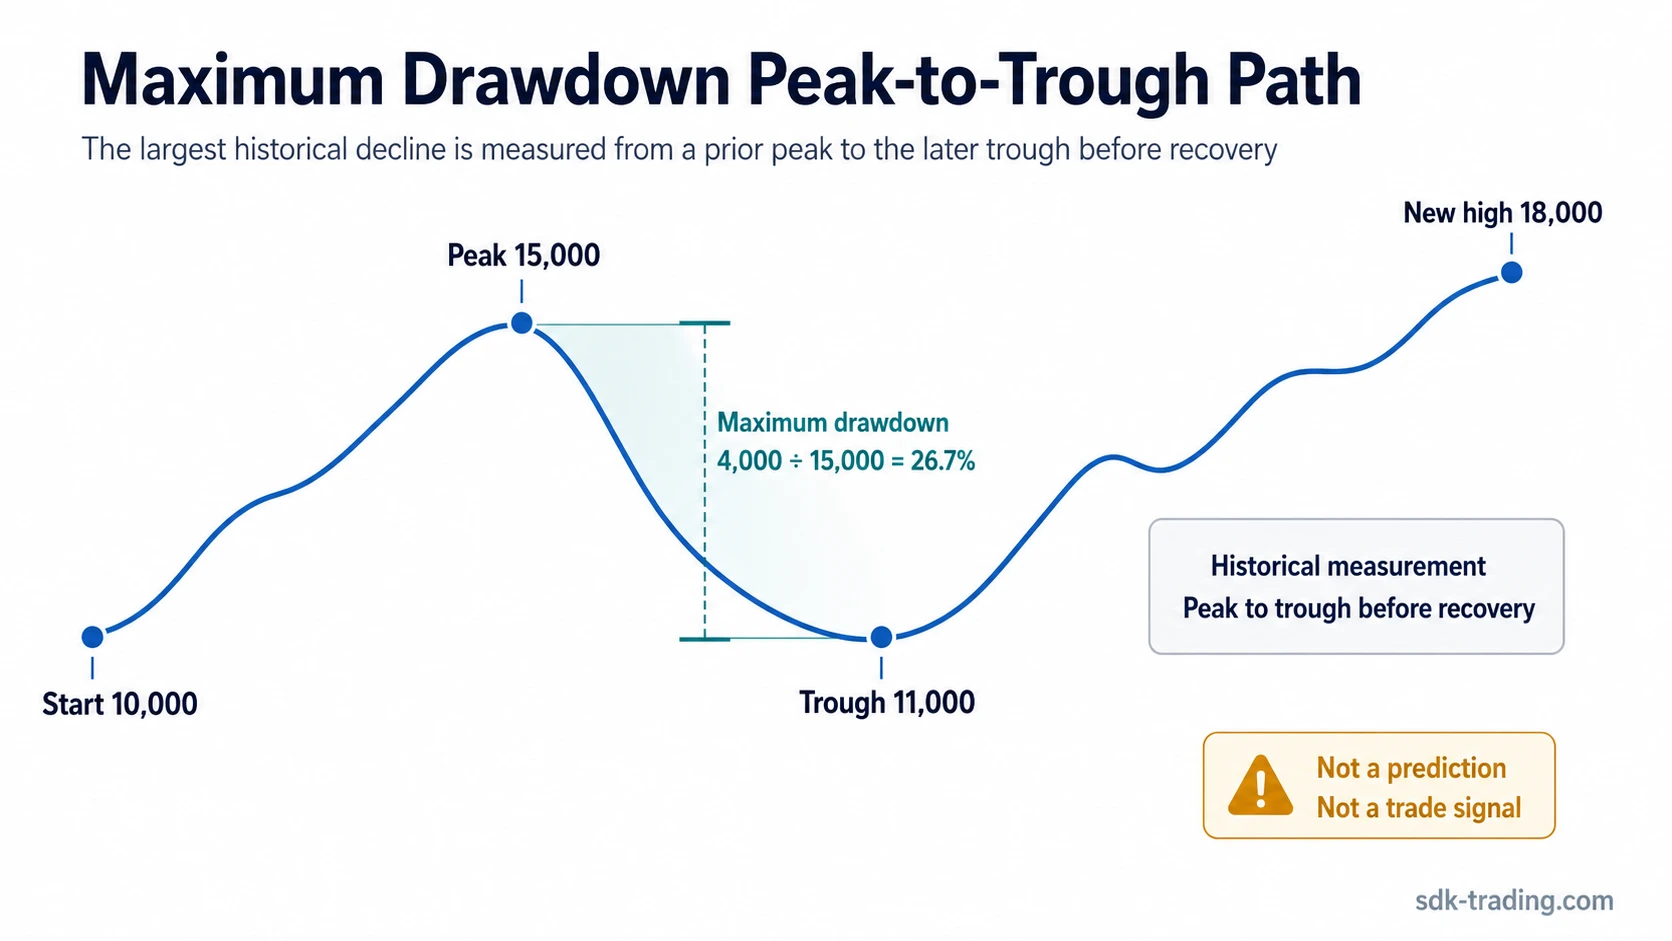
For example, if an equity curve rises to 15,000, falls to 11,000, and later recovers, the maximum drawdown for that peak-to-trough segment is based on the fall from 15,000 to 11,000. The later recovery does not erase the decline the account had to absorb first.
This makes maximum drawdown different from a simple return number. A strategy can finish positive while still exposing the trader to a severe account decline along the way. The final gain shows the endpoint; maximum drawdown shows the worst loss path that occurred before the endpoint.
Core boundary: maximum drawdown is a risk measurement, not a trade signal. It can describe how difficult a historical equity curve became, but it does not decide whether a new trade is valid.
Maximum Drawdown Formula
The standard positive drawdown formula is:
Maximum drawdown = (Peak value – Trough value) / Peak value
When shown as a positive percentage, the result is multiplied by 100. Some reports show drawdown as a negative return using the formula (Trough value – Peak value) / Peak value. Both versions describe the same decline, but the positive version is often easier to read as “the account fell by X%.”
| Input | Meaning | Example value |
|---|---|---|
| Peak value | The highest account or portfolio value before the decline | 15,000 |
| Trough value | The lowest value reached after that peak before recovery | 11,000 |
| Drawdown amount | The difference between the peak and the trough | 4,000 |
| Maximum drawdown | 4,000 / 15,000 | 26.7% |
In this illustrative example, the account did not fall by 4,000 relative to the starting balance. It fell by 4,000 relative to the prior peak. That distinction matters because maximum drawdown measures the decline from the highest reached value, not only the change from the original deposit or the final outcome.
How Peak, Trough, and Recovery Define the Measurement
A valid maximum drawdown reading needs three parts: a peak, a trough, and a recovery boundary. The peak is the high point before the decline. The trough is the lowest value after that peak. The recovery boundary is the point where the account returns to the old peak or reaches a new high.
- Peak: the account reaches a high value.
- Decline: the account falls from that high.
- Trough: the account reaches its lowest point before recovering.
- Recovery or new high: the drawdown segment ends when the old high is recovered or exceeded.
The trough is not simply the first losing trade after a peak. It is the lowest point in the decline sequence before the account recovers. A small loss after a peak may begin the drawdown, but the maximum drawdown is not known until the deepest point of that decline is established.
Illustrative scenario: an account starts at 10,000, rises to 15,000, falls to 11,000, and later rises to 18,000. The account finished higher than where it began, but the maximum drawdown still records the fall from 15,000 to 11,000. That 26.7% decline shows the largest capital decline the trader had to tolerate before the later recovery.
A final return number can hide the path required to reach it. Deep drawdowns can create emotional and process pressure, especially when the trader judges the strategy only by final return and ignores the path required to reach it.
What Maximum Drawdown Shows
Maximum drawdown shows the largest historical decline from an equity-curve peak. Its main value is not that it predicts the next loss. Its value is that it exposes how much the account fell during the worst observed decline.
| What it shows | Why it matters |
|---|---|
| Worst peak-to-trough decline | Shows the deepest historical loss path in the record being measured. |
| Capital pressure | Shows how much equity had to be recovered before the account returned to its old high. |
| Strategy survival pressure | Helps reveal whether a strategy’s path may be difficult to tolerate even if its final return looks acceptable. |
| Return-path quality | Separates a smooth equity curve from one that reaches a similar endpoint after a deep decline. |
For trading analysis, maximum drawdown is often most useful when it prevents a common decision mistake: judging a system only by final return. A return figure tells the trader where the equity curve ended. Maximum drawdown shows the worst decline that happened on the way there.
What Maximum Drawdown Does Not Show
Maximum drawdown is narrow by design. It identifies the worst decline, but it does not explain every risk inside a strategy or account path.
| Misreading | Safer interpretation |
|---|---|
| “Maximum drawdown predicts the next decline.” | It describes a past decline. Future losses can be smaller, larger, faster, or shaped differently. |
| “A lower maximum drawdown is always better.” | Lower drawdown can be preferable, but it must be interpreted with return path, strategy type, time horizon, and risk exposure. |
| “Maximum drawdown shows how often losses happen.” | It shows the deepest decline, not the frequency of losing periods. |
| “Maximum drawdown shows how long recovery takes.” | It shows depth, not time under water. A separate recovery-duration view is needed for that question. |
| “Maximum drawdown replaces position sizing.” | It can inform risk review, but it does not define trade size, risk per trade, or exposure rules by itself. |
Limitation: maximum drawdown can make one equity curve look riskier than another, but it cannot explain the full cause of that risk alone. The same drawdown percentage can come from one fast shock, many smaller losses, poor sizing, low liquidity, or a strategy that spends a long time below its prior high.
Recovery Burden and Risk Compounding
A drawdown requires a larger percentage gain to recover than the percentage that was lost. This happens because the recovery gain is calculated from the reduced base, not from the original peak.
| Drawdown from peak | Value after decline from 100 | Gain needed to return to 100 |
|---|---|---|
| 10% | 90 | 11.1% |
| 20% | 80 | 25.0% |
| 30% | 70 | 42.9% |
| 50% | 50 | 100.0% |
This recovery burden is one reason maximum drawdown matters in risk review. A 30% decline does not require a 30% gain to recover; it requires a 42.9% gain from the lower equity base. The deeper the decline, the more asymmetric the recovery burden becomes.
This does not mean every drawdown is unrecoverable. It means the size of the decline changes the work required to return to the prior peak.
Maximum Drawdown vs Nearby Risk Concepts
Maximum drawdown is often confused with broader risk ideas. The clean distinction is that maximum drawdown measures one historical depth point, while nearby concepts answer different questions.
| Concept | Main question it answers | How it differs from maximum drawdown |
|---|---|---|
| Drawdown | How far is the account below a prior peak? | A drawdown can describe any peak-to-current or peak-to-trough decline. Maximum drawdown is the worst such decline in the measured record. |
| Volatility | How much does value fluctuate? | Volatility measures variability. Maximum drawdown measures the deepest decline from a peak. |
| Risk of ruin | What is the chance of terminal account failure under a risk model? | Maximum drawdown shows historical decline depth. Risk of ruin explained deals with survival probability and terminal impairment assumptions. |
| Risk-reward ratio | How does potential reward compare with defined risk on a trade idea? | Maximum drawdown reviews an equity-curve path. Risk reward ratio compares planned risk and potential reward before or during trade evaluation. |
| Position sizing | How much exposure should be taken under a defined risk plan? | Maximum drawdown can inform review, but it does not calculate position size by itself. |
The practical mistake is treating maximum drawdown as a complete risk system. It is better read as one diagnostic measurement: it tells the trader how deep the worst observed account decline became, while other risk tools address probability, sizing, reward structure, frequency, and recovery time.
How to Read Maximum Drawdown Without Overstating It
A maximum drawdown figure is most useful when it is read with its measurement context. The same percentage can mean different things depending on the account path, sample length, strategy style, and recovery behavior.
- Check the peak and trough: identify the exact high and the lowest point that followed before recovery.
- Check the measurement window: a short record may understate risk because it has not passed through many market conditions.
- Check the recovery path: a fast return to the prior peak is different from a long period below the old high.
- Check the final return separately: a profitable endpoint does not remove the drawdown that occurred along the way.
- Check what the metric excludes: maximum drawdown does not show loss frequency, trade quality, liquidity, or future risk by itself.
Practical reading: maximum drawdown is strongest as a context metric. It separates “what did the account finish at?” from “how much decline did the account absorb on the way?”
FAQ
Is maximum drawdown the same as drawdown?
No. Drawdown can refer to any decline from a peak. Maximum drawdown is the largest peak-to-trough decline in the measured record.
Does maximum drawdown predict future losses?
No. Maximum drawdown describes the worst decline that already occurred in the measured history. It does not guarantee that future losses will stay below that level.
Is a lower maximum drawdown always better?
Not automatically. Lower drawdown can reduce stress, but it still needs to be interpreted with return path, sample size, strategy type, exposure, and recovery behavior.
How is maximum drawdown different from risk of ruin?
Maximum drawdown measures the deepest historical decline in the record being reviewed. Risk of ruin deals with the chance of terminal account failure under a risk model.