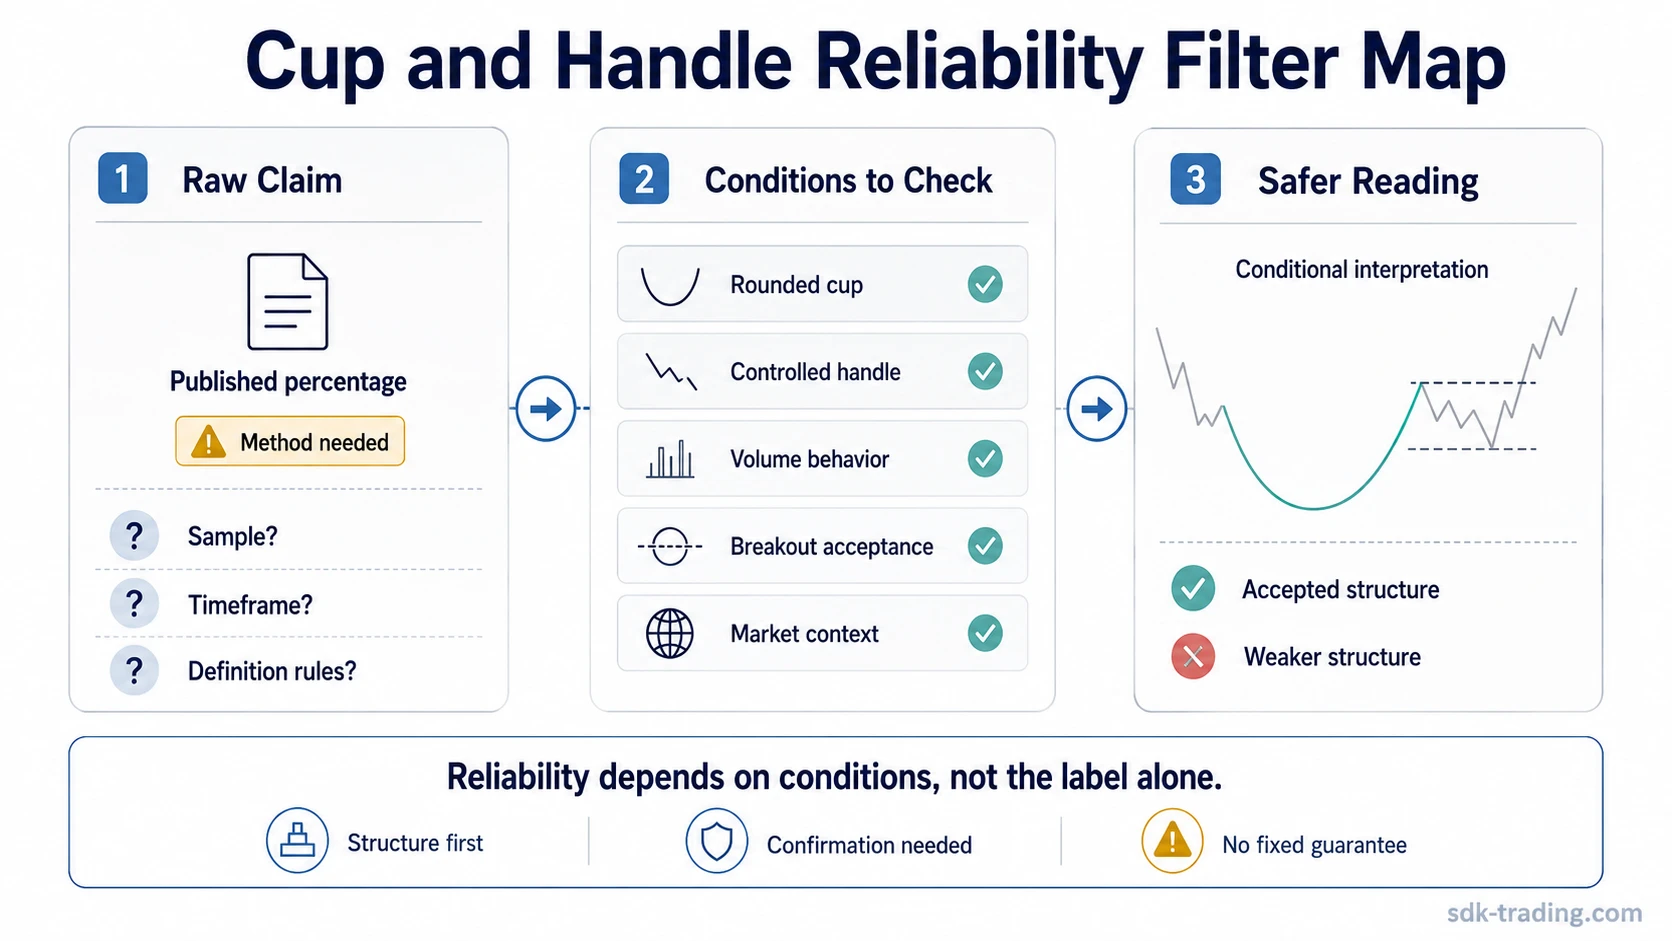
Cup and handle pattern success rate is not a fixed number. A reliability claim changes with structure quality, handle depth, volume behavior, breakout acceptance, and the broader market context around the pattern.
The common mistake is treating a published percentage as if it applies to every rounded base on a chart. A cleaner reading starts with the actual cup and handle pattern, then checks whether the structure is complete enough to evaluate.
A success-rate claim is more useful after the pattern has formed and price has shown acceptance around the breakout area, not while the chart is still only a rounded shape.
Key Points
- Cup and handle success rate is conditional, not a universal property of the pattern.
- Structure quality, handle depth, volume behavior, breakout acceptance, and market context change the interpretation.
- Raw percentages are weaker without knowing the source, timeframe, sample, and identification rules behind them.
- A deep handle, weak volume, or failed breakout can reduce the value of a success-rate claim.
- The standard cup and handle and the inverted cup and handle should not be treated as the same structure.
Why Cup and Handle Success Rate Claims Can Mislead
A single success-rate figure can look precise, but pattern studies often depend on different definitions. One source may require a rounded cup, controlled handle, and breakout acceptance. Another may count looser formations where the base is sharp, the handle is too deep, or the breakout fails quickly.
Failure-rate and success-rate figures also change when a study uses different confirmation rules, such as whether the pattern must hold above resistance, how deep the handle can be, and how failed breakouts are counted.
Timeframe and market environment also matter. A pattern formed during a strong trend, with improving volume and cleaner acceptance, is not the same as a similar shape formed during choppy conditions or broad market weakness.
Limitation: A success-rate statistic can describe a sample, not a guarantee. Without the study method, market context, and pattern-identification rules, the number is only a rough reference.
What Changes the Reliability of a Cup and Handle Pattern
The label is less important than the structure behind it. The same term can describe a clean accumulation-like formation or a loose rounded shape with little confirmation.
| Condition to Check | Why It Affects Reliability | Limitation |
|---|---|---|
| Rounded cup | A smoother base suggests a more developed structure than a sharp V-shaped rebound. | A rounded shape alone does not confirm acceptance. |
| Controlled handle depth | A shallow or moderate handle can show consolidation rather than broad loss of structure. | A deep handle may damage the pattern quality. |
| Handle location | A handle near the upper part of the cup usually keeps the structure closer to the breakout area. | A handle that forms too low can resemble a failed recovery instead of a controlled pause. |
| Volume behavior | Lower activity during the handle and stronger participation near the breakout can support the interpretation. | Volume can support interpretation, but it does not guarantee follow-through. |
| Breakout acceptance | Holding above the tested area is more meaningful than a brief move through resistance. | A breakout that quickly returns below the level can turn the pattern into a false-breakout risk. |
| Market context | A constructive broader environment can make the pattern easier to interpret. | Weak or unstable context can reduce the usefulness of the pattern even when the shape looks clean. |
Misread vs Safer Interpretation
A safer reliability reading separates what the chart appears to show from what the market has actually accepted.
| Common Misread | Safer Interpretation |
|---|---|
| “The chart is rounded, so it is a cup and handle.” | A rounded base is only the starting shape. The handle, volume behavior, and acceptance still need to support the pattern. |
| “A study gives a success rate, so the pattern is reliable by default.” | The statistic depends on the sample and rules used to identify the pattern. |
| “Any breakout confirms the pattern.” | A brief move above resistance is weaker than accepted movement that holds the tested area. |
| “A deeper handle creates more upside potential.” | A deeper handle can weaken structure and make the pattern less clean. |
| “Volume confirms the pattern automatically.” | Volume is one condition to compare with price behavior. It does not remove the need for acceptance and context. |
When the Pattern Becomes Weaker
The interpretation weakens when the rounded shape is doing most of the work and the confirming behavior is missing. The risk is highest when the chart has a rounded look, but the handle is too deep, volume does not improve near the breakout, or price cannot hold above the tested area.
- Sharp V-shaped recovery: the base may be too abrupt to read as a developed cup structure.
- Deep handle: the handle can start to look like renewed distribution rather than controlled consolidation.
- Weak volume behavior: participation does not support the idea that demand is improving near the breakout area.
- Failed breakout: price briefly moves above resistance, then falls back below it without acceptance.
- Poor broader context: the pattern appears while market conditions are unstable or conflicting.
- Over-reliance on a statistic: the percentage becomes a shortcut that replaces structure and confirmation.
Common mistake: Counting every rounded base as a valid cup and handle can inflate confidence before the pattern has formed enough to evaluate.
Cup and Handle Pattern Example in Context
Price forms a rounded base below a prior resistance area, then recovers toward that level and begins to pause. The first reading is tempting because the outline resembles a cup and handle, but the reliability question is still unresolved.
The case becomes cleaner if the handle stays controlled, volume contracts during the pause, participation improves near the breakout, and price holds the tested area instead of immediately falling back below it. That behavior gives the statistic a cleaner context, while the outcome still remains uncertain.
The same visual shape deserves a weaker reading if the handle cuts deeply into the cup, volume remains weak near the breakout, or price briefly trades above resistance and then fails to hold. In that situation, a raw success-rate figure should be discounted because the structure does not match the cleaner version that the statistic may have assumed.
Reading filter: A cleaner interpretation needs a developed base, controlled handle, supportive volume, accepted breakout, and compatible context. The label alone is not enough.
How This Differs From an Inverted Cup and Handle
The standard cup and handle is usually evaluated as a bullish continuation or recovery structure, but the reliability discussion still depends on quality and context. The inverted cup and handle pattern is a separate inverse structure with its own interpretation, failure risks, and confirmation requirements.
The two patterns should not share one success-rate assumption. Their shape, directional context, and acceptance tests are different enough that reliability needs to be evaluated separately.
Using Success Rate Without Overstating It
A cup and handle success-rate claim can be useful as a background reference when the sample method is clear. It becomes less useful when the number is detached from pattern quality, timeframe, market regime, and breakout behavior.
The safer reading is conditional: a clean pattern can improve interpretation quality, while a weak structure can reduce the value of even a widely quoted statistic.
FAQ
What is the success rate of a cup and handle pattern?
The success rate is source-dependent and should not be treated as a fixed number. It depends on how the pattern is defined, the timeframe, the market context, volume behavior, and whether the breakout is accepted.
Is the cup and handle pattern reliable?
It can be more reliable when the cup is well formed, the handle is controlled, volume behavior supports the reading, and price holds the breakout area. It becomes weaker when the structure is loose or the breakout fails quickly.
Why do cup and handle success-rate statistics differ?
Statistics differ because studies may use different pattern definitions, markets, timeframes, sample sizes, and confirmation rules. A percentage without method context should be treated as a rough reference.
Can a cup and handle breakout fail?
Yes. A breakout can fail if price briefly moves above resistance but does not hold the area. Weak volume, a deep handle, or poor broader context can increase the risk of a weaker reading.
Does volume confirm a cup and handle pattern?
Volume can support the interpretation when it aligns with structure and acceptance, but it does not confirm the pattern by itself. Price behavior around the breakout area still matters.