A diamond bottom chart pattern is a possible reversal structure that usually appears after a decline, when price first makes wider swings and then compresses into narrower swings. A diamond outline alone is not enough; what price does after testing the upper boundary determines whether the structure carries weight or remains unresolved.
Definition: A diamond bottom is a chart pattern built from expansion followed by contraction near a lower price area. The left side shows widening volatility, the right side shows narrowing volatility, and the later test of the upper boundary helps separate a defensible structure from a messy range.
The bottoming implication stays conditional. A diamond bottom becomes more useful when the prior decline, expanding swings, contracting swings, and later boundary test all appear in sequence.
Key Points
- A diamond bottom usually develops after a decline or lower-base trading area.
- The pattern starts with widening swings and then shifts into narrowing swings.
- The upper and lower boundaries frame acceptance, failure, and unresolved behavior.
- False readings often come from simple triangles, loose ranges, or brief boundary breaks that do not hold.
What Is a Diamond Bottom Chart Pattern?
A diamond bottom chart pattern is a technical-analysis formation where price action broadens first and contracts later, creating a rough diamond shape near the end of a decline. The first half reflects unstable two-sided movement. The second half reflects compression as the swings narrow toward a decision area.
The required evidence is sequential: lower context, expansion, contraction, and a later boundary test. When one part is missing, the outline becomes a forced drawing rather than a useful chart classification.
Volume may support the interpretation when activity expands during the unstable phase and becomes more selective during contraction, but volume is not proof by itself. Price structure and later acceptance remain more important than a single volume clue.
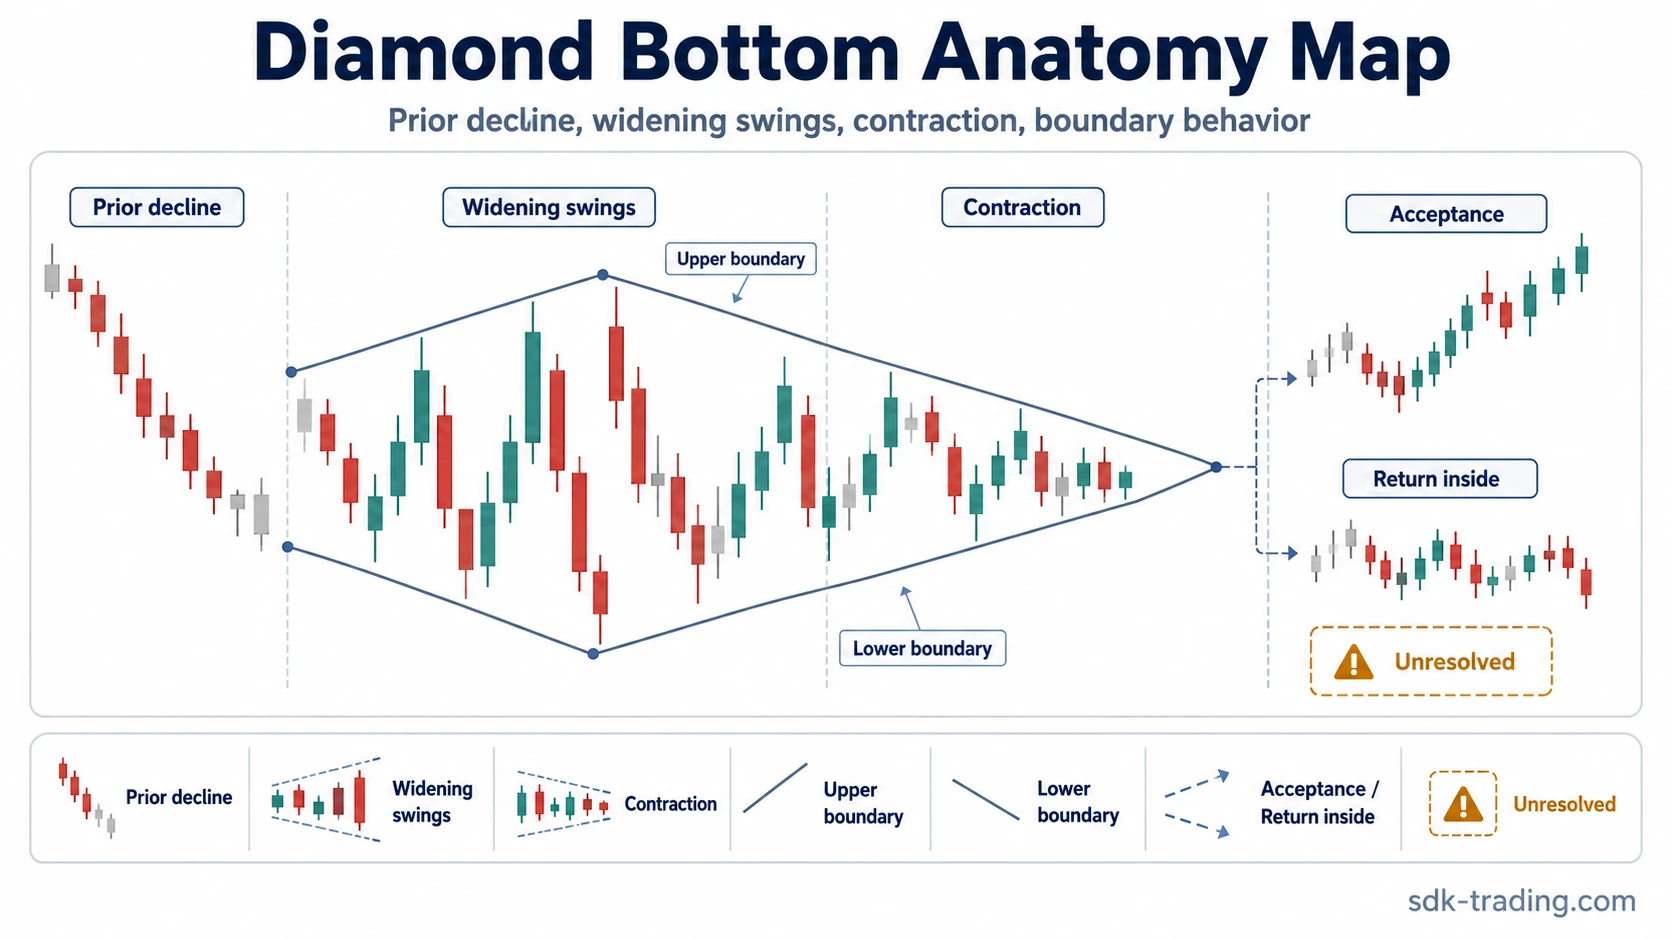
How a Diamond Bottom Forms
A diamond bottom normally forms in two stages. First, price becomes unstable after a decline and begins making wider highs and lows. Then the range starts to narrow as each new swing covers less distance. The result is not a clean geometric diamond in most real charts; it is usually uneven, lopsided, and easier to read after several swings have developed.
| Stage | What appears on the chart | Why it matters |
|---|---|---|
| Prior decline | Price approaches a lower area after sustained selling or weak trend behavior. | Without lower-base context, the same shape may not represent a bottoming structure. |
| Expansion phase | Swings widen, with higher reactions and lower reactions creating a broadening left side. | This separates a diamond bottom from a normal contraction pattern. |
| Contraction phase | Swings narrow and begin compressing toward the right side of the structure. | Compression shows that the earlier instability is narrowing into a boundary test. |
| Upper boundary test | Price challenges the upper side of the contracting structure. | Acceptance above that boundary gives the structure more weight; failure back inside keeps it unresolved. |
| Lower boundary failure | Price loses the lower side or repeatedly fails to hold recovery attempts. | The bottoming label becomes harder to defend when the market cannot maintain the structure. |
The key sequence is expansion, contraction, then boundary behavior. A chart can have four angled lines and still fail the reading if the earlier expansion is missing or the later boundary test does not hold.
How to Identify a Diamond Bottom
Identification starts with the behavior of the swings, not with drawing lines first. The lines should describe the structure that already exists; they should not force a diamond shape onto random volatility.
- Check the background: the pattern should usually appear after a decline, not in the middle of an unrelated sideways range.
- Find the expansion: the left side should show widening swings, not only a narrowing triangle.
- Find the contraction: the right side should show smaller swings that compress toward the boundary area.
- Compare the boundaries: the upper and lower lines should frame real swing behavior, not isolated one-candle extremes.
- Watch the follow-through: a stronger structure needs acceptance above the upper boundary, while a move back inside makes the label weaker.
Contraction alone is not enough. If the left side never widened before the range narrowed, the structure is more likely a triangle or a noisy base than a diamond bottom.
Diagnostic note: A diamond bottom is easier to misread than many chart patterns because the shape is rare and subjective. Treat the outline as a hypothesis until expansion, contraction, and boundary testing support the same interpretation.
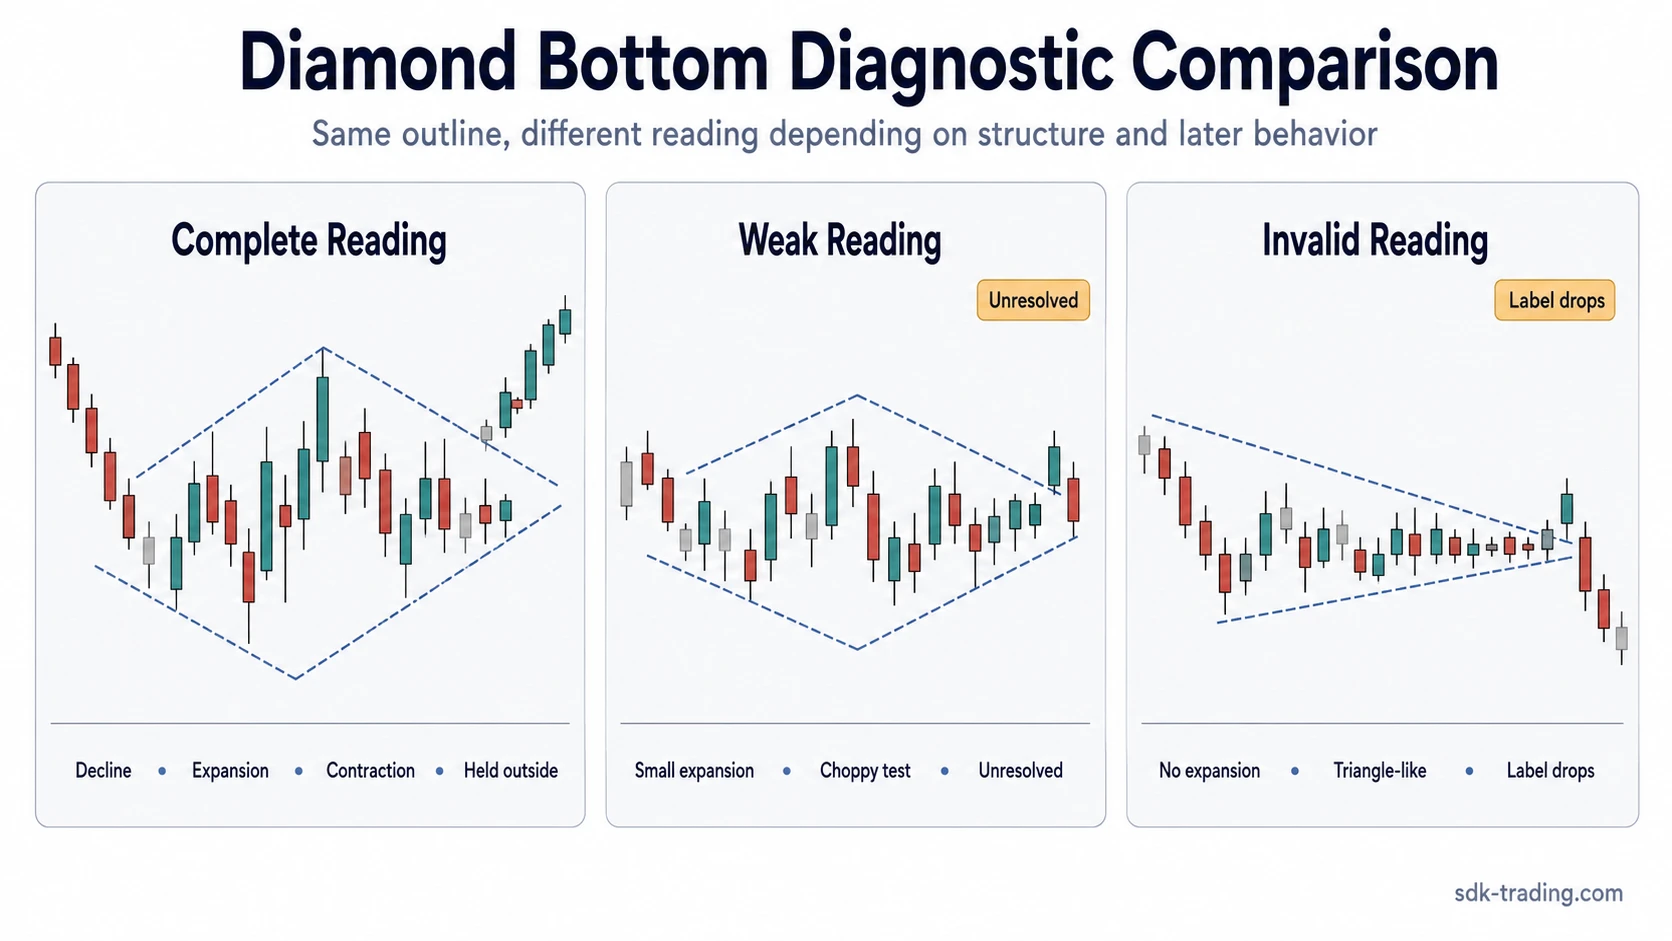
Clean, Weak, and Invalid Diamond Bottom Readings
A diamond bottom is easier to classify when the structure is separated into clean, weak, and invalid readings. The same outline can mean different things depending on whether the prior decline, expansion, contraction, and boundary test are all present.
| Reading type | Structure present | Boundary behavior | Diagnostic interpretation |
|---|---|---|---|
| Clean reading | Prior decline, widening swings, narrowing swings, and readable upper/lower boundaries. | Price accepts above the upper boundary instead of immediately falling back inside. | The diamond-bottom interpretation is more defensible, though still conditional on later behavior. |
| Weak reading | Some diamond-like shape appears, but the expansion phase is small, uneven, or hard to separate from noise. | The boundary test is choppy, hesitant, or quickly returns into the structure. | The pattern remains possible but not strong enough to treat as a clean structural reading. |
| Invalid reading | No clear prior decline, no real expansion phase, or only a simple narrowing triangle. | Price loses the lower boundary or fails to hold above the upper boundary after a brief break. | The diamond-bottom label should be dropped or treated as unresolved rather than confirmed. |
This distinction prevents the label from being applied to every volatile base. A clean reading needs sequence, while a weak or invalid reading usually has only an outline.
Diamond Bottom vs Diamond Top
A diamond bottom and a diamond top use similar expansion-and-contraction geometry, but they appear in opposite market locations. A diamond bottom is normally studied after a decline or lower-base condition, while a diamond top is normally studied after an advance or upper distribution area.
| Pattern | Typical location | Main structural question |
|---|---|---|
| Diamond bottom | After a decline or lower-base area. | Does price accept above the upper boundary after expansion turns into contraction? |
| Diamond top | After an advance or upper-range area. | Does price fail from the structure after expansion turns into contraction? |
The comparison is location-sensitive. The same rough diamond outline can be misleading if the surrounding trend context is ignored.
Diamond Bottom vs Symmetrical Triangle
A symmetrical triangle contracts from the start. A diamond bottom needs an earlier expansion phase before the contraction phase begins. That difference matters because many false diamond-bottom readings come from drawing extra lines around a normal triangle.
The simplest test is to look at the left side. If the structure never widened before it narrowed, the pattern is probably not a diamond bottom. It may still be a valid contraction pattern, but the diamond-bottom interpretation is weaker because the broadening-to-compression sequence is missing.
Quick distinction: a diamond bottom is expansion then contraction; a symmetrical triangle is contraction without the earlier broadening phase.
Diamond Bottom and Wolfe-Style Structure
Diamond bottoms and Wolfe-style wave structure both depend on swing geometry, but they do not use the same model. A diamond bottom is diagnosed from volatility expansion, contraction, and boundary acceptance, while a Wolfe-style reading uses a different wave sequence and channel-style relationship.
Practical Diamond Bottom Scenario
Price declines into a lower area, then begins making rougher two-sided swings. The first reactions are wide and unstable. Later swings become smaller, and the structure compresses toward the right side. At that point, the diamond-bottom label is still only a working interpretation.
The structure carries more weight only after later candles spend time above the upper boundary instead of snapping straight back into the range. If price breaks the boundary briefly, stalls, and returns inside the diamond, the formation remains unresolved or failed. If the earlier widening phase was never clear, the cleaner label may be a triangle, range, or noisy base.
Limitation: Diamond bottoms are rare, subjective, and often uneven. They should not be treated as precise geometric objects or direct trading instructions. The safer reading focuses on whether structure, sequence, and later acceptance agree.
Common Mistakes When Reading a Diamond Bottom
The most common mistake is naming the pattern too early. A few wide candles followed by a small pullback do not create a diamond bottom unless the full expansion-to-contraction sequence is visible.
- Forcing the outline: drawing a diamond around random volatility instead of reading the swing sequence.
- Ignoring the prior decline: treating a middle-range formation as a bottoming pattern without lower-base context.
- Confusing contraction with completion: assuming narrowing swings are enough without later boundary testing.
- Overstating volume: treating volume as proof instead of a supporting clue.
- Reading a brief break as acceptance: calling the structure complete before price holds outside the boundary.
A better diagnostic sequence starts with what is observable: prior decline, widening swings, narrowing swings, boundary test, and later acceptance or failure.
FAQ
What is a diamond bottom chart pattern?
A diamond bottom chart pattern is a possible reversal structure that usually forms after a decline. It starts with widening swings, then contracts into narrower swings near a lower price area.
How do you identify a diamond bottom?
Look for a prior decline, a broadening left side, a contracting right side, readable upper and lower boundaries, and later behavior that accepts or fails around the upper boundary.
Is a diamond bottom the same as a symmetrical triangle?
No. A symmetrical triangle contracts from the start, while a diamond bottom needs an earlier expansion phase before the contraction phase begins.
Does a diamond bottom confirm a reversal?
No. A diamond bottom is a structural reading, not a guaranteed reversal. The interpretation weakens if price fails to hold outside the upper boundary or loses the lower boundary.