Heikin Ashi strategy is a conditional process for reading smoothed candle sequences against real price structure, not a fixed entry or exit system.
Heikin Ashi candles modify the displayed open, high, low, and close values to smooth the visible candle sequence. That smoothing can make trend behavior easier to read, but it also means the displayed candle is not the same as the raw tradable price candle.
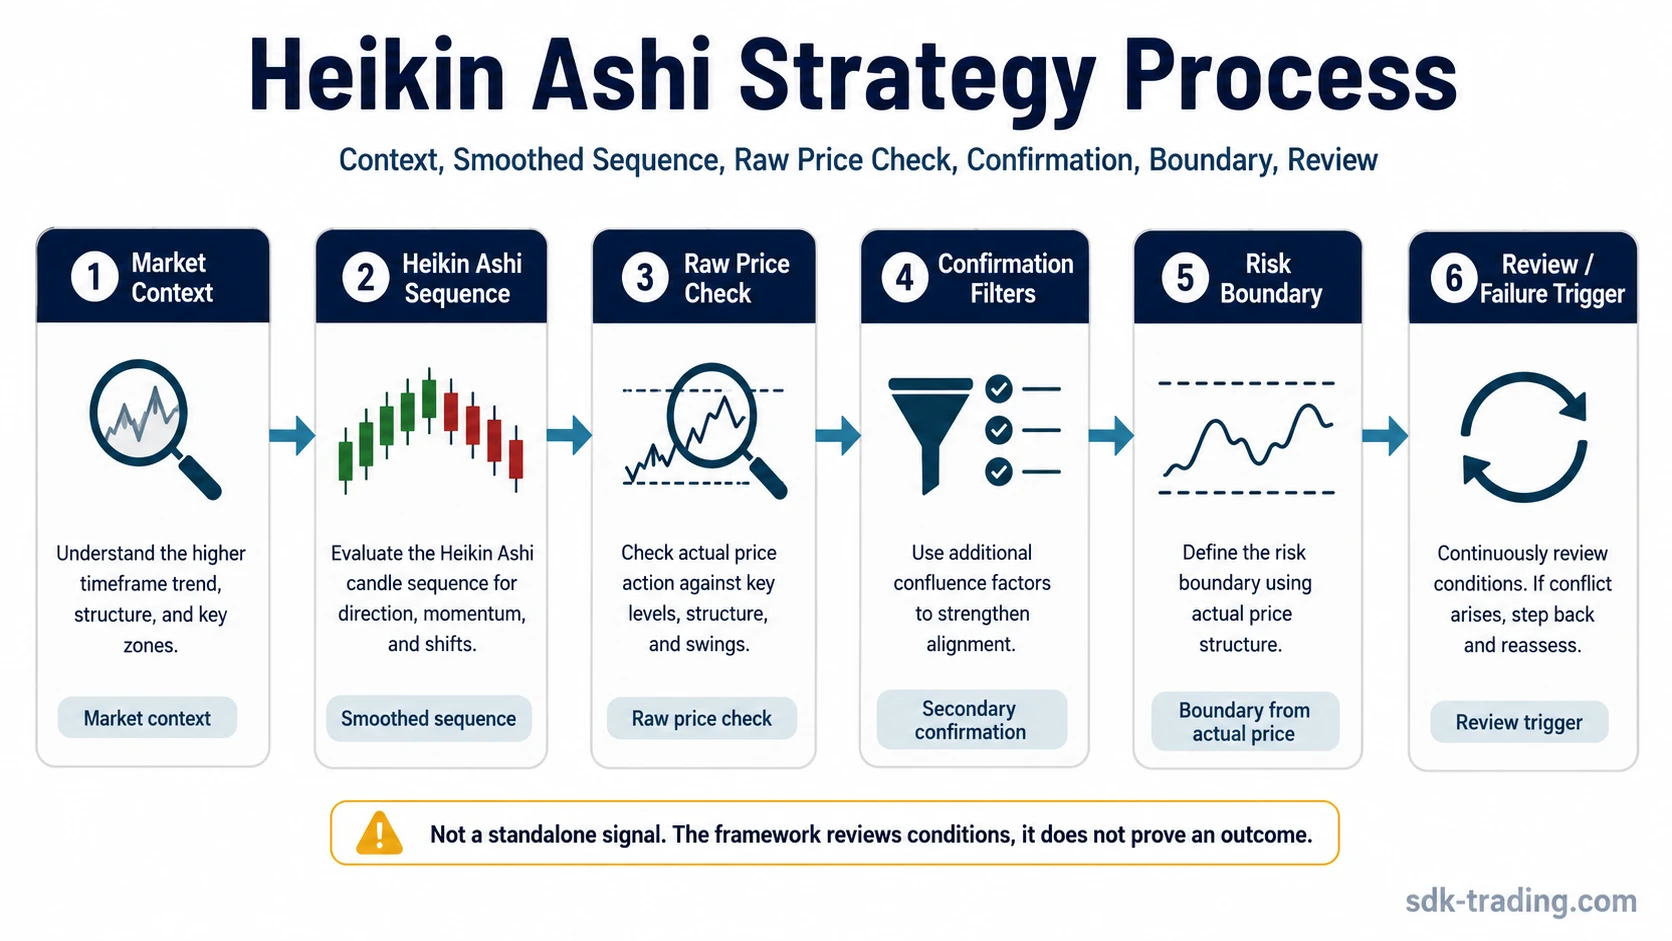
A more disciplined Heikin Ashi strategy starts with market context, then reads the smoothed candle sequence, checks it against raw price, applies confirmation filters only as secondary evidence, defines risk from real price structure, and treats conflicts as review or failure conditions.
Key Points
- A Heikin Ashi strategy is a framework for interpretation, not a mechanical trading system.
- The smoothed candle display can reduce visible noise, but it can also delay or hide raw price information.
- Exact levels, risk boundaries, and invalidation should come from raw price structure, not averaged Heikin Ashi values.
- Color shifts, small bodies, wicks, and Doji-like pauses are review triggers, not standalone signals.
- Confirmation tools such as moving averages, RSI, ATR, or volume can support context, but they do not prove an outcome.
What a Heikin Ashi Strategy Actually Uses
A Heikin Ashi strategy uses several components together. The smoothed candle sequence is only one part of the read. The surrounding structure, the raw price chart, and the failure condition matter because Heikin Ashi can keep a trend visually smooth after the raw market has already started to weaken.
| Component | Role in the framework | Boundary |
|---|---|---|
| Raw market context | Shows the broader trend, range, support area, resistance area, or volatility condition around the candles. | Context does not create a trade decision by itself. |
| Heikin Ashi sequence | Helps organize the visible candle flow into smoother sequences of color, body size, and wick behavior. | The sequence is calculated and can lag raw price changes. |
| Raw price cross-check | Confirms whether the real chart structure agrees with the smoothed display. | Raw price disagreement weakens the Heikin Ashi read. |
| Optional confirmation filter | Adds secondary context through tools such as moving averages, RSI, ATR, or volume. | More filters do not turn the method into certainty. |
| Risk boundary | Defines where the interpretation becomes unsafe or invalid from actual price behavior. | The boundary should not be based only on averaged Heikin Ashi values. |
| Review or failure trigger | Marks the point where the visual sequence needs to be questioned. | A trigger is a reason to review, not an automatic action. |
Heikin Ashi vs Raw Price in a Strategy Framework
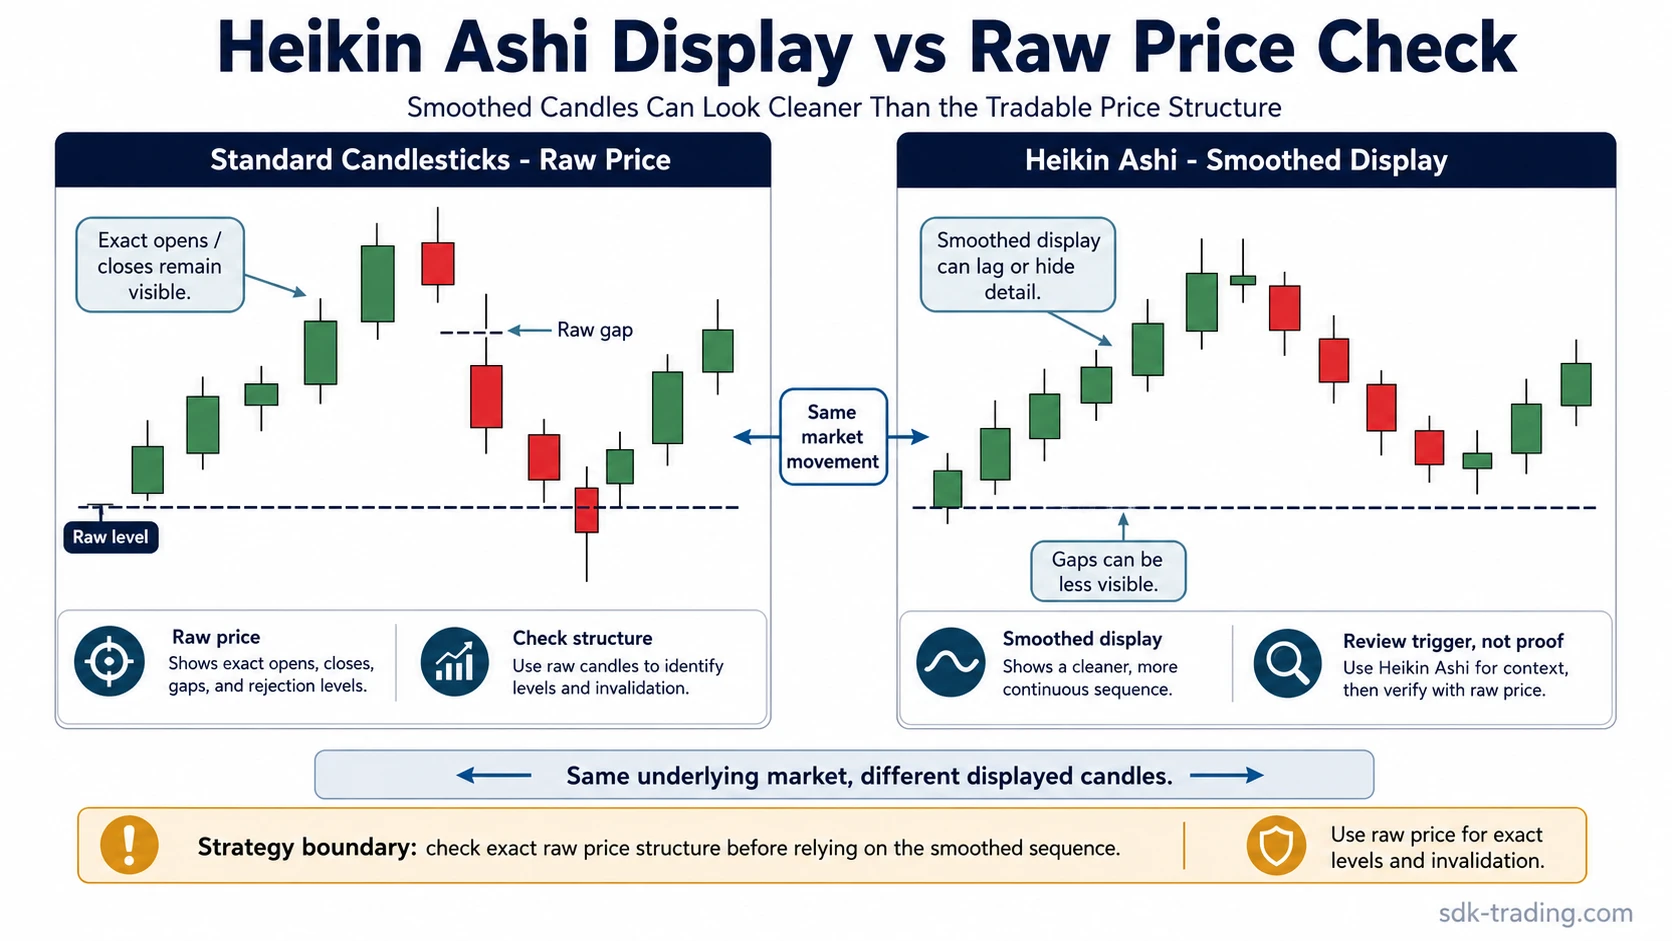
The central limitation is that Heikin Ashi candles are not standard candlesticks. A standard candle preserves the raw open, high, low, and close for that period. A Heikin Ashi candle displays modified values, so the chart can look smoother than the underlying price action.
Raw price boundary: exact gaps, raw opens, raw closes, and precise rejection levels can be less visible on a Heikin Ashi display. A strategy framework should therefore compare the smoothed chart with standard candlesticks before treating the sequence as meaningful.
This distinction matters most near levels where precision affects interpretation. If raw price fails to hold a prior support area while the Heikin Ashi sequence still looks orderly, the raw chart deserves more weight. The smoothed display can help organize the read, but it should not replace the real structure.
Heikin Ashi Strategy Process
The strategy process is strongest when the sequence is explicit. Instead of reading a green candle as bullish or a red candle as bearish in isolation, the framework asks what the candle is doing inside the current structure and whether raw price supports the same interpretation.
- Start with context: identify whether the market is trending, ranging, compressing, expanding, or reacting around a visible area.
- Read the Heikin Ashi sequence: observe color continuity, body expansion or contraction, wick behavior, and pauses.
- Check raw price: compare the smoothed display with standard candlesticks and visible structure.
- Add confirmation carefully: use moving average alignment, RSI behavior, ATR expansion, or volume only as secondary context.
- Define the boundary: decide what raw price behavior would weaken or invalidate the interpretation.
- Review conflicts: treat divergence between Heikin Ashi display and raw price as a reason to reassess the read.
How Candle Sequences Are Interpreted
Heikin Ashi candle sequences can show pressure more cleanly than standard candles, but the interpretation remains conditional. Consecutive candles of the same color can suggest directional continuity. Larger bodies can show cleaner participation in that direction. Smaller bodies can show reduced pressure or hesitation.
Wick behavior adds another layer. A strong one-sided sequence may show little opposite-side shadow, while two-sided wicks can suggest more conflict. A Heikin Ashi Doji or small-bodied pause can mark a review point when the prior sequence starts losing clarity.
These clues should not be treated as a pattern catalog. A candle sequence matters more when it agrees with structure, raw price behavior, and the surrounding volatility condition.
Confirmation Filters and Their Limits
Confirmation filters can make a Heikin Ashi strategy more disciplined, but they should not become a mechanical signal stack. A moving average can help identify whether the smoothed sequence agrees with broader direction. RSI can help show whether momentum is still expanding or fading. ATR can highlight whether volatility is changing. Volume can add participation context when volume data is meaningful for the market being reviewed.
Limit: confirmation is still evidence, not proof. If several indicators are added only to justify the same visual read, the process can become overfit. The cleaner question is whether each filter adds a different type of information.
Heikin Ashi can also be used around possible transition points, but a Heikin Ashi Reversal reading should remain a component of the framework rather than the whole decision. The raw price chart still decides whether the market has actually accepted a change in direction.
Failure Conditions and Common Mistakes
The most important failure condition appears when the smoothed display and the raw chart stop saying the same thing. A clean Heikin Ashi sequence can remain visually intact even while raw price starts making weaker closes, failing to hold a prior area, or reacting sharply against the displayed direction.
| Mistake | Why it creates risk | Safer interpretation |
|---|---|---|
| Using Heikin Ashi values for exact levels | The displayed values are modified and may not match raw tradable price. | Use raw price structure for exact levels and invalidation logic. |
| Treating color change as a signal | A color change can lag or appear during noise. | Treat it as a review trigger that needs raw price confirmation. |
| Ignoring gaps and raw opens | Smoothing can make gaps and exact opens less visible. | Check standard candlesticks before interpreting the sequence. |
| Using it for very precise timing | Smoothing can delay recognition of fast changes. | Use it for process clarity, not scalp-level precision. |
| Adding too many filters | Indicators can repeat the same information and create false confidence. | Use filters only when each one answers a different question. |
Heikin Ashi Strategy Example in Context
A market has been advancing in a clear sequence, and the Heikin Ashi chart continues to print mostly same-color candles with only shallow opposite-side wicks. The read looks clean at first because the smoothed display still shows directional continuity.
The raw candlestick chart then starts to show weaker closes near a prior resistance area. The market briefly trades above that area but fails to hold it, and the next recovery attempt stalls below the same zone. The Heikin Ashi sequence has not fully turned, but the raw chart has already introduced conflict.
In that situation, the Heikin Ashi reading becomes incomplete. A stronger case would require raw price to regain acceptance and for confirmation filters to support continuation. A weaker case appears if the smoothed sequence remains visually calm while raw price keeps rejecting the area. The framework does not produce an instruction; it separates a smooth display from actual structure.
How Heikin Ashi Strategy Differs From Nearby Concepts
The full construction of Heikin Ashi belongs to the core charting method. The strategy framework only needs enough construction detail to explain why raw price checks matter.
Doji-like pauses, small bodies, and wick changes belong to sequence review, while reversal-specific interpretation should stay tied to the separate reversal concept. The same separation applies to chart-type comparisons: a Renko Chart changes chart construction in a different way, so it should not be treated as the same type of smoothing framework.
FAQ
Is Heikin Ashi a complete trading strategy?
No. Heikin Ashi can support a strategy framework by smoothing candle sequences, but it does not define a complete system by itself. Raw price structure, confirmation, risk boundaries, and failure conditions still matter.
Why should raw price be checked with Heikin Ashi?
Heikin Ashi candles use modified displayed values, so exact opens, closes, gaps, and price reactions may be less visible. Raw price checks help prevent the smoothed display from hiding important structure.
Can Heikin Ashi candles confirm reversals?
They can contribute to a reversal read, but they should not be treated as proof. A reversal interpretation is stronger only when the smoothed sequence, raw price structure, and broader context align.