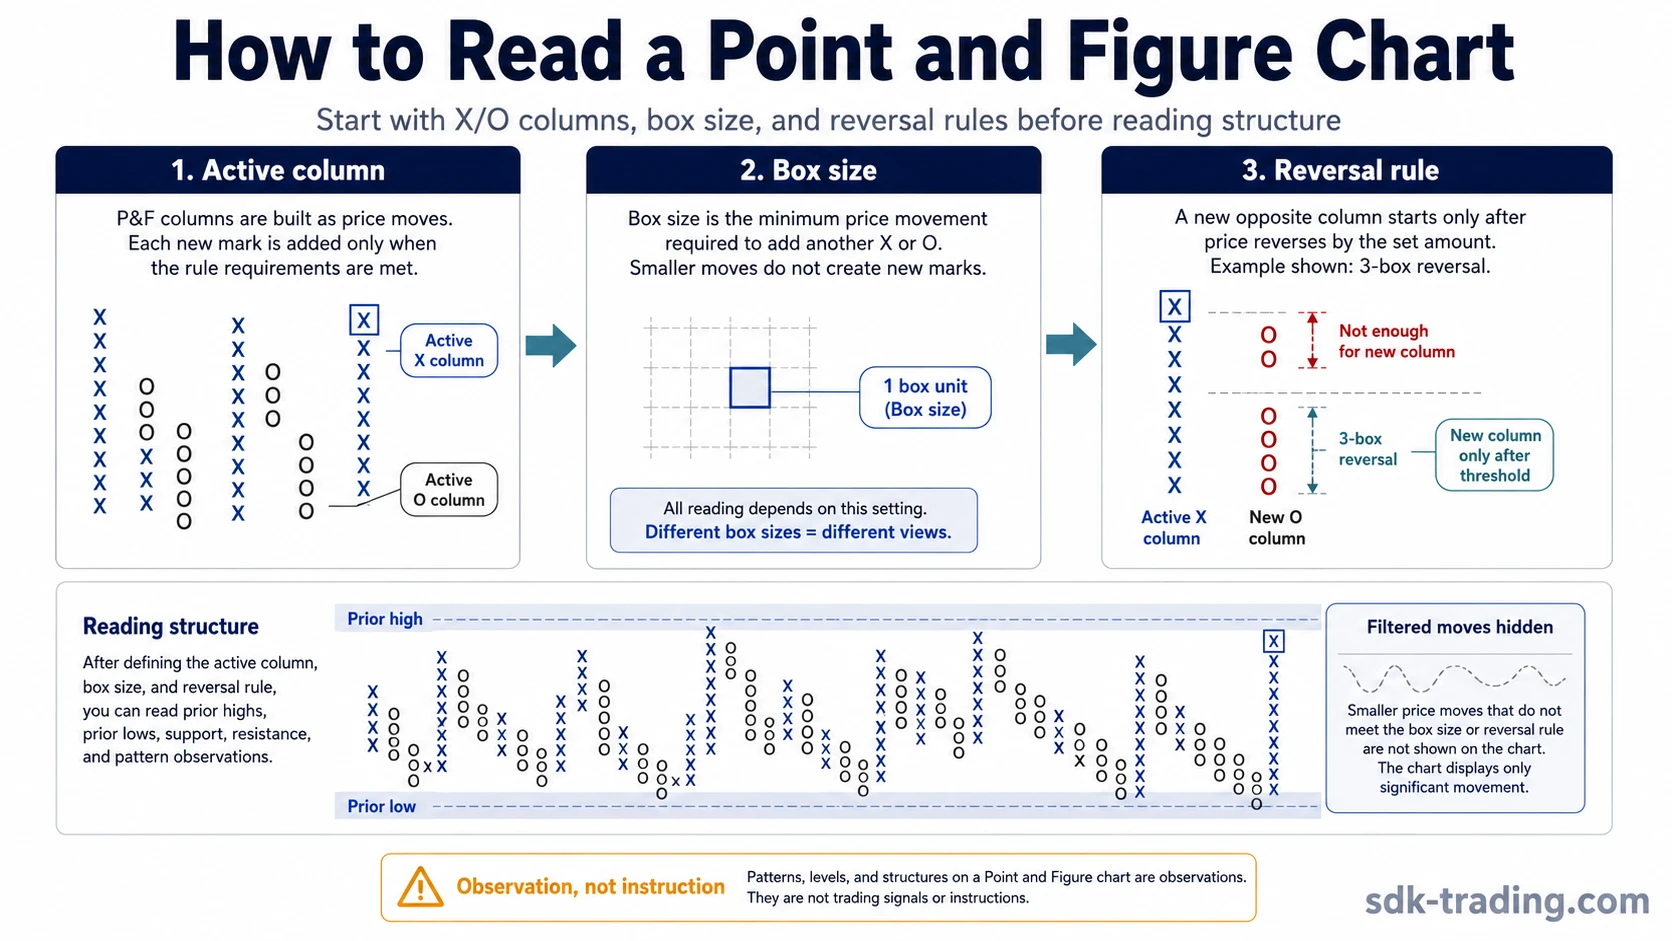
A Point and Figure chart is read by checking the active X or O column, the box size, and the reversal amount before interpreting any pattern. The chart does not print a new unit after each fixed time interval. It prints only when price movement satisfies the chart’s construction rules.
The first mistake is reading the visible column pattern before checking the settings that created it. An X column records upward price movement by box units. An O column records downward price movement by box units. A new opposite column appears only after price moves far enough to meet the selected reversal rule.
Definition: Reading a Point and Figure chart means interpreting filtered price movement through columns of Xs and Os, using the selected box size and reversal amount as the rules that decide what appears and what stays hidden.
The core Point and Figure chart concept includes the chart type’s construction rules, column behavior, and chart-scale choices. Reading starts by identifying the column, verifying the settings, and then judging whether the visible structure is only a filtered observation or a meaningful test of prior structure.
Key Points
- X columns show upward price movement by box units.
- O columns show downward price movement by box units.
- Box size controls how much price movement is required to add another X or O.
- Reversal amount controls when a new opposite column can begin.
- Pattern labels are observations, not trade instructions.
- Two P&F charts can look different when box size or reversal settings differ.
Start With the Active Column
The active column tells which direction has most recently met the chart’s price-movement rule. A rising X column means price has advanced enough to print one or more Xs. A falling O column means price has declined enough to print one or more Os.
The column does not show every traded price, every intraday turn, or every candle in the raw sequence. It shows only the moves that pass the selected filter. That makes the structure cleaner, but it also means the missing movement matters.
Reading note: The active column answers a construction question first. It shows which filtered movement is currently being recorded. It does not prove that the next movement will continue in the same direction.
Check Box Size Before Reading the Pattern
Box size is the price interval required to add another mark in the current column. If the box size is 1 point, each additional X or O requires another 1-point move in the column’s direction. If the box size is 5 points, smaller moves are ignored until the threshold is reached.
Pattern interpretation changes when box size changes. A small box may show more detail and more frequent structure. A larger box may remove noise but can also hide smaller tests, pauses, and failed attempts. The same market can therefore look more active or more compressed depending on the setting.
| Setting check | What it controls | Reading risk if ignored |
|---|---|---|
| Box size | The price movement needed to add another X or O. | A pattern may look stronger or weaker only because the filter is larger or smaller. |
| Reversal amount | The opposite movement needed to start a new column. | A normal pullback can be mistaken for a confirmed column change. |
| Chart scale | How price increments are converted into boxes. | Different scaling choices can alter the visible structure. |
Check the Reversal Amount Before Calling a New Column
The reversal amount decides how far price must move against the active column before a new opposite column can begin. In a 3-box reversal chart, price must reverse by three boxes before the chart starts the next column. A smaller opposite move may matter on a time-based chart, but it does not create a new P&F column unless the rule is met.
This rule prevents many premature readings. A dip during an X column is not automatically an O column. A bounce during an O column is not automatically an X column. The opposite move must be large enough under the selected reversal setting.
- Identify whether the active column is X or O.
- Check the box size used to print each mark.
- Check the reversal amount needed for a new column.
- Compare the active column with prior column highs and lows.
- Only then interpret support, resistance, or pattern observations.
Read Prior Highs, Lows, Support, and Resistance as Structure
Point and Figure charts often make prior column highs and lows easier to compare because the time axis is compressed. Repeated highs may identify a resistance area. Repeated lows may identify a support area. A move beyond a prior column high or low is best treated as a structure test.
The observation still needs restraint. A move through a prior high does not prove continuation. A move through a prior low does not prove a completed reversal. The structure becomes more useful when it is compared with box size, reversal amount, nearby columns, and whether the tested area is accepted or rejected by later columns.
Boundary: Support and resistance on a P&F chart are filtered structure areas. They help organize the chart, but they do not guarantee reaction, direction, or outcome.
Separate Pattern Observations From Trade Instructions
Common P&F labels such as double top, double bottom, breakout, and breakdown describe visible structure. They are not complete decisions by themselves. The same label can carry different meaning when the box size, reversal amount, prior structure, and later column behavior differ.
A double-top observation, for example, usually begins with price reaching or exceeding a prior column high. That can show pressure against a prior resistance area, but the reading remains conditional. If the move fails to hold the tested area or quickly reverses under the chart’s rule, the label alone was not enough.
Misread vs Safer Interpretation
P&F mistakes often come from treating the filtered chart as if it were a full raw price sequence. The safer reading starts with the construction rule, then moves to structure.
| Common misread | Safer interpretation |
|---|---|
| Price moved down, so a new O column must start. | A new O column starts only if the selected reversal rule is met. |
| An X column proves the advance will continue. | An X column records filtered upward movement; later structure decides whether the move is accepted or rejected. |
| A double-top observation automatically proves upside continuation. | A double top marks a test of prior structure; the setting, location, and follow-through still matter. |
| A support or resistance line guarantees a reaction. | It marks a prior structure area; acceptance, rejection, and later columns still shape the reading. |
| Every P&F chart of the same market should look identical. | Different box sizes, reversal amounts, or scaling choices can produce different structures. |
Simple Point and Figure Reading Example
Example: Price is plotted with a box size of 1 and a 3-box reversal amount. An active X column has moved from 50 to 55. If price slips from 55 to 53, the move is against the X column, but it has not reached the 3-box reversal threshold. The X column stops extending, yet a new O column does not begin unless price moves far enough to satisfy the reversal rule.
If price later reaches the required reversal threshold, the chart can start a new O column. That new column changes the visible structure, but it still does not describe every smaller move that happened between the last X and the new O. The chart remains a filtered structure map, not a complete time-and-price record.
What Point and Figure Hides
P&F charts can make structure easier to see by removing time intervals and smaller price movement. That benefit creates limits. A chart may hide how long a move took, how many smaller reactions occurred, and whether the raw price path was smooth or choppy.
| Hidden or compressed detail | Why it matters when reading |
|---|---|
| Elapsed time | A fast move and a slow move can appear similar if both meet the same price rule. |
| Small counter-moves | Moves below the box or reversal threshold may not appear even if they affected raw price behavior. |
| Exact OHLC sequence | The chart does not preserve each open, high, low, and close in candle order. |
| Setting sensitivity | A different box size or reversal amount can change the apparent support, resistance, or pattern structure. |
| Delayed visibility | A new column may appear only after price has already moved enough to satisfy the reversal rule. |
Limitation: P&F can clarify filtered structure, but it can also hide the path that created that structure. A cleaner chart is not automatically a more complete chart.
Point and Figure vs Nearby Non-Time-Based Charts
Point and Figure uses X and O columns controlled by box size and reversal rules. A Kagi chart uses a different line-based construction method, so the reading process is not interchangeable even though both reduce the role of fixed clock intervals.
FAQ
What do X and O mean on a Point and Figure chart?
X marks upward price movement by the selected box size. O marks downward price movement by the selected box size. They are filtered price units, not fixed-time candles.
Why does a Point and Figure chart ignore some price moves?
Moves that do not meet the selected box size or reversal amount are not printed as new chart units. The filter is part of the chart’s design, but it also means smaller movement can be hidden.
Why can two Point and Figure charts look different?
Two charts can differ because box size, reversal amount, scaling, and data settings can change which movements are printed and which movements are filtered out.
Does a Point and Figure breakout prove direction?
No. A breakout is a structure observation. Its interpretation depends on the chart settings, prior structure, location, and whether later movement accepts or rejects the tested area.