Point and figure chart patterns are named X/O column structures, not automatic directional proof. A pattern such as a double-top breakout or triple-bottom breakdown first shows that price crossed a selected construction threshold on a point and figure chart.
The useful question is not only what the pattern is called. The reader also has to check the box size, reversal amount, active X or O column, and the prior-column level that was crossed. Without those construction details, a pattern name can sound more certain than the chart actually is.
Key Points
- P&F patterns form from X columns, O columns, box size, and reversal rules.
- A pattern trigger appears only when the selected threshold is crossed.
- The same price movement can look different when the box size or reversal amount changes.
- Failed breaks and trap readings matter because later columns can reject the initial trigger.
What Point and Figure Chart Patterns Actually Show
Point and figure chart patterns show column structure. X columns mark rising movement, O columns mark falling movement, and a new mark appears only when price movement satisfies the selected box rule.
A reversal into a new column also depends on the chosen reversal amount. That means a P&F pattern is not created by time passing. It is created when price movement is large enough, relative to the chart settings, to print the next box or reverse into a new column.
Core idea: a P&F pattern name describes how X/O columns crossed a visible threshold. It does not, by itself, settle continuation, reversal, or trade quality.
The full construction method is covered in the main point and figure chart explanation.
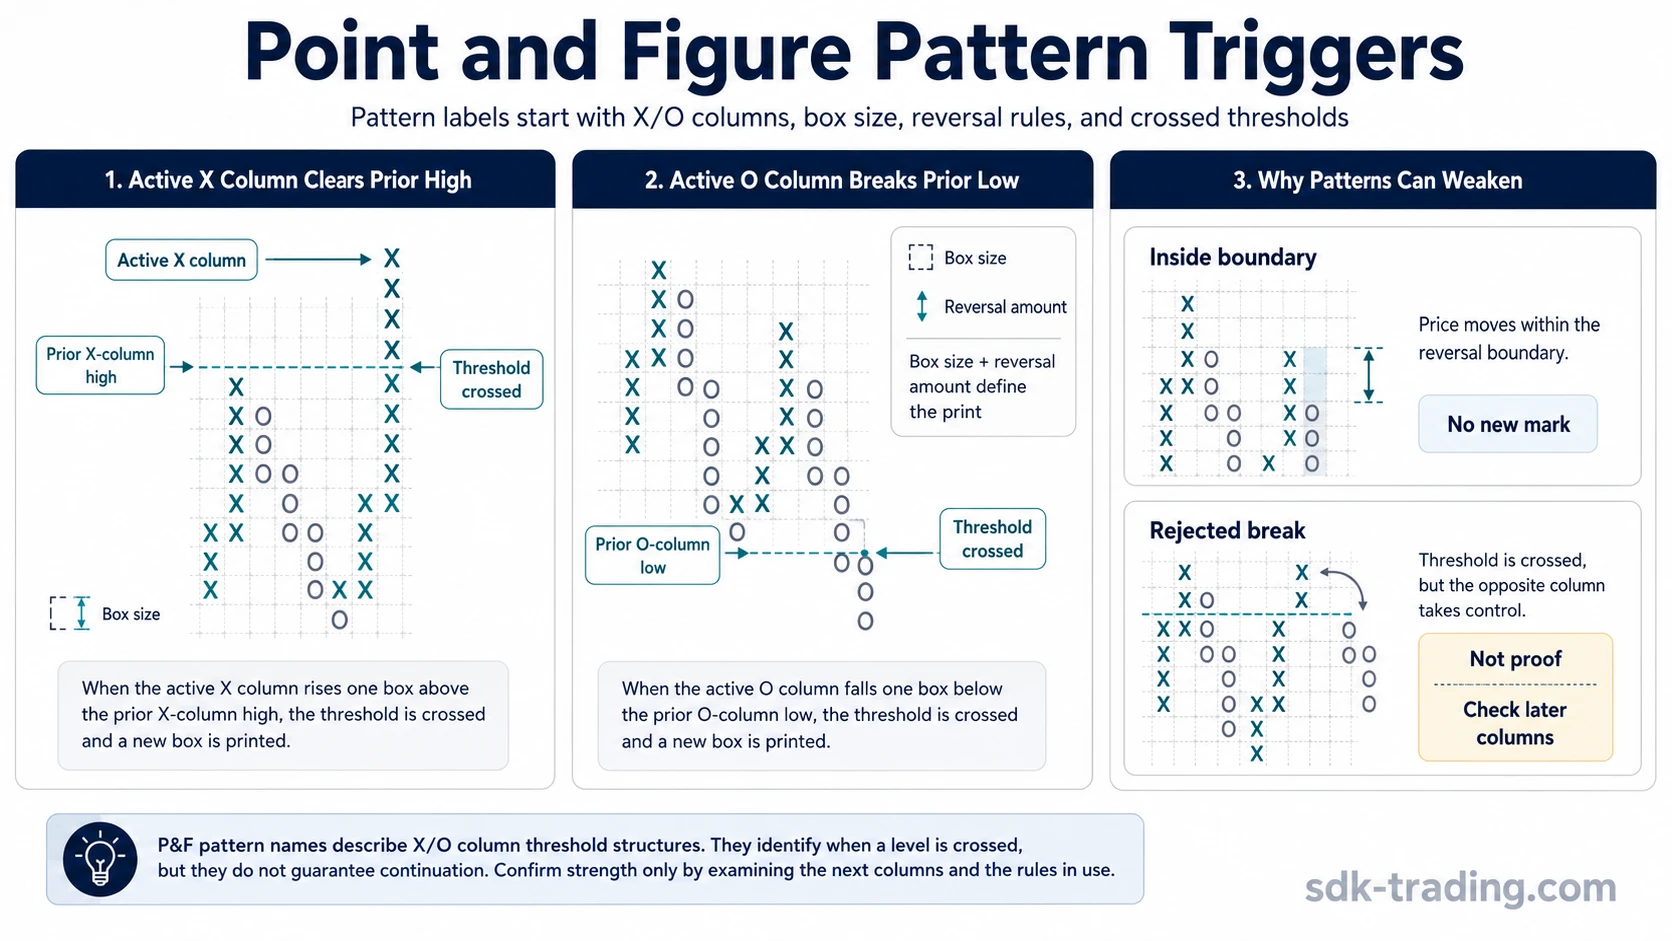
How X/O Columns Create Pattern Triggers
A pattern trigger starts with the active column. If the active column is an X column, the relevant question is whether it exceeds a prior X-column high by the required amount. If the active column is an O column, the relevant question is whether it breaks below a prior O-column low by the required amount.
Movement that stays inside the required boundary may matter on another chart, but it may not create a new P&F pattern. The construction filters smaller movement out when it does not satisfy the selected box or reversal rule.
| Condition | What it means for the pattern | Main limitation |
|---|---|---|
| Active X column rises above a prior X-column high | A breakout-style P&F pattern may be classified | The label depends on box size and the exact prior threshold |
| Active O column falls below a prior O-column low | A breakdown-style P&F pattern may be classified | The label describes the threshold break, not the later outcome |
| Price moves but does not satisfy the box or reversal rule | No new mark or column may appear | The chart may hide movement that is visible on time-based charts |
| A break is followed by rejecting column behavior | The original pattern reading weakens | The initial reading should be checked against later column behavior |
Common Point and Figure Chart Pattern Types
Most common P&F pattern names describe how current columns interact with previous column highs, previous column lows, or compressed column structure. The pattern names are most useful when they stay tied to construction and misread risk rather than trading instructions.
| Pattern name | Construction trigger | What to check | Main misread |
|---|---|---|---|
| Double-top breakout | An X column rises above the prior X-column high | Whether the break clears the required box threshold | Assuming the word “breakout” settles later direction |
| Double-bottom breakdown | An O column falls below the prior O-column low | Whether the break satisfies the selected box size | Reading the name as a complete downside conclusion |
| Triple-top breakout | An X column clears a level tested by multiple prior X columns | Whether the repeated level is defined by the same settings | Ignoring later rejection after the threshold break |
| Triple-bottom breakdown | An O column breaks below a level tested by multiple prior O columns | Whether the prior lows are structurally comparable | Treating the pattern name as stronger than the chart evidence |
| Catapult pattern | A breakout or breakdown attempt is followed by a reset and another threshold attempt | Whether the second attempt actually clears the relevant level | Calling every retest a catapult without checking column sequence |
| Congestion | Several alternating X and O columns form inside a limited range | Where the outer column thresholds sit | Assuming compression alone decides the next expansion |
| Bull trap or bear trap | A threshold break is later rejected by opposite column behavior | Whether the later structure invalidates the first reading | Stopping the analysis at the first pattern label |
| Triangle | Column highs and lows contract into a narrowing structure | Whether the contraction is clear under the chosen settings | Forcing a familiar time-based pattern onto P&F columns |
Why Box Size and Reversal Settings Can Change the Pattern
Box size determines how much price movement is needed to print another X or O. A smaller box size can reveal more column detail, while a larger box size can filter out movement that would otherwise appear as structure.
The reversal amount controls how much opposite movement is needed before a new column forms. A smaller reversal setting can create more frequent column changes. A larger reversal setting can delay or prevent a new column, which may also change whether a pattern appears at all.
Settings sensitivity: pattern classification is not independent from chart construction. Box size, reversal amount, scaling method, and price method can all change the visible X/O structure.
A simple settings example is an X column that clears a prior X-column high on one box size but remains inside the boundary on a larger box size. The price movement did not become more or less important by name alone; the visible P&F pattern changed because the construction filter changed.
The Common Mistake: Treating the Pattern Name as Proof
The main mistake is reading a named P&F pattern as if the label itself has already solved direction. A double-top breakout describes an X-column threshold break. A double-bottom breakdown describes an O-column threshold break. Each label begins the interpretation; it does not finish it.
Limitation: a pattern name is not enough. The reading changes if the threshold break fails, if the next column rejects the move, or if a different box size would not have produced the same visible pattern.
Trap readings are especially important here. A break that initially looks clean can lose meaning if later column behavior moves back through the relevant structure. In that case, the failed pattern reading may be more useful than the original label.
A Safer Sequence for Reading P&F Patterns
A safer reading sequence starts with construction before interpretation. This keeps the analysis tied to what the chart actually printed.
- Identify whether the active column is an X column or an O column.
- Check the box size used to print each mark.
- Check the reversal amount required to create a new column.
- Locate the prior X-column high or O-column low that defines the threshold.
- Decide whether the threshold was actually crossed under the selected settings.
- Classify the pattern only after the column structure is clear.
- Watch whether later columns accept or reject the break.
- Avoid letting the pattern name outrank the construction evidence.
Illustrative example: an X column rises one box above a prior X-column high. That can create a double-top breakout label under the selected settings. If a larger box size would not print that extra box, the same price movement may not create the same label. If the next O column reverses deeply enough to reject the break, the first label becomes only part of the pattern reading.
How This Connects Back to Point and Figure Charts
P&F patterns make the most sense after the chart’s construction rules are clear. The pattern name sits on top of the box size, reversal amount, X/O column sequence, and prior-column threshold.
Other non-time-based methods also depend on construction rules rather than fixed clock intervals. For example, a Kagi chart changes structure through its own reversal logic, while P&F patterns use X/O columns and box-based thresholds.
FAQ
What pattern is found in point and figure charts?
Common point and figure chart patterns include double-top breakouts, double-bottom breakdowns, triple-top breakouts, triple-bottom breakdowns, catapult patterns, congestion, and trap patterns. Each name describes X/O column structure around a selected threshold.
Are point and figure chart patterns the same as candlestick patterns?
No. Candlestick patterns are built from time-based candles, while point and figure chart patterns are built from X/O columns, box size, reversal amount, and threshold breaks.
Can box size change a point and figure pattern?
Yes. Box size can change whether a movement prints as a new mark, whether a threshold is crossed, and whether a pattern appears on the chart at all.