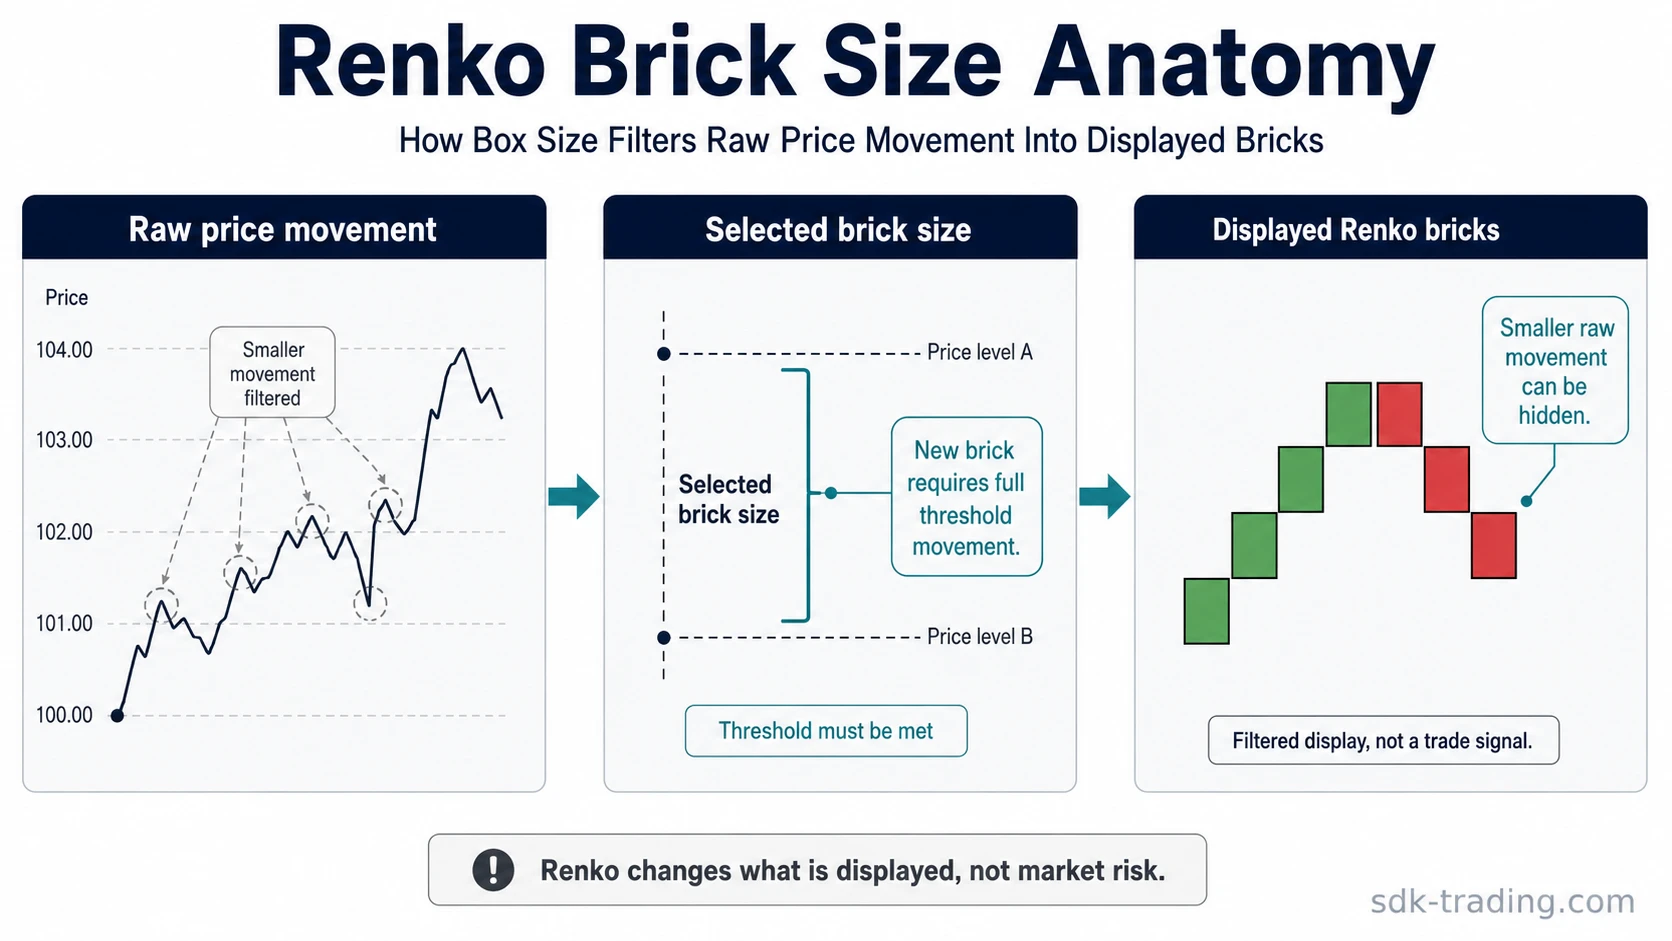
A Renko brick size is the selected price-movement threshold that must be met before a new Renko brick appears.
It is also often called Renko box size. The setting controls which price movement becomes visible on the Renko display and which smaller movement is filtered out. It does not define trade direction, trade quality, or whether a market is safe to trade.
Definition: Renko brick size is the amount of price movement required before the chart adds a new brick. A 2-point brick size requires a full 2-point movement before a new displayed brick can form.
Key Points
- Renko brick size controls the price threshold for each displayed brick.
- Smaller brick sizes usually show more movement, but they can also show more noise.
- Larger brick sizes usually filter more movement, but they can add lag.
- Fixed and ATR-based sizing can produce different chart behavior.
- Brick size is a display-construction setting, not a trading signal.
What Renko Brick Size Controls
Renko brick size belongs to Renko chart construction. A Renko chart does not add a new brick simply because a new minute, hour, or session begins. A new brick appears only when the required price movement is met according to the chart’s calculation method.
This makes brick size the main filter between raw price movement and displayed Renko structure. A smaller threshold lets more movement appear. A larger threshold removes more minor movement from view. The result can look cleaner than a standard time-based chart, but that cleaner view is still a filtered display.
Important boundary: A filtered Renko display can hide raw opens, closes, gaps, wicks, and intraperiod movement. Brick size changes what the chart displays; it does not remove market risk or prove that a move has better quality.
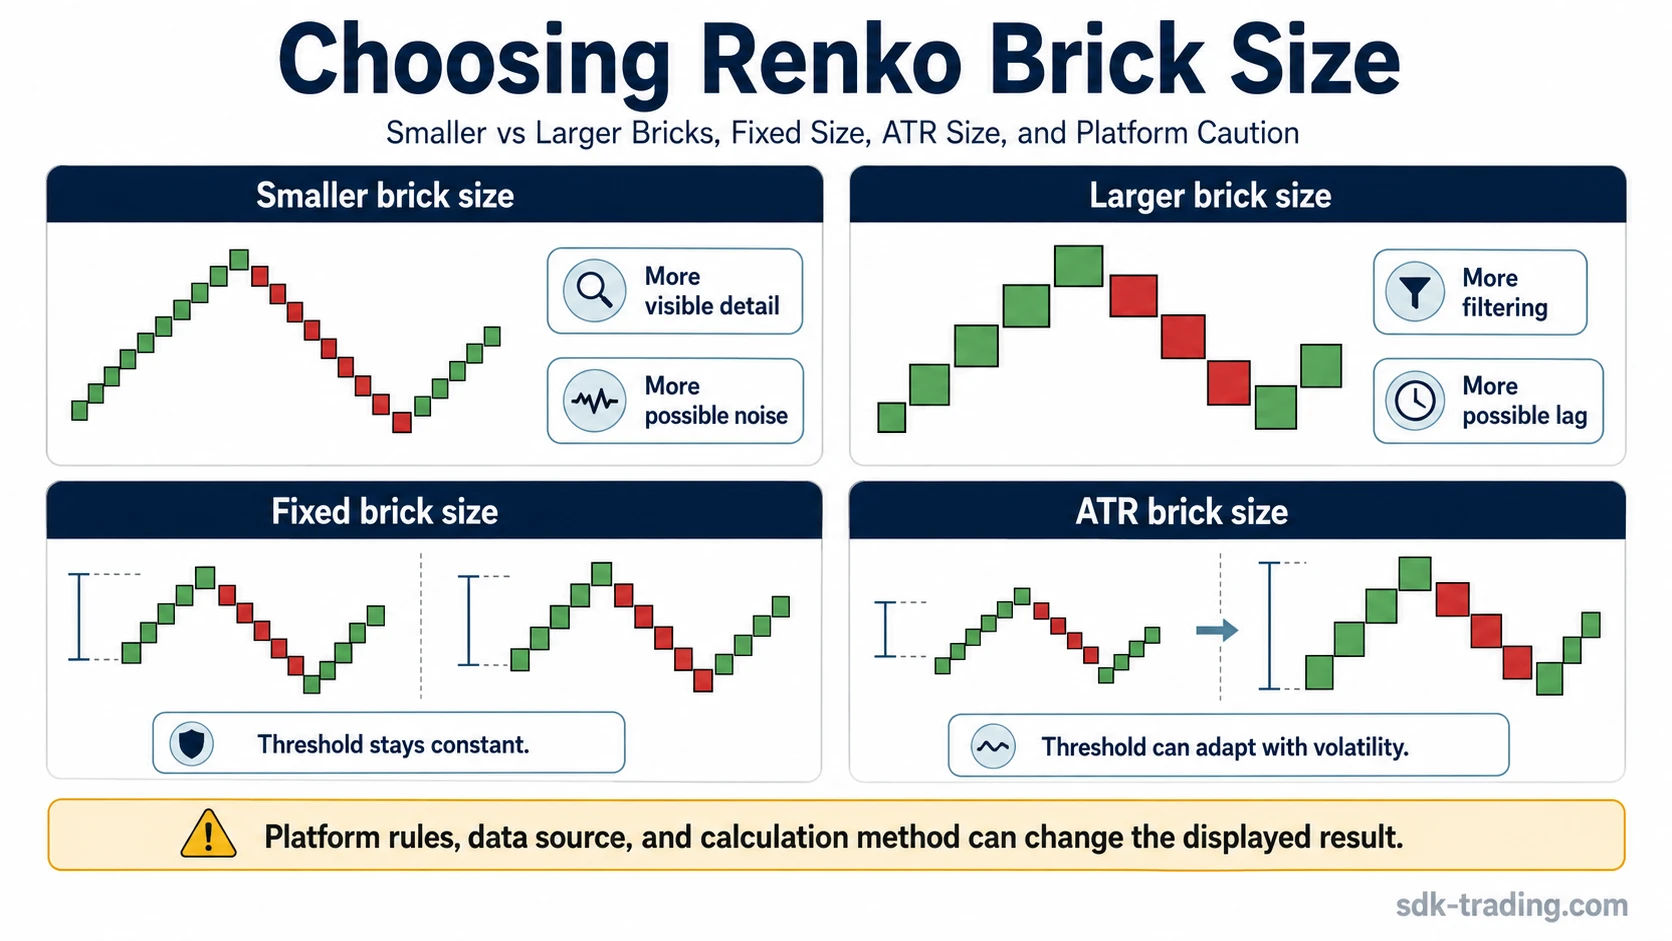
Fixed vs ATR Renko Brick Size
A fixed Renko brick size uses a manually selected price amount. If the fixed size is 2 points, each displayed brick requires a 2-point movement according to the platform’s construction rules. Fixed sizing keeps the threshold stable, which can make chart comparisons easier across the same instrument and setting.
An ATR Renko brick size uses Average True Range as an adaptive input. Because ATR changes with volatility, the brick size can expand or contract as market conditions change. That can make the display more responsive to volatility, but it can also make historical comparisons less direct because the threshold may not stay constant.
Some platforms may also offer percentage-based, last-traded-price, close-based, OHLC-based, or tick-data variants. These choices can change how the same market movement appears on the Renko display, so two charts with the same visible label may still differ if their calculation settings or data sources are not the same.
Practical distinction: Fixed sizing keeps the threshold stable. ATR sizing adapts to volatility. Neither method is automatically better; each changes the balance between sensitivity, filtering, and comparability.
Smaller vs Larger Renko Brick Sizes
A smaller Renko brick size usually creates more bricks because less price movement is required before the display updates. This can make turns and short swings appear sooner, but it can also increase visual noise and make the chart look more active than the broader structure justifies.
A larger Renko brick size usually creates fewer bricks because more price movement is required. This can reduce minor movement and make the displayed structure look smoother, but it can also delay visible turns and hide movement that might matter on a raw price chart.
The useful question is not which brick size is universally best. The useful question is what the chosen size filters out, what it delays, and whether the display still matches the instrument, volatility, timeframe context, and analysis purpose.
Condition, Implication, and Limitation
| Brick size condition | Display implication | Common misread | Safer interpretation |
|---|---|---|---|
| Small fixed brick size | More bricks can appear because less price movement is needed. | The chart looks more responsive, so the movement must be more useful. | Responsiveness can increase detail, but it can also increase noise and false visual structure. |
| Large fixed brick size | Fewer bricks can appear because more price movement is required. | The cleaner structure must be more reliable. | Cleaner structure can reflect stronger filtering, but it can also add lag and hide important raw movement. |
| ATR-based brick size | The threshold can change as volatility changes. | Adaptive sizing automatically solves the brick-size problem. | ATR sizing can adjust to volatility, but changing thresholds can make comparisons less straightforward. |
| Close-based calculation | Bricks may depend on closing values rather than every intraperiod move. | A missing brick means the price never moved far enough intraperiod. | The missing brick may reflect the calculation method, not the absence of intraperiod movement. |
| Different platform or data source | The same nominal brick size may not display identically everywhere. | All Renko charts with the same brick size should match. | Platform rules, data source, aggregation, and historical calculation can affect the displayed result. |
A Simple Renko Brick Size Example
For example, suppose a Renko chart uses a 2-point brick size and the displayed reference price is 100. If price moves to 101.50, the move has not reached the full 2-point threshold, so a new brick may not appear. If price reaches 102 according to the chart’s calculation rule, one new brick can appear.
If price moves from 100 to 101.80 and then reverses before meeting the required threshold, the filtered Renko display may not show that full intraperiod movement. The raw price chart may still show details that the Renko display compresses or removes.
The numbers describe chart construction only, not a real market event, trade setup, or forecast.
Reversal Threshold and Opposite Bricks
Renko reversal behavior can create additional confusion because an opposite brick may require more than a small pullback. Depending on the platform and Renko style, price may need to move enough in the opposite direction before a new opposite brick appears. This is one reason a Renko chart can look stable while raw price is already moving inside the filtered range.
A visible turn on a Renko chart is therefore a displayed construction result. It should not be treated as automatic evidence that a trend has reversed, continued, or become tradeable.
Platform and Data-Source Differences
Renko brick size settings can behave differently across platforms because construction rules are not always identical. One platform may calculate bricks from closing prices, another may use OHLC data, and another may support tick-based construction. Historical bricks may also be reconstructed differently from real-time bricks.
Timeframe aggregation can matter as well. A Renko chart built from one source or aggregation setting may filter movement differently from a chart using another source, even when the visible brick-size number looks similar.
Platform caution: Renko brick size should be interpreted together with the platform’s calculation method, data source, and historical handling. A chart setting is not fully comparable unless the construction rules are comparable too.
Common Mistakes With Renko Brick Size
| Mistake | Why it creates risk | Cleaner interpretation |
|---|---|---|
| Looking for one best Renko brick size | Different instruments, volatility conditions, and chart settings can require different display thresholds. | Treat brick size as a conditional display choice, not as a universal answer. |
| Assuming smaller bricks are more accurate | More detail can also mean more noise and more frequent displayed turns. | Check what the smaller size reveals and what false structure it may create. |
| Assuming larger bricks are safer | More filtering can hide movement and delay visible structure changes. | Check whether the larger size removes information that still matters for interpretation. |
| Treating brick color changes as signals | Color changes reflect displayed construction, not automatic direction quality. | Separate display changes from broader market context and raw price behavior. |
| Ignoring the raw price chart | Renko can compress or hide gaps, exact opens, exact closes, and intraperiod reactions. | Use raw price context when exact price behavior matters. |
How to Think About Renko Brick Size
Renko brick size should be chosen by asking what movement needs to be visible and what movement can be filtered without distorting the analysis. A very small setting may show too many minor shifts. A very large setting may remove useful structure and delay visible changes.
ATR sizing can help the threshold adapt when volatility changes, but it does not make the display objective. Fixed sizing can make the threshold easier to compare, but it can become too sensitive or too slow if volatility changes materially.
The setting is best treated as a chart-construction control. It can help organize price movement visually, but it is not an entry method, exit method, stop placement method, target method, or proof of trend quality.
Related Non-Time-Based Chart Context
Renko brick size is only one way that non-time-based charts filter price movement. A Kagi chart uses a different construction logic, with line direction and reversal amount rather than equal Renko bricks. The shared idea is filtering regular time spacing, but the displayed structure is not the same.
That distinction matters because changing a Renko brick size changes the threshold for Renko bricks. It does not turn the chart into another non-time-based method, and it does not remove the need to understand how the chosen display is built.
FAQ
What is the difference between Renko brick size and Renko box size?
Renko brick size and Renko box size usually refer to the same setting: the price movement required before a new Renko brick appears. The exact behavior can still depend on the platform’s calculation method.
Is a smaller Renko brick size better?
A smaller Renko brick size is not automatically better. It can show more detail and more frequent bricks, but it can also increase chart noise and make minor movement look more meaningful than it is.
Is ATR Renko better than fixed Renko brick size?
ATR Renko is not automatically better than fixed sizing. ATR sizing can adapt to volatility, while fixed sizing keeps a stable threshold. The better fit depends on the analysis need, data source, and platform behavior.
Does Renko brick size create trading signals?
No. Renko brick size controls chart construction. It does not create a buy signal, sell signal, entry, exit, stop, target, or forecast by itself.