Renko chart patterns are visual structures formed by price-movement bricks on a filtered Renko display. They are not time-based candlestick patterns, and they should not be read as standalone trade signals.
A Renko pattern can look cleaner than the same market movement on a standard price chart because the display removes much of the time-based noise. That clarity is useful for describing structure, but it can also create false confidence when the filtered display is treated as the whole market record.
Core idea: Renko chart patterns describe the shape of bricks after price has moved enough to create new Renko blocks. The label describes the filtered structure. It cannot confirm reversal quality, continuation quality, probability, or trade timing by itself.
What Renko Chart Patterns Show
Renko chart patterns show how filtered price movement arranges itself into recognizable shapes. A repeated upper brick area may look like a double top. A repeated lower brick area may look like a double bottom. A sequence of rising and falling brick turns may resemble a reversal structure, a breakout structure, or a simplified support and resistance reaction.
The important distinction is that the pattern is built from displayed bricks, not from every tick, candle, wick, gap, or intraperiod move. A clean Renko formation can describe the filtered path of price movement while still hiding details that would matter on a standard chart.
That makes Renko pattern recognition useful for visual organization. It becomes weaker when treated as evidence that the market has accepted a level, reversed a trend, or created a complete trading decision.
How Renko Patterns Form on Filtered Bricks
A Renko chart creates a new brick only after price moves by the selected brick amount. Equal clock time is not the construction rule. A quiet period and a fast period can occupy very different amounts of real time while producing a similar number of displayed bricks.
This construction changes how patterns appear. Small counter-moves may disappear. Choppy price action may look smoother. A level may appear cleaner because the bricks remove wicks and partial movement that would be visible on a time-based candle chart.
Condition: Renko construction filters raw market movement into bricks.
Implication: Pattern shapes can look more orderly than the underlying price path.
Limitation: A clean Renko shape is not enough to establish reversal, continuation, trade quality, or probability.
Common Renko Pattern Labels
Common Renko pattern labels usually borrow familiar chart-pattern language, but the construction is different because the structure is brick-based. The same label can describe a useful visual relationship while still needing context before any stronger interpretation is made.
| Renko pattern label | What it describes | What it does not prove |
|---|---|---|
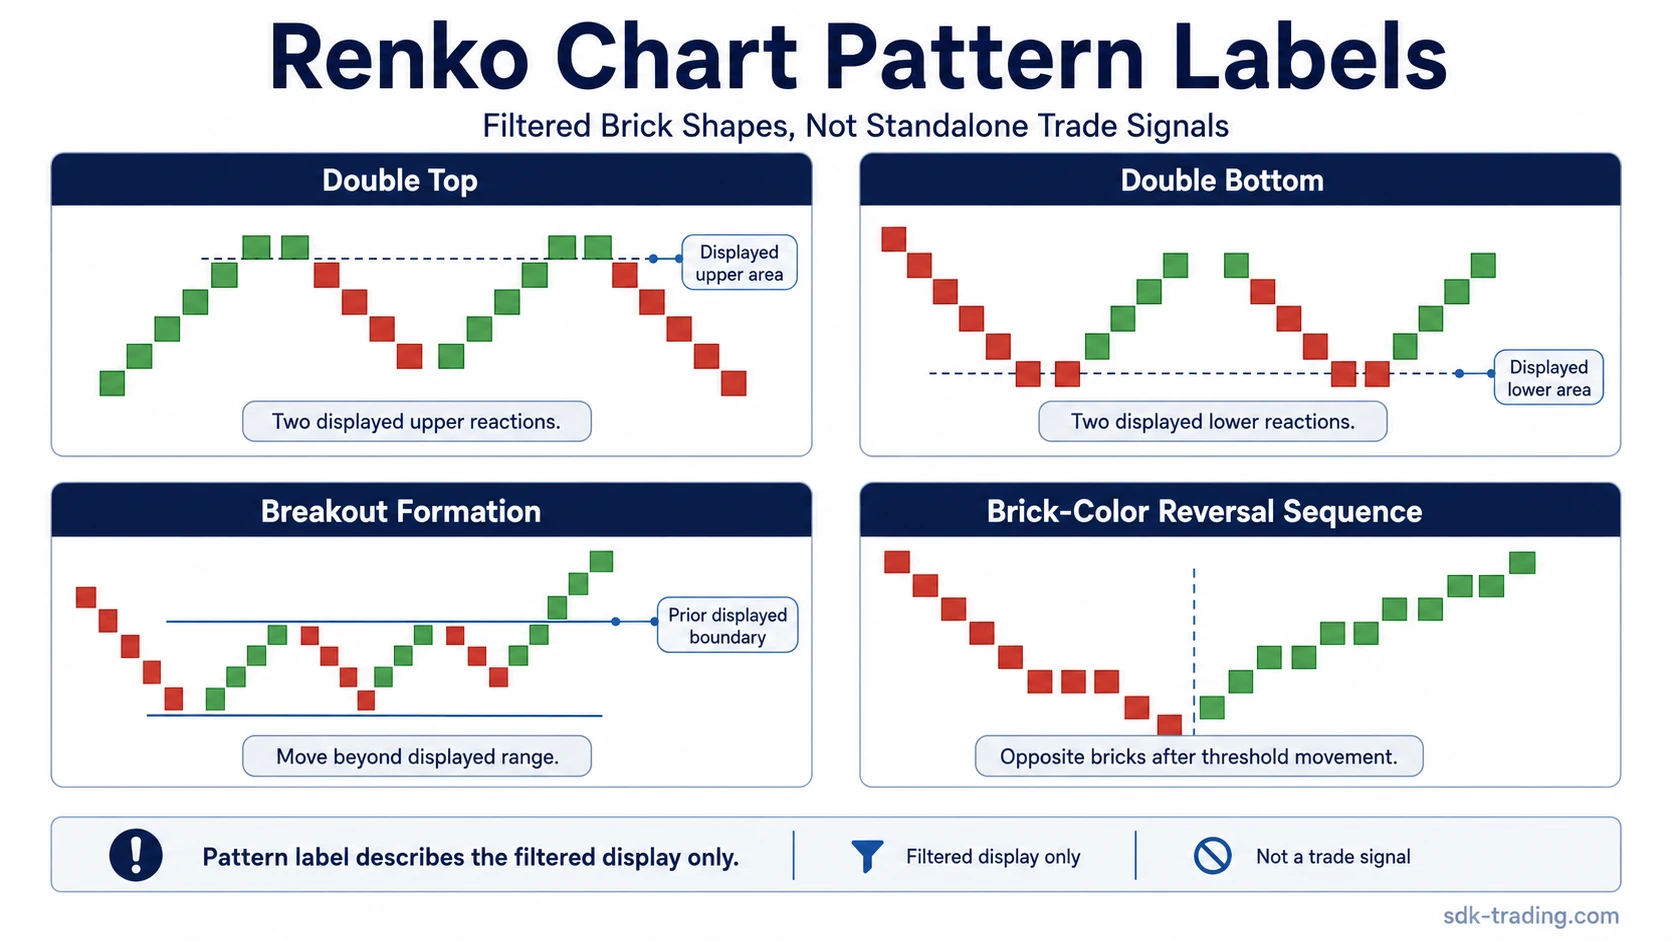
| Double top | Two visible attempts to reach or reject a similar upper brick area. | It does not settle whether the market must reverse from that area. |
| Double bottom | Two visible attempts to reach or reject a similar lower brick area. | It does not confirm that downside movement has ended. |
| Head and shoulders | A filtered sequence where a middle high sits above two surrounding highs. | It does not confirm that the neckline area will hold or break cleanly. |
| Support and resistance reaction | Repeated brick turns around a similar displayed price area. | It does not prove that raw price accepted or rejected the level with clean market structure. |
| Breakout formation | A brick move beyond a prior displayed range or repeated brick boundary. | It does not confirm breakout acceptance, follow-through, or continuation quality. |
| Brick-color reversal sequence | A shift from one brick direction to the opposite brick direction after enough movement. | It should not be treated as trend change evidence on its own. |
How to Identify Renko Patterns Without Overreading Them
Renko pattern identification starts with the displayed brick structure. The main questions are simple: where did bricks repeatedly turn, where did bricks extend beyond a prior area, and how many bricks were needed before the opposite direction appeared?
A safer reading separates description from conclusion. A double top describes two displayed reactions near a similar upper area. A breakout describes a move beyond a displayed boundary. A reversal sequence describes enough opposite movement to print bricks in the other direction. None of those labels, by itself, answers whether the structure is tradable, whether the move has enough confirmation, or whether standard price candles support the same interpretation.
Diagnostic boundary: A Renko pattern is present when the filtered brick display forms the shape. The interpretation is supported only when the selected brick size, repeated reaction behavior, and standard price chart point in the same direction. If standard candles show failed acceptance, gaps, wide wicks, or unstable overlap against the Renko shape, the pattern remains only a display label.
| Identification step | What to check | Safer reading |
|---|---|---|
| Locate the displayed structure | Repeated brick highs, repeated brick lows, boundary breaks, or color shifts. | Name the visible pattern before drawing a market conclusion. |
| Check brick size | Whether the selected brick size is small, large, fixed, or volatility-based. | Treat the pattern as partly shaped by the filter setting. |
| Compare with raw price | Wicks, gaps, failed closes, overlap, and timing that Renko may hide. | Use standard price context to decide how much weight the Renko pattern deserves. |
| Separate label from decision | Whether the pattern is being used as description or as a trade conclusion. | Keep the Renko label descriptive unless broader evidence supports interpretation. |
How Brick Size Changes Pattern Appearance
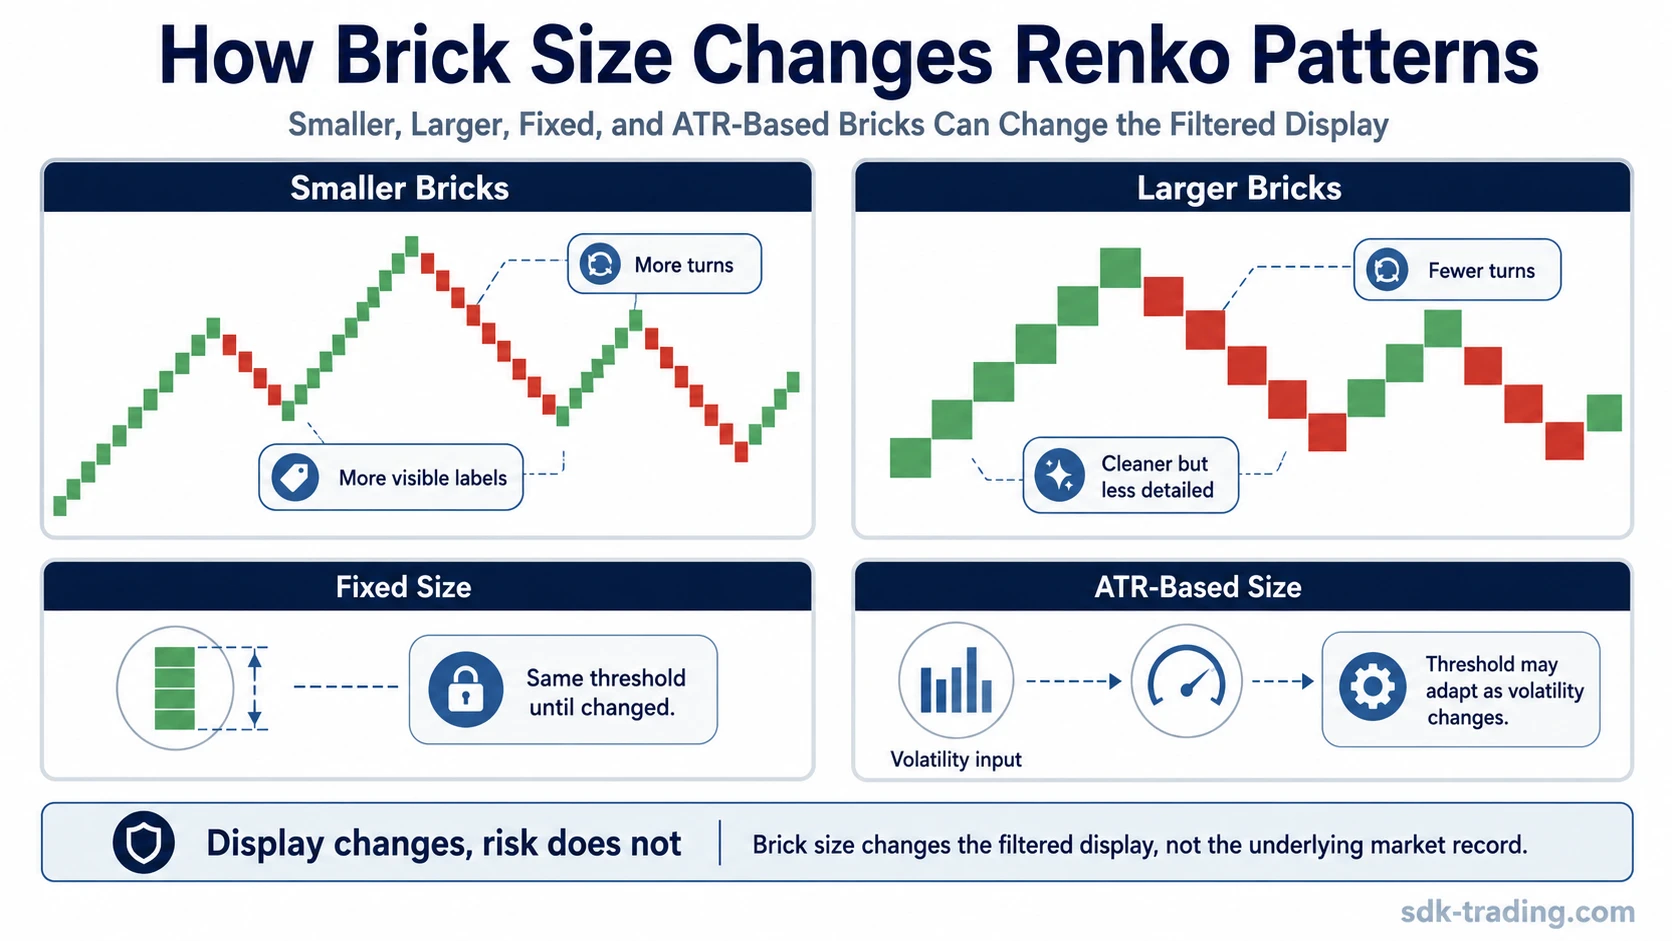
Brick size has a major effect on Renko chart patterns. A smaller brick size can create more turns, more visible reactions, and more frequent pattern labels. A larger brick size can reduce smaller movements and make the same price history appear cleaner or simpler.
This does not mean one brick size is automatically better. It means the pattern is partly a product of the display setting. A double bottom on a small-brick chart may become a smoother continuation or a less visible reaction on a larger-brick chart. An apparent breakout on one setting may look less distinct on another.
| Brick-size condition | Likely display effect | Interpretation risk |
|---|---|---|
| Smaller bricks | More bricks, more turns, more potential labels. | Can make the chart look more active than the useful structure justifies. |
| Larger bricks | Fewer bricks, smoother formations, less minor movement. | Can hide smaller failed tests, volatility, or earlier reaction detail. |
| Fixed brick size | The same movement threshold is used until the setting is changed. | The chart may not adapt to changing volatility unless the user changes the setting. |
| ATR-based brick size | The threshold may adjust as volatility changes, depending on platform calculation. | Older and newer parts of the chart may not be directly comparable without understanding the calculation method. |
Brick-size limitation: Brick size changes the filtered display. It does not remove market risk, prove that a pattern is stronger, or make a Renko label more reliable by itself.
Raw Price Context Still Matters
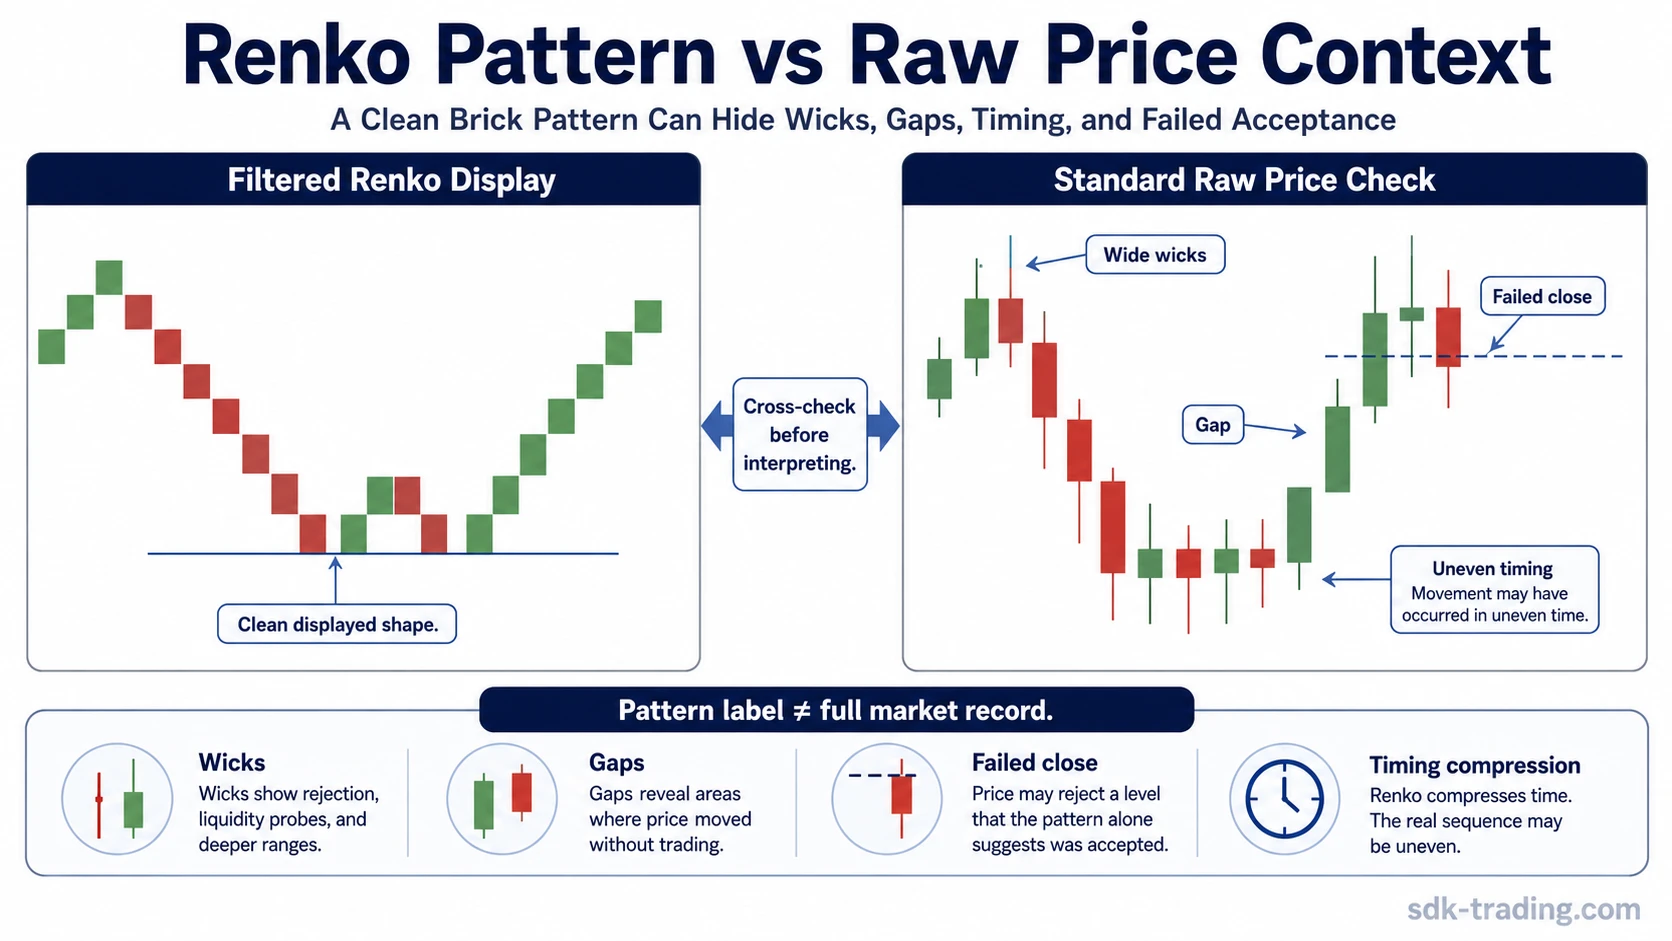
Renko charts can hide details that are visible on standard candles. A filtered brick display may show a neat double bottom while the raw chart shows deep lower wicks, a gap, a failed close above a reaction area, or a fast reversal that happened inside a short period.
Those details do not automatically invalidate the Renko pattern label. They do change the quality of the interpretation. A displayed pattern is stronger as a chart-reading observation when the raw price chart supports the same structure with cleaner acceptance, less contradictory overlap, and more coherent reaction behavior.
Example: A Renko chart may show two lower brick reactions near the same area, creating a double-bottom label. If the standard candle chart shows that the second reaction came from a gap, a wide wick, and a failed close back above the prior reaction zone, the Renko label remains descriptive, but the broader interpretation becomes less secure.
Safer Interpretation Framework
A safer Renko pattern reading uses the brick pattern as one layer, not the entire conclusion. The goal is to understand what the filtered chart is showing and what it may be hiding.
- Name the displayed pattern: Identify the Renko shape without turning the label into a forecast.
- Check the construction setting: Review brick size and whether the chart uses fixed or volatility-based bricks.
- Compare with standard price candles: Look for wicks, gaps, failed closes, and acceptance behavior that the Renko chart may compress.
- Check the surrounding structure: Treat support, resistance, range boundaries, and trend context as separate evidence.
- Keep the conclusion conditional: A Renko pattern can support chart organization, but it should not become a complete trade decision by itself.
This framework also helps compare Renko with other non-time-based chart types. A Kagi chart, for example, filters price movement differently from time-based candles. The shared caution is the same: the display can clarify structure while compressing details that still matter for interpretation.
Key Limitations of Renko Chart Patterns
- Time compression: Renko bricks do not preserve equal time intervals, so the visual rhythm may not show how quickly movement happened.
- OHLC compression: Standard open, high, low, and close detail can be reduced or hidden by the brick display.
- Raw-price loss: Wicks, gaps, failed tests, and intraperiod volatility may be less visible or absent.
- Volume context: Volume interpretation can become less direct when the chart is no longer organized by standard time candles.
- Brick-size sensitivity: Smaller and larger brick settings can create materially different-looking pattern structures.
- Delayed display risk: A brick appears only after the selected movement threshold is met, so the visible pattern may form after part of the underlying move has already occurred.
How Renko Chart Patterns Fit Into Chart Reading
Renko chart patterns are best treated as filtered structure labels. They can simplify visual analysis by showing repeated reaction areas, directional brick movement, breakout displays, and reversal sequences without the full noise of time-based candles.
The stronger use is descriptive and conditional: identify the displayed pattern, check how the brick size shaped it, compare it with standard price behavior, and keep the label separate from any broader trading conclusion. The pattern is the surface of the filtered display. The missing context decides how much weight that surface deserves.