In trading and market analysis, market breadth measures how widely stocks or other securities participate in a market move. A breadth reading can look strong or weak on the surface, but the interpretation can mislead when the counted input, threshold, index structure, and later participation behavior are ignored.
Definition: Market breadth is the study of participation beneath index price movement. It asks whether many securities are moving with the index, or whether the index is being carried by a smaller group of names.
Key Points
- Market breadth measures participation across securities, not only the price direction of an index.
- Common inputs include advancing and declining stocks, new highs and lows, moving-average participation, and up-volume versus down-volume data.
- A single threshold can mislead if the input, index weighting, and follow-through are not checked.
- Divergence means price and participation are out of sync; it does not guarantee a reversal or continuation.
- Specific breadth indicators need separate interpretation because each one measures participation differently.
What Market Breadth Measures
Market breadth measures the distribution of participation inside a market, sector, exchange, or index. A rising index with broad participation usually carries a different message from a rising index led by a small number of large components.
The core question is simple: how many securities are supporting the move? Price can show the headline direction, while breadth examines whether participation is broad, narrow, expanding, or fading beneath that price move.
Market breadth differs from a single-series trend tool because it does not study only one price line. It studies many securities together, then converts their participation into a reading that may support, question, or qualify the price move.
How Market Breadth Is Calculated
Market breadth can be calculated from several participation inputs. The input matters because two breadth readings can point in different directions when they count different things.
| Breadth input | What it counts | Main interpretation risk |
|---|---|---|
| Advancing vs declining securities | How many stocks rise compared with how many fall | A ratio can look strong for one session but fade without follow-through |
| New highs and new lows | How many securities are reaching fresh highs or lows | Extreme readings may reflect concentration, exhaustion, or broad pressure depending on context |
| Moving-average participation | How many stocks trade above or below a selected moving average | The reading can lag after price has already moved sharply |
| Up volume vs down volume | Whether more trading volume occurs in rising or falling securities | Volume pressure can be distorted by a few heavily traded components |
A breadth reading is only as useful as the participation input behind it. Before interpreting the number, the counted universe, calculation method, and threshold behavior need to be clear.
Why One Breadth Reading Can Mislead
The common mistake is treating one breadth threshold as proof. A strong-looking breadth value can still be unreliable when it comes from a narrow universe, a short-lived surge, or an index where a few large components dominate the headline price.
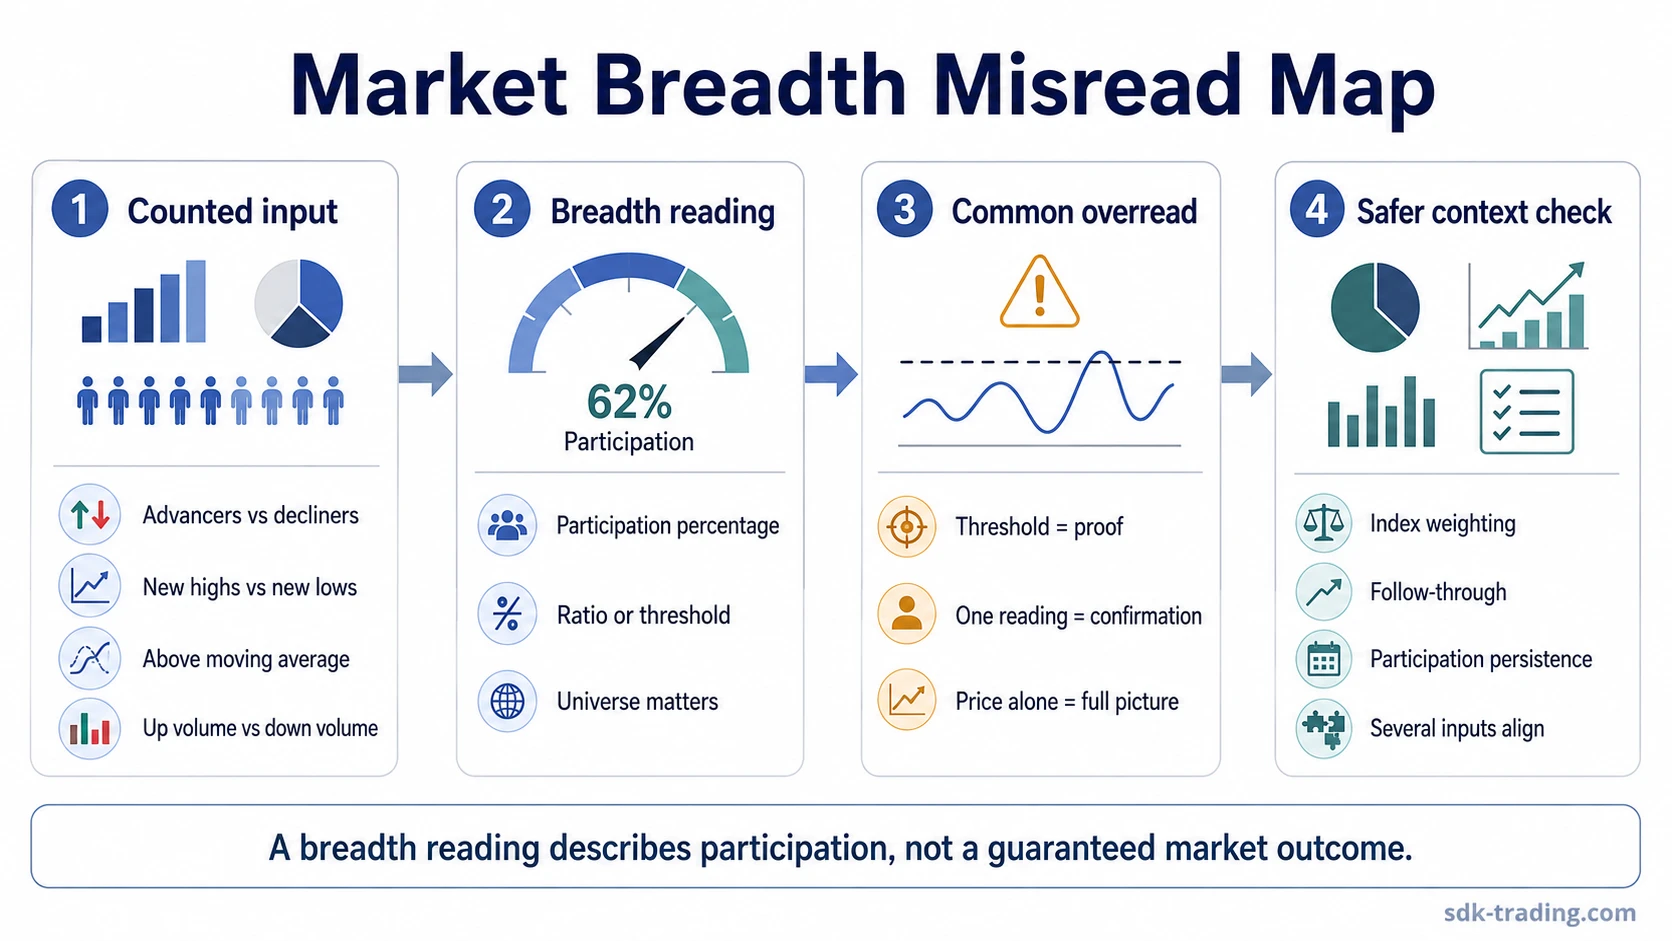
Market Breadth Misread Map:
| Trigger condition | Common overread | Safer interpretation | What strengthens or weakens it |
|---|---|---|---|
| A breadth ratio moves above a familiar threshold | The market has confirmed strength | The threshold marks participation at that moment, not proof of durable strength | More reliable if broad participation persists; less reliable if the reading fades on the next check |
| An index rises while fewer components participate | The uptrend is healthy because price is still rising | The move may be concentrated rather than broadly supported | Improves when more groups join the move; deteriorates when leadership becomes even more concentrated |
| A breadth reading turns weak during a pullback | The move has failed | The reading may show pressure, but later participation behavior decides whether weakness persists | More useful if weak participation continues; less useful if participation recovers quickly |
| Different breadth measures disagree | One measure must be wrong | Each measure may be counting a different participation layer | Clearer when several inputs align; less clear when the measured universe changes |
Market Breadth and Index Price Can Diverge
Divergence appears when index price and participation move out of sync. A common reading problem appears when an index keeps rising while fewer stocks advance, fewer stocks hold above key moving averages, or fewer names reach new highs.
That mismatch does not predict a specific outcome. It shows that headline price and underlying participation are telling different stories. The interpretation becomes more useful when narrowing participation continues across several measures instead of appearing in one isolated reading.
Market Breadth Example in Context:
Price advances into a prior resistance area and the index closes higher, but fewer components advance than during the previous push. At the same time, new highs fail to expand and moving-average participation begins to flatten. The rise may still continue, but the breadth profile is less broad than the index price alone suggests.
The reading improves if more groups begin participating and breadth expands on later advances. It remains weaker or unresolved if the index keeps rising while participation narrows further.
Stronger vs Weaker Breadth Readings
Market breadth works best as a context measure. It can support a market view when participation expands with price, and it can question a market view when price rises or falls without broad confirmation from the underlying securities.
| Reading condition | Interpretation support | Limitation |
|---|---|---|
| Price rises and participation broadens | The move has wider internal support | Broad participation can still require context near extreme readings |
| Price rises while participation narrows | The move may be more concentrated | Narrowing can persist before price responds |
| Price falls and participation weakens broadly | Weakness is spread across more securities | Short-term selling pressure can reverse quickly |
| Price falls while participation stabilizes | Internal pressure may be easing | Stabilization is not the same as a durable turn |
Threshold-based breadth tools can be useful, but the threshold should not be read mechanically. A Zweig Breadth Thrust reading, for example, belongs in a participation-thrust context rather than a simple strong-or-weak label.
Common Market Breadth Mistakes
Market breadth mistakes usually come from reading a useful participation measure as if it were a complete market call. Breadth can add context, but it cannot remove uncertainty from price behavior, index construction, or later participation changes.
| Mistake | Why it creates risk | Cleaner reading |
|---|---|---|
| Treating one threshold as proof | The threshold may capture only a short-lived participation burst | Check whether participation persists after the first reading |
| Ignoring index composition | A cap-weighted index can rise even when many components lag | Compare headline price with participation across the broader universe |
| Mixing different breadth inputs | Advancers, volume, highs/lows, and moving-average participation are not the same measure | Identify what each input counts before combining the readings |
| Calling divergence a prediction | Divergence can last longer than expected and may resolve in several ways | Use divergence as a participation warning, not as a guaranteed outcome |
Related Breadth Indicators
Market breadth is the broader participation idea. Individual breadth indicators translate that idea into specific measurements, and each one has its own input, threshold behavior, and limitation.
TRIN compares advancing and declining issues with advancing and declining volume, so it can highlight pressure and imbalance in a different way from simple advance-decline counts.
Participation thrust, highs versus lows, and volume-based pressure all start from the same broad idea: market breadth measures participation. The cleaner reading is to identify the input first, then decide whether that specific measure shows broad, narrow, persistent, or unstable participation.
FAQ
What does market breadth mean in trading?
Market breadth means the level of participation behind a market or index move. It checks whether many securities are moving with the index or whether the move depends on a smaller group of components.
How is market breadth calculated?
Market breadth can be calculated with inputs such as advancing versus declining securities, new highs versus new lows, moving-average participation, and up volume versus down volume. The calculation depends on which participation input is being measured.
Why can market breadth give a misleading reading?
Market breadth can mislead when one threshold is treated as proof, when index weighting hides narrow participation, or when a short-lived breadth move is not supported by later participation behavior.
Is market breadth the same as a market breadth indicator?
Market breadth is the broader participation concept. A market breadth indicator is a specific tool that measures one version of participation, such as advancing stocks, new highs and lows, or volume pressure.