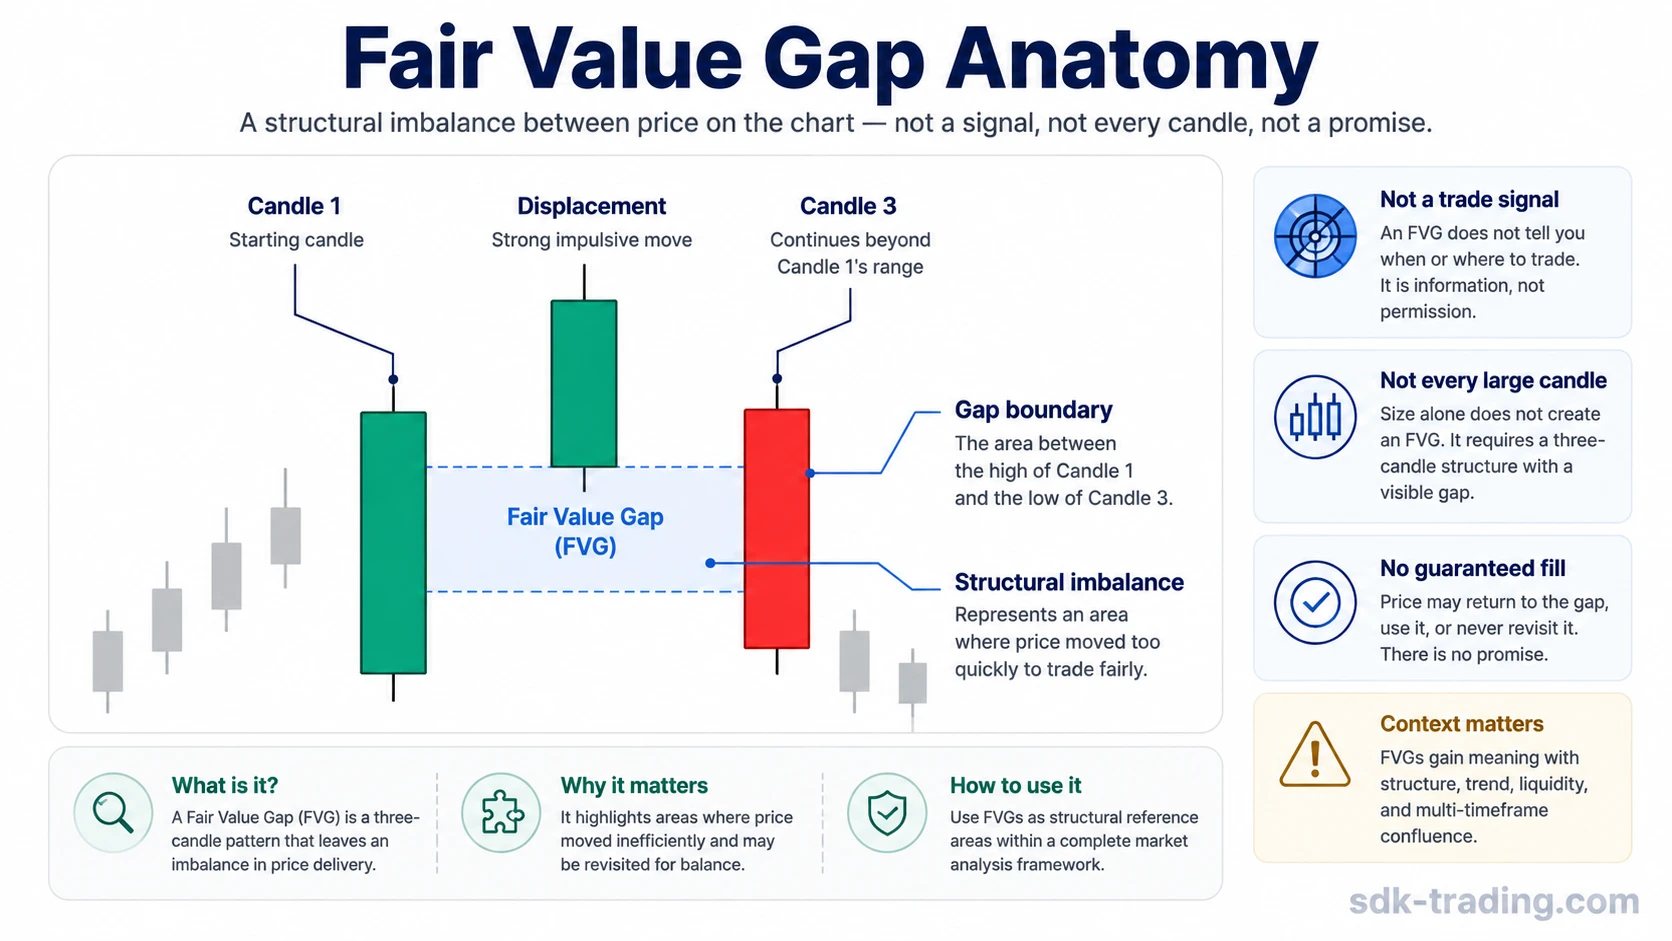
A fair value gap is a visible three-candle price-action structure where a fast price move leaves limited overlap between the first and third candles. The gap marks a structural imbalance in the candle sequence, not a complete trading plan.
In a clean fair value gap, the middle candle shows displacement, and the first and third candles leave an observable boundary. The label can help describe where price moved through an area with compressed two-sided interaction, but it does not define trade permission, entry, stop placement, target logic, or a guaranteed return into the gap.
Definition: A fair value gap is a three-candle price-action imbalance where displacement leaves a visible boundary between candle 1 and candle 3.
What Is a Fair Value Gap?
A fair value gap is a localized inefficiency inside a price sequence. It is usually identified by comparing the range of the first candle with the range of the third candle after a strong middle candle creates displacement.
The useful part of the concept is the boundary. Without a visible candle 1 to candle 3 separation, the reading becomes less precise. A large candle by itself is not enough. The structure needs the surrounding candles to show that price moved through an area without normal overlap.
| Component | What it shows |
|---|---|
| Candle 1 | The starting reference candle used to define one side of the boundary. |
| Candle 2 | The displacement candle that moves price quickly through the area. |
| Candle 3 | The confirmation candle used to test whether a visible boundary remains. |
| Gap boundary | The area between candle 1 and candle 3 that shows reduced overlap. |
What a Fair Value Gap Is Not
A fair value gap is easiest to misuse when the label is treated as a signal instead of a structural description. The pattern can identify an imbalance, but the label does not say what should be done with it.
| Fair value gap is | Fair value gap is not |
|---|---|
| A visible price-structure imbalance. | A trade signal by itself. |
| A three-candle boundary concept. | Every large candle on a chart. |
| A way to describe reduced overlap after displacement. | A guarantee that price must return to the area. |
| A structural reading that may need later context. | A complete model for entry, stop, target, or position management. |
How to Identify a Fair Value Gap
The basic identification step is to compare candle 1 and candle 3 around a displacement candle. If the first and third candles overlap normally, the structure is not a clean fair value gap. If a visible separation remains, the area can be read as a fair value gap candidate.
- Find a strong middle candle that moves price away from the prior area.
- Compare the high and low of candle 1 with the high and low of candle 3.
- Look for a visible space between candle 1 and candle 3.
- Check whether the displacement is clear or whether the move is choppy and overlapping.
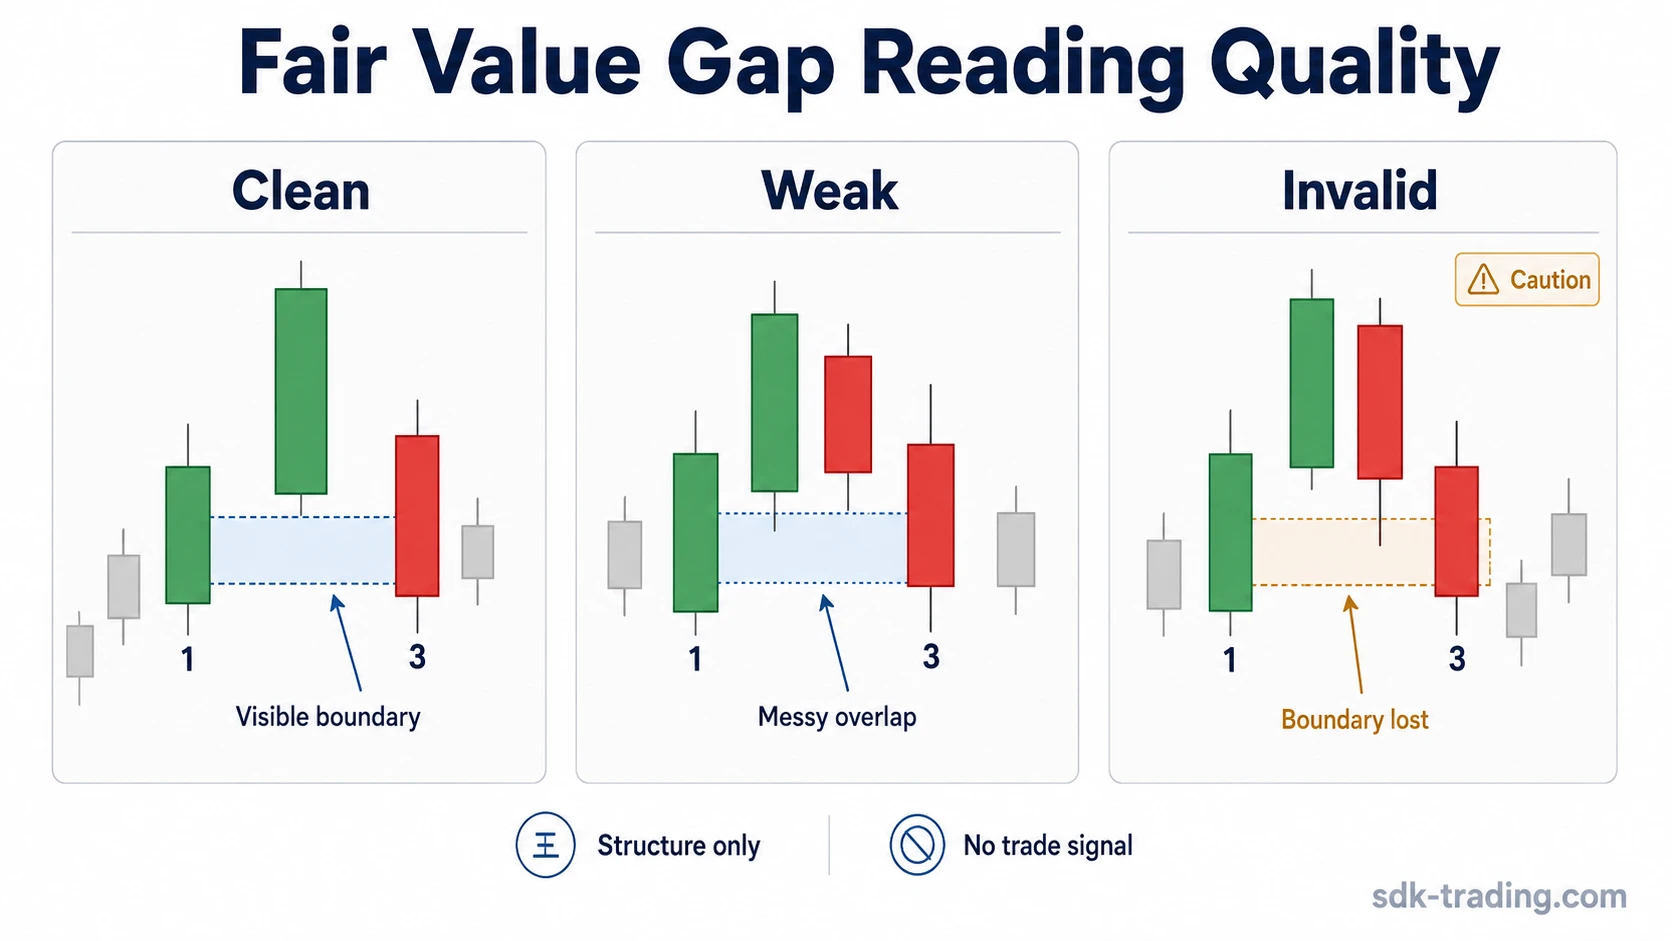
- Classify the reading as clean, weak, or invalid instead of assuming every candidate matters equally.
Boundary check: if the label depends only on a large middle candle and the first and third candles do not leave a visible separation, the structure is not a clean fair value gap.
The structure is stronger when the boundary is easy to see without forcing the interpretation. It is weaker when the only reason for the label is a large candle, a tiny spacing difference, or a messy sequence with heavy overlap.
Bullish vs Bearish Fair Value Gap
A bullish fair value gap and a bearish fair value gap use the same three-candle logic, but the direction of displacement is different.
| Type | Observable structure | What it can indicate |
|---|---|---|
| Bullish fair value gap | Candle 1 high is below candle 3 low after upward displacement. | Price moved upward through an area with reduced overlap. |
| Bearish fair value gap | Candle 1 low is above candle 3 high after downward displacement. | Price moved downward through an area with reduced overlap. |
The bullish or bearish label describes the direction of the imbalance. It does not automatically mean continuation, reversal, or any specific trade action.
Why Fair Value Gaps Form
Fair value gaps form when price moves quickly enough that the candle sequence leaves limited overlap. This is often described as displacement because the middle candle carries price away from the prior area faster than a more balanced sequence would.
The structure may show that one side of the market was more aggressive during that short sequence. That interpretation should stay conditional. The chart can show displacement and reduced overlap; it cannot prove the exact intent of every participant behind the move.
The most useful reading is therefore observable: did price leave a clear three-candle boundary, or is the label being forced onto a normal volatile candle?
Fair Value Gap vs Classic Gap
A classic gap usually refers to a space between separate candles or trading sessions, such as a market opening above or below the prior session’s range. A fair value gap is usually read inside a candle sequence, where the first and third candles leave a visible separation around a displacement candle.
| Concept | Main boundary | Typical reading |
|---|---|---|
| Classic gap | Space between one candle or session and the next. | Often tied to opens, sessions, or separate candle-to-candle jumps. |
| Fair value gap | Space between candle 1 and candle 3 around displacement. | Read as a structural imbalance inside a three-candle sequence. |
The difference matters because the two labels describe different chart features. Calling every classic gap a fair value gap, or every fair value gap a session gap, blurs the structure.
Fair Value Gap vs Imbalance and Liquidity Void
Imbalance is the broader idea. It describes a market sequence where price moves with uneven participation or limited two-sided interaction. A fair value gap is a narrower, more observable form of imbalance because it uses a specific three-candle boundary.
A liquidity void can also describe a fast movement through price with limited interaction, but the term is often broader and less tied to the exact candle 1 to candle 3 structure. The fair value gap label is more useful when the boundary can be identified directly.
| Term | Scope | Boundary requirement |
|---|---|---|
| Imbalance | Broad structural idea. | May not require a specific three-candle boundary. |
| Liquidity void | Broad fast-move concept. | May describe a larger area of thin interaction. |
| Fair value gap | Narrower price-action structure. | Needs a visible candle 1 to candle 3 gap around displacement. |
Clean, Weak, and Invalid Fair Value Gaps
The strongest way to read a fair value gap is not to ask whether price later produced a desired outcome. The better diagnostic question is whether the original structure was visible, specific, and still meaningful after later price behavior.
| Classification | Observable features | Interpretation control |
|---|---|---|
| Clean fair value gap | Clear displacement, visible candle 1 to candle 3 boundary, limited overlap. | The structure is easy to identify without forcing the label. |
| Weak fair value gap | Messy overlap, unclear displacement, choppy candles, or a very small boundary. | The interpretation weakens because the gap logic is not visually strong. |
| Invalid or false positive | No real candle 1 to candle 3 boundary, or later price behavior removes the visible gap logic. | The label should not be preserved just because the middle candle was large. |
This classification keeps the concept tied to observable structure. A clean label should come from the chart boundary, not from a later outcome or a preferred market story.
Common Fair Value Gap Misreadings
A fair value gap is often misread when the label is separated from the actual three-candle boundary. The safer approach is to keep each reading tied to visible structure rather than outcome, expectation, or trade logic.
| Misreading | Safer reading |
|---|---|
| Every large candle is a fair value gap. | A large candle may create displacement, but candle 1 and candle 3 still need to leave a visible boundary. |
| Every imbalance is a fair value gap. | Imbalance is broader. A fair value gap needs the specific three-candle structure. |
| Price has to fill every fair value gap. | Price may return to the area, but the structure does not create a guaranteed fill requirement. |
| The gap proves participant intent. | The chart can show displacement and reduced overlap, but it cannot prove why every participant acted. |
| A fair value gap is a complete trading model. | The label describes structure. It does not define entry, risk, target, or trade permission. |
Related Price Action Concepts
A fair value gap should stay separate from nearby imbalance and block concepts. It describes a three-candle imbalance boundary, while a breaker block focuses on a failed reference area that later may be read from the opposite side.
It is also different from a mitigation block, which focuses on a return into a prior reference area rather than the candle 1 to candle 3 gap boundary itself.
These concepts can appear near each other on a chart, but they do not mean the same thing. A fair value gap describes the three-candle imbalance boundary; role-flip, mitigation, and reference-area logic describe different chart behavior.
Fair Value Gap FAQ
What is a fair value gap in trading?
A fair value gap is a three-candle price-action structure where displacement leaves a visible gap between candle 1 and candle 3. It describes a structural imbalance, not a complete trading plan.
Is every imbalance a fair value gap?
No. Imbalance is broader. A fair value gap is a specific form of imbalance that needs a visible three-candle boundary.
Does price have to fill a fair value gap?
No. Price may return to a fair value gap, but the structure does not guarantee a fill or require price to revisit the area.
What makes a fair value gap invalid?
A fair value gap reading becomes invalid or weak when there is no real candle 1 to candle 3 boundary, when overlap is too messy, or when later price behavior removes the visible gap logic.